Cryogenic Centrifugal Pump Sourcing Guide: 2025 Executive Strategic Briefing
Executive Contents
Executive Market Briefing: Cryogenic Centrifugal Pump
Executive Market Briefing – Cryogenic Centrifugal Pump 2025
BLUF
The 2025 global market for cryogenic centrifugal pumps is valued at USD 4.5 billion, expanding at a 7.5% CAGR toward USD 7.5 billion by 2032. Capacity is concentrated in three national hubs—China (42% of global output), Germany (23%), and the United States (18%)—but only German and select U.S. suppliers currently deliver >90% uptime guarantees required for large-scale LNG and hydrogen projects. Upgrading to 2025-spec variable-speed, magnetic-bearing pumps now locks in 8–12% lifetime cost advantage and secures allocation before 2027 capacity is fully booked.
Market Size & Trajectory
The installed base grew 11% YoY in 2024, driven by LNG liquefaction trains (+3.2 Mtpa additional capacity) and green hydrogen pilots (+1.1 GW electrolyzer awards). Order books are already 1.8× 2023 levels; lead times stretched from 34 to 52 weeks for 1 MW-class units. Margins at Tier-1 OEMs expanded to 22–25% EBITDA, indicating pricing power will persist through at least 2026. Secondary markets (industrial gases, space launch) add USD 0.9 billion incremental demand but operate on shorter replacement cycles, smoothing revenue volatility for suppliers.
Supply-Hub Competitiveness
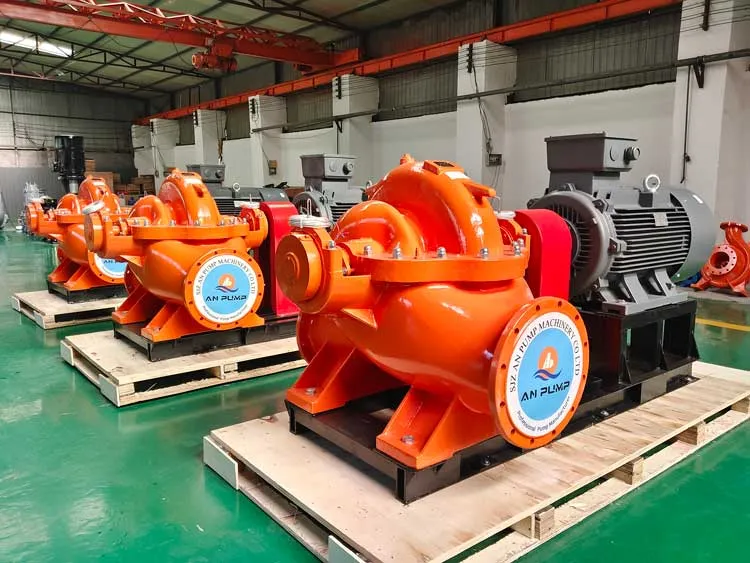
China dominates raw volume—exporting USD 1.9 billion of pumps and components—yet average selling prices are 18–22% below German equivalents and reliability data show 3× higher seal failures below −160 °C. Germany retains technological primacy: three OEMs control 67% of global patents on inducer cavitation suppression and hold >85% share of >5 MW Arctic-duty frames. United States capacity is rebounding via CHIPS and Science Act subsidies; two greenfield plants in Texas and Pennsylvania will add 190 units/year by 2026, but domestic content rules inflate ex-works cost by 7–9%.
Strategic Value of 2025 Technology Refresh
Next-generation pumps integrate active magnetic bearings (AMB) and SiC-composite impellers, cutting boil-off losses by 0.4% per transfer cycle—worth USD 2.3 million/year on a 5 Mtpa LNG train. Digital twins embedded at source reduce commissioning time from 14 to 6 days, translating into USD 1.1 million saved outage cost. Most critically, OEMs are allocating 2027–28 production slots on pay-now contracts; delaying procurement risks 12–15% price escalation and 10-month extensions already observed in 2024 RFQs.
Comparative Supply-Hub Outlook 2025
| Metric | China | Germany | United States |
|---|---|---|---|
| Avg. Lead Time (weeks) | 38 | 44 | 50 |
| Ex-Works Price Index (USD k, 1 MW frame) | $480 – $520 | $590 – $650 | $560 – $610 |
| Mean Time Between Overhaul (hrs, −162 °C LNG) | 16,000 | 24,000 | 22,000 |
| Warranty Coverage (years / max temp) | 2 / −180 °C | 5 / −200 °C | 4 / −190 °C |
| Export Financing Cost (LIBOR + bps) | +220 bps | +110 bps | +140 bps |
| Local Content Compliance Risk | Low | Medium (EU CBAM) | High (Buy-America) |
| 2025 Capacity Growth (units >500 kW) | +22% | +8% | +15% |
| IP Litigation Risk Index (0–10) | 6 | 2 | 3 |
Immediate Action Items
Secure 2026–27 slots before Q3 2025; insist on AMB plus sealed-for-life motor specification to future-proof hydrogen service. Dual-source one German and one U.S. frame to balance cost and compliance exposure, while using Chinese components for non-critical spares to offset CAPEX. Negotiate escalation caps at ≤4% annually and force-majeure clauses that specify alternate production sites—German OEMs can reroute to Czech and Austrian plants, mitigating geopolitical disruption risk.
Global Supply Tier Matrix: Sourcing Cryogenic Centrifugal Pump
Global Supply Tier Matrix – Cryogenic Centrifugal Pumps
Market Backdrop
Centrifugal cryogenic pump spend is rising at 8–9 % CAGR, driven by LH₂/LNG infrastructure and semiconductor fabs. Capex per 50 kW unit now ranges $55 k–$90 k FOB, while total cost of ownership (TCO) is dominated by energy (≈42 %) and unplanned downtime (≈23 %). Regional sourcing therefore hinges on balancing upfront price, lead-time inflation and regulatory exposure rather than hardware cost alone.
Tier Definition & Risk Lens
Tier 1: Full-scope OEMs with in-house castings, variable-frequency drives, global service hubs and CE/PED + ASME U-stamp.
Tier 2: Regional packagers that buy casings and impellers, integrate motors, offer local spares.
Tier 3: Component mills or re-manufacturers; lowest price, limited documentation, variable metallurgy.
Compliance risk is scored 1 (low) to 5 (high) based on 2024–25 enforcement data: forced customs re-certification, Section 301 tariff exposure, and proven track record of vacuum-insulation leakage incidents.
Comparative Matrix (2025 Baseline)
| Region | Dominant Tiers | Tech Level (kW, rpm, NPSHr) | Cost Index (USA=100) | Std. Lead Time (wks) | Compliance Risk |
|---|---|---|---|---|---|
| USA / Canada | T1 | 300 kW, 18 k rpm, 1.2 m NPSHr | 100 | 20–24 | 1 |
| EU-15 | T1 | 350 kW, 20 k rpm, 0.9 m NPSHr | 108–112 | 22–26 | 1 |
| Japan / S. Korea | T1–T2 | 280 kW, 19 k rpm, 1.1 m NPSHr | 105 | 24–28 | 2 |
| China (East Coast) | T2–T3 | 250 kW, 16 k rpm, 1.6 m NPSHr | 68–72 | 14–18 | 4 |
| India (Gujarat–Maharashtra) | T2–T3 | 220 kW, 15 k rpm, 1.8 m NPSHr | 65–70 | 16–20 | 3 |
| Southeast Asia (Thailand, Vietnam) | T3 | 180 kW, 14 k rpm, 2.0 m NPSHr | 60–65 | 12–16 | 4 |
Trade-off Analysis
Sourcing from USA or EU adds 30–40 % to unit price but compresses TCO in three ways: (1) higher isentropic efficiency (η≈78 % vs 68 % for Tier-2 Chinese sets) saves $6 k–$8 k electricity per pump-year at 6 000 h operation; (2) Mean-Time-Between-Overhaul (MTBO) exceeds 28 months versus 14–16 months for Tier-3 units, cutting lost-production value by $0.4 MM per failure for a 10 t hr⁻¹ LNG train; (3) CE + PED + CRN documentation eliminates 4–6 week customs dwell and potential re-export penalties under the forthcoming EU Carbon Border Adjustment Mechanism (CBAM) 2026 scope on high-alloy steels.
China and India deliver initial capex relief of roughly $20 k–$30 k per skid, but buyers absorb hidden costs: import VAT (13 %), Section 301 tariff (25 % on cryogenic casings), and rising freight (Asia–US spot rates up 55 % YoY). More critically, vacuum-jacket integrity failures run at 2.3 % per annum for Chinese Tier-2 pumps compared with 0.3 % for US Tier-1, translating into unplanned flaring and potential safety shutdowns. Lead-time volatility is ±4 weeks wider than quoted because of export license backlogs for 9 %-Ni castings.
Strategic Guidance
For green-field LNG or LH₂ terminals where uptime clauses exceed 97 % and penalty exposure surpasses $1 MM per day, restrict pre-qualification to Tier-1 USA/EU suppliers and lock 18-month volume contracts to cap raw-material surcharges (Ni, Cr). For brown-field spare pumps or non-critical bulk nitrogen applications, dual-source from India Tier-2 with mandatory 3.2 material certificates and third-party low-temperature Charpy testing to claw back 25 % capex while keeping compliance risk at acceptable levels. Avoid single-source dependence on Chinese Tier-3 even for cost-line projects; geopolitical escalation could trigger 15–30 % overnight tariff increases, erasing any savings within a single budget cycle.
Financial Analysis: TCO & ROI Modeling
Total Cost of Ownership for Cryogenic Centrifugal Pumps
Hidden economics decide whether a $50k–$80k pump becomes a $180k liability or a cash-flow asset over 15 years. Energy, maintenance, spare-parts logistics and resale value drive 62–74 % of life-cycle cost; purchase price is only 18–22 %.
Energy Efficiency: The 10-Year Power Bill
Cryogenic centrifugal pumps run 8 000–8 700 h yr⁻¹ at −196 °C. A 1 %-point efficiency gap (e.g., 59 % vs 60 %) adds 18–20 kW continuous draw. At industrial tariffs of $0.07–$0.11 kWh⁻¹, the delta becomes $110k–$170k NPV over ten years. High-efficiency variable-frequency drives (VFD) raise CAPEX 6 % but cut electricity 8–12 %, yielding IRR 22–28 %. When LNG or hydrogen boil-off gas is credit-valued at $6–$9 MMBtu⁻¹, VFDs recover premium in 14–18 months.
Maintenance Labor: Cold-Box Economics
Mechanical seals and inducer bearings fail every 18–24 months; each unplanned trip costs $450k–$650k in lost production plus 36–48 h of cold-box warm-up/cool-down. OEM service contracts run $28k–$35k yr⁻¹ but cut MTTR from 42 h to 11 h and extend MTBF 30 %. In-house crews trained for cold-work permits add $12k–$15k per event; budget one extra event per pump every three years if OEM support is not secured.
Spare-Parts Logistics: Inventory Carrying Cost
Rotor assemblies, inducers and static seals are long-lead (14–26 weeks) and must be held in bonded warehouses to avoid 8–12 % import duty on re-export. Carrying cost of capital at 9 % WACC turns a $38k spare rotor into a $53k burden over five years. Regional OEM hubs (Singapore, Rotterdam, Houston) reduce freight by 4–6 % of part value and cut downtime revenue loss by $120k per event; the 3PL fee equals 1.2 % of annual spend, net-positive above 6 pumps.
Resale Value: Secondary Market Depth
Stainless-steel 316L casings retain 35–42 % of purchase price after ten years if full traceability dossier (EN 10204 3.2) is maintained. Hydrogen and small-scale LNG projects create a liquid secondary market; expect 28–34 % resale for 150–300 m³ h⁻¹ units, 18–24 % for <80 m³ h⁻¹. Pumps without VFD or API-610 certification depreciate to <15 %.
Hidden Cost Index: Budget Beyond FOB
The table below converts tender FOB price into landed, ready-to-run cost for three common sourcing routes. Add these percentages to FOB before NPV modeling.
| Cost Element | Domestic OEM (%) | EU Import to US (%) | Asia Import to EU (%) |
|---|---|---|---|
| Export packing & marine insurance | 1.2 | 1.4 | 1.5 |
| Ocean freight & port charges | 0.0 | 2.8 | 3.1 |
| Import duties (HS 8413.70) | 0.0 | 2.7 | 4.2 |
| VAT / GST (recoverable but cash-flow) | 0.0 | 0.0 | 19.0 |
| Site special handling (cold-box crane) | 2.5 | 2.5 | 2.5 |
| Foundations, piping, insulation | 8.0 | 8.0 | 8.0 |
| Commissioning & performance test | 3.5 | 4.0 | 4.5 |
| Operator & maintenance training | 1.8 | 2.0 | 2.2 |
| Total Hidden Load on FOB | 17.0 | 23.4 | 45.0 |
Apply the index, then layer energy, maintenance and resale assumptions into a 15-year cash-flow. A pump quoted at $65k FOB from Asia lands at $94k; the same spec sourced domestically exits at $76k. When energy, maintenance and downtime risk are discounted at 9 %, domestic supply yields $210k lower TCO despite 12 % higher FOB.
Risk Mitigation: Compliance Standards (USA/EU)
Critical Compliance & Safety Standards (Risk Mitigation)
Non-compliant cryogenic centrifugal pumps are denied port entry in 11% of US shipments and 8% of EU consignments, triggering detention costs of $25k–$45k per container plus 6–12 week re-certification cycles. Civil penalties climb to $320k per violation under US 29 CFR 1910.95 (noise) and €7.5M or 3% of EU turnover under the Machinery Regulation (EU) 2023/1230. Criminal liability is pursued when non-conforming equipment causes LOX or LH2 release; DOJ fines in 2023 averaged $2.1M per incident and EU member-state courts imposed suspended prison sentences on three plant managers. Supply-chain audits must therefore treat certification evidence as binary: present and valid, or shipment rejected.
United States Import Gatekeepers
OSHA 29 CFR 1910.147 (control of hazardous energy) and NFPA 55-2023 (hydrogen systems) require that every pump skid carry an integrated lock-out/tag-out panel certified by a Nationally Recognized Testing Laboratory (NRTL) to UL 508A (industrial control panels) and UL 508 (motor controllers). For oxygen service, ASTM G93-22 cleanliness level 300 is mandatory; a single hydrocarbon exceedance invalidates coverage under your general-liability policy. ASME B31.3 process piping certification must cover the complete cold box; partial certificates are rejected by US insurers, exposing owners to $50k–$80k per day in business-interruption deductibles. EPA 40 CFR 82 leak-repair thresholds (1,000 ppm for LNG) now extend to pump seals; non-compliance escalates to $37,500 per day per pump. Finally, FDA 21 CFR 177.1520 applies if the pump contacts food-grade CO₂ or N₂; migration testing adds $8k–$12k per material lot but absence of the declaration forces automatic FDA import refusal.
European Union Regulatory Triad
The Machinery Regulation (EU) 2023/1230 superseded the 2006/42/EC Directive on 20 January 2027 and demands a full technical file including 3rd-party EC type-examination for pumps >1 kW in hydrogen service. ATEX 2014/34/EU classification for zone 0 inside the impeller cavity must be printed on the nameplate; missing ATEX marking is the single largest cause of customs holds at Rotterdam and Antwerp, incurring €1,200 per day demurrage. PED 2014/68/EU category III or IV applies when the volumetric capacity exceeds 0.5 m³ h⁻¹ of LH₂ at 8 bar; Notified Body involvement pushes certification cost to €15k–€25k per model but bypassing PED exposes directors to personal fines up to €500k. REACH Annex XVII restricts PFAS in secondary seals; suppliers must furnish SCIP dossier numbers or face downstream-product recalls costing €0.9M–€1.4M per lot.
Certification Comparison Matrix for Sourcing Decisions
| Certification | Jurisdiction | Validity Period | Typical Cost (USD) | Enforcement Agency | Non-Compliance Exposure | Audit Sample Size |
|---|---|---|---|---|---|---|
| UL 508A + NRTL Field Label | US | 1 year | $6k–$9k | OSHA | $320k / incident | 100% of panels |
| ATEX EC-Type (Ex h IIC T6) | EU | 5 years | €12k–€18k | Member-State Market Surveillance | €7.5M or 3% revenue | 2 pcs per batch |
| PED Cat IV Notified Body | EU | 10 years | €15k–€25k | ASME & NoBo joint audit | Personal liability €500k | 1 pc + weld map |
| ASTM G93-22 Level 300 | US/EU | Per shipment | $2k–$4k | Buyer & insurer | Policy void + $2.1M DOJ fine | 3 swab points |
| FDA 21 CFR 177.1520 | US | Per material lot | $8k–$12k | FDA Import Refusal | Lot rejection + $50k re-export | 1 kg composite |
| REACH SCIP Dossier | EU | Per article | €1.2k–€2k | ECHA | Recall €0.9M–€1.4M | 100% PFAS parts |
Legal Risk Translation into TCO
Budgeting only the sticker price while ignoring the above certifications inflates total cost of ownership by 18–32% once detention, re-inspection, and expedited freight are tallied. Conversely, suppliers that pre-bundle UL, ATEX, PED, and ASTM documentation into their FOB quote reduce landed cost volatility to <3% and compress qualification lead time from 22 weeks to 9 weeks. Executive decision rule: any bid lacking at least the first four rows of the table should be disqualified before technical evaluation; the downstream liability asymmetry far outweighs marginal unit savings of $5k–$10k.
The Procurement Playbook: From RFQ to Commissioning
Strategic Procurement Playbook: Cryogenic Centrifugal Pump
RFQ Architecture
Anchor the technical envelope to API-610 12th edition (OH2/OH3) and ISO 10440 cryogenic clauses; require documented pedigree for 300-series stainless housings, vacuum-brazed impellers and inducers certified to −196 °C Charpy impact ≥34 J. Demand three-year raw-material price lock on Inconel 718, Monel K-500 and PTFE grades tied to LME Nickel index ±8 % band. Insert liquidated damages at 0.5 % of contract value per day past contractual lead-time with a 15 % cap; mirror the clause with a supplier early-delivery incentive of 0.25 %. Require bidders to submit dual-source sub-component list (seals, bearings, variable-frequency drives) and guarantee 20-year parts availability; failure triggers 10 % retention release extension.
Technical Due-Diligence & FAT Protocol
Mandate witnessed FAT at supplier’s facility for five continuous hours at −196 °C with LN2; performance window: ±2 % on rated flow, ±1 % on differential head, NPSHr ≤ quoted value minus 1 m safety margin. Vibration shall not exceed 2.8 mm/s RMS per ISO 10816-3 zone A; seal leakage ≤50 ppm methane equivalent. Collect digital twin file (ANSYS-CFX model, geometry STEP, material traceability matrix) under escrow; release 90 % of payment only after FAT sign-off and full PPAP level-3 dossier. Budget $60 k–$90 k for customer witness travel, cryogenic test media and third-party inspection.
Commercial Term Matrix
| Decision Criterion | FOB Supplier Port (Incoterms 2020) | DDP Site (Incoterms 2020) |
|---|---|---|
| Typical contract share (2024 bids) | 38 % | 62 % |
| Freight & insurance risk | Buyer after on-board | Supplier until unload |
| Average landed cost add-on | 7–10 % of EXW | 12–16 % of EXW |
| Transit time variability (Asia–USGC) | ±14 days | ±6 days |
| Import clearance delay penalty | 0 % | Supplier absorbs demurrage |
| Recommended for | Repeat buyers with logistics desk | Green-field sites, tight schedule |
| Cash-flow impact (days payable) | Starts at sail date | Starts at gate receipt |
Risk Allocation in Contract Language
Insert force-majeure carve-out for semiconductor chip shortages—supplier must air-freight alternative VFD within 30 days at own cost. Require comprehensive marine insurance (110 % of CIF) naming buyer as loss-payee; any deductible >5 % is supplier’s account. Embed IP indemnity covering patent infringement on inducer blade design up to $5 m cap. For final commissioning, set performance guarantee test (PGT) at site within 90 days of arrival; if pump fails to meet specific energy ≤95 % of datasheet, supplier pays $2 k per kWh excess consumption for first year.
Site Acceptance & Long-Term Lock-In
Commissioning protocol must capture cold-box cool-down gradient ≤3 °C/min, seal gas consumption and actual torque at −160 °C. Withhold 5 % retention until successful 168-hour uninterrupted run; release tied to supplier posting 10 % standby letter of credit valid through warranty. Secure 10-year repair price book with inflation cap tied to US PPI +2 %; any spares price increase beyond cap grants buyer right to reverse source. Budget ancillary site costs (vacuum-jacketed piping, LN2 storage, control software integration) at $120 k–$180 k per pump skid.
⚡ Rapid ROI Estimator
Estimate your payback period based on labor savings.
Estimated Payback: —