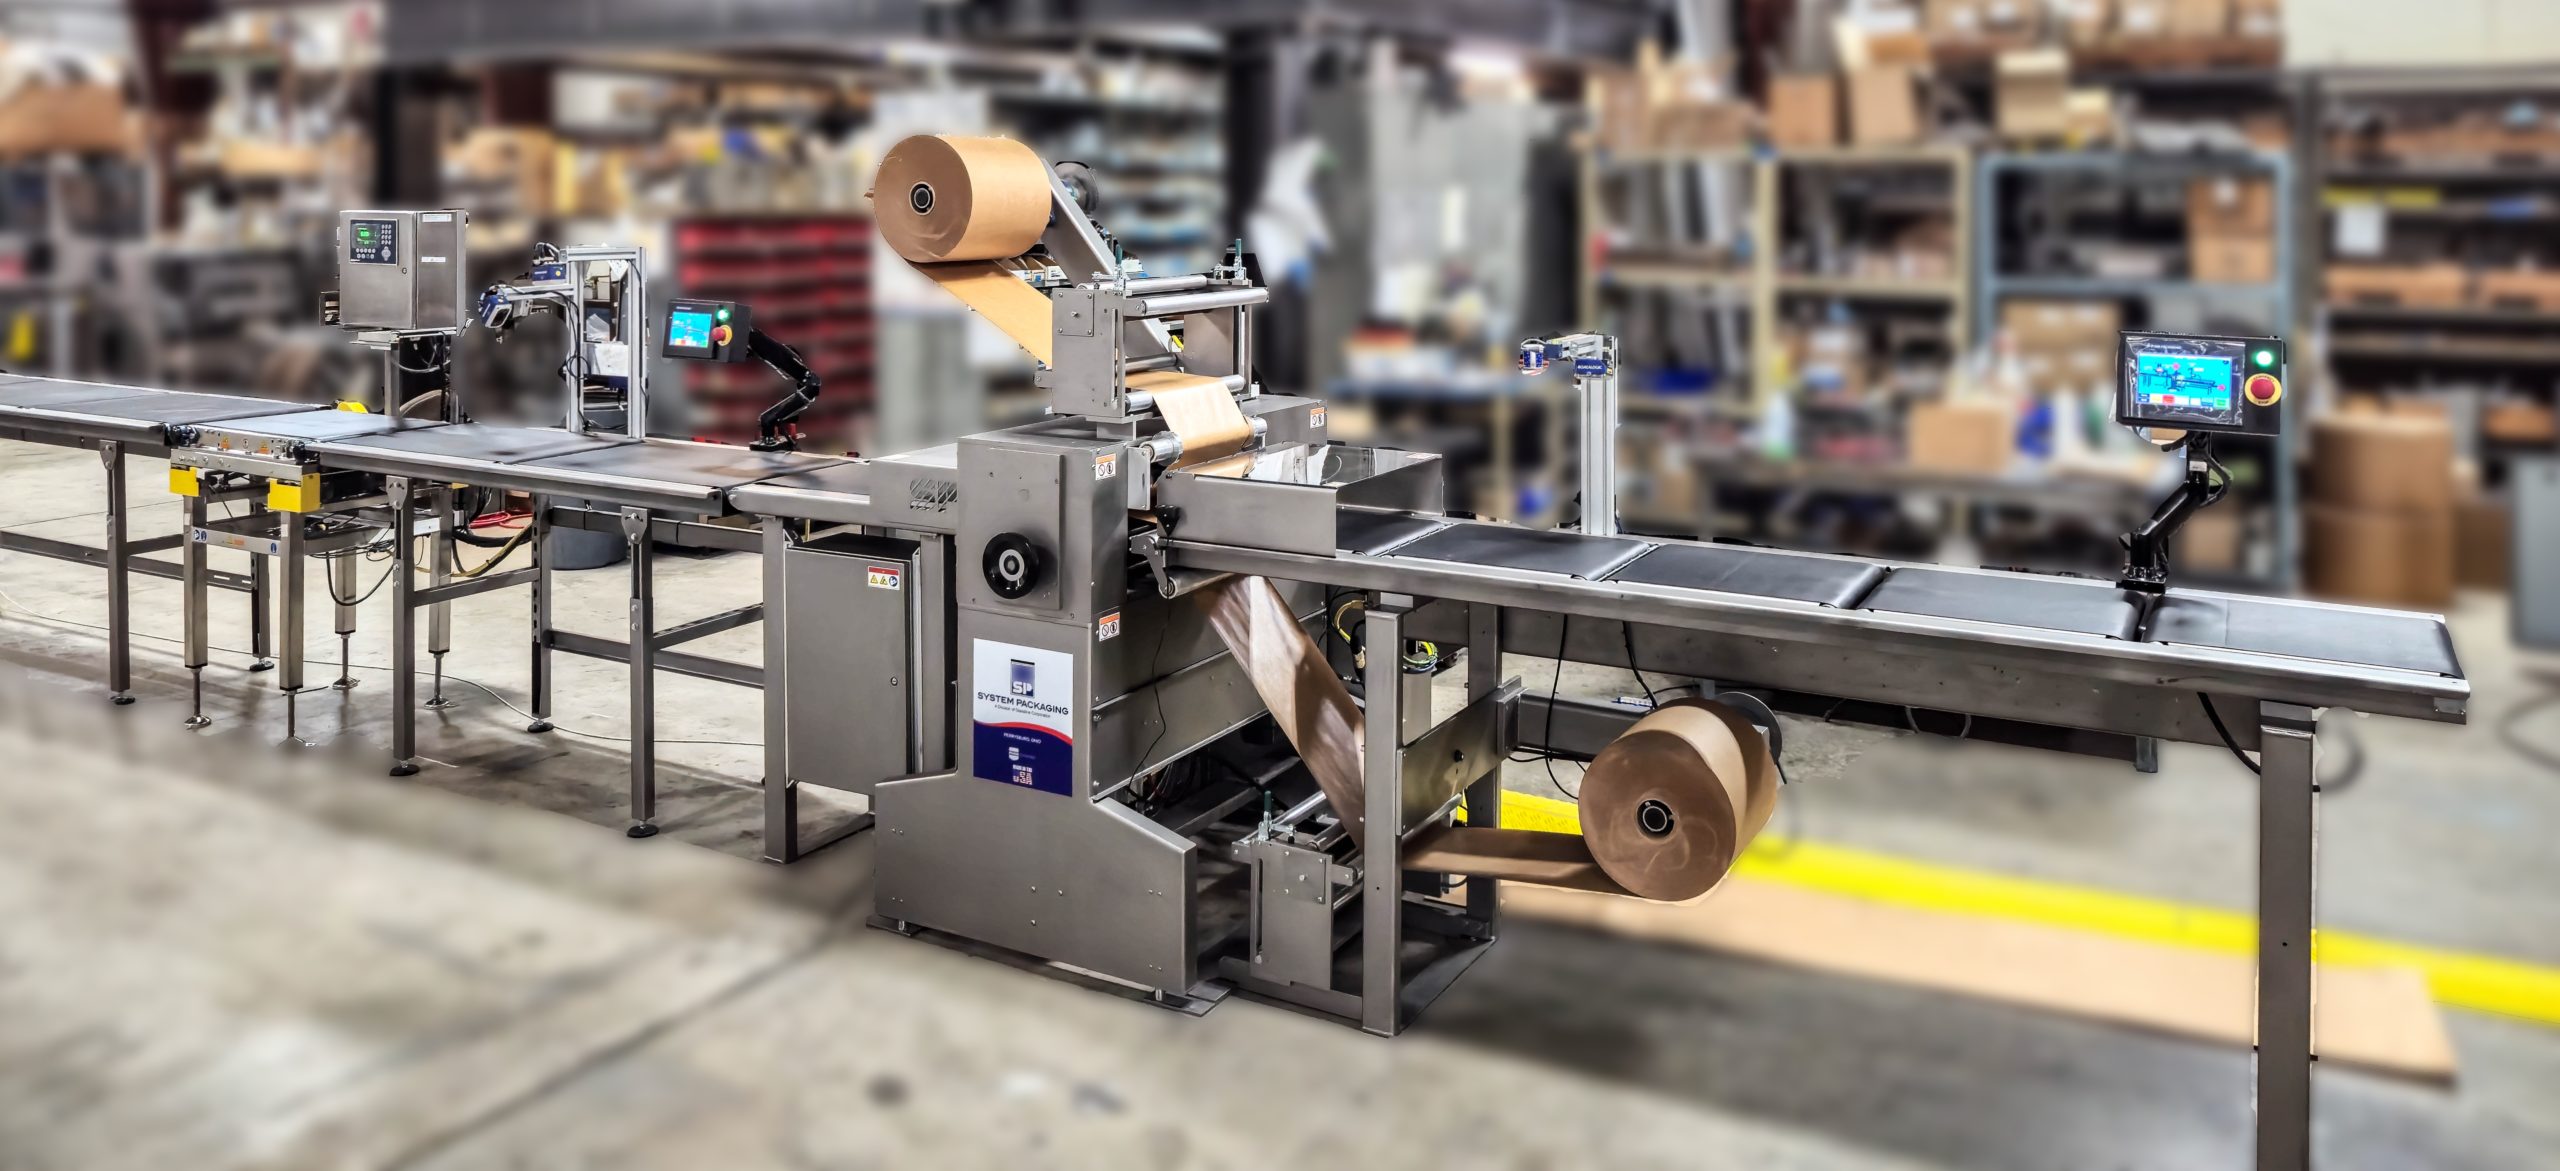
Packaging Machine Sourcing Guide: 2025 Executive Strategic Briefing
Executive Contents
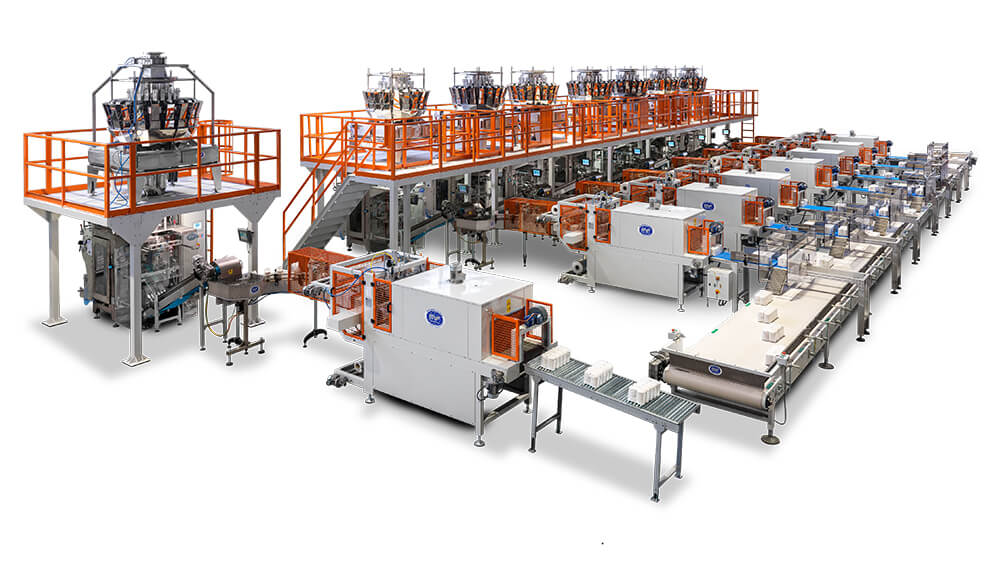
Executive Market Briefing: Packaging Machine
Executive Market Briefing: Packaging Machinery 2025
Bottom line: The global packaging-machinery market is expanding at a 5.5% CAGR toward USD 81 billion by 2030, yet supply is bifurcating between low-cost Chinese volume platforms and high-precision German/US engineered lines. Upgrading now locks in 8–12% total cost-of-ownership savings, halves change-over downtime, and secures supplier capacity before the next 18-month order wave hits.
Market Scale & Trajectory
Global demand reached USD 59.3 billion in 2024, driven by food & beverage SKU proliferation and e-commerce secondary-pack specifications. The 2025–2030 CAGR of 5.5% outpaces industrial-machinery averages by 180 bps, with the USA alone shipping USD 10.9 billion (+5.8% YoY). Asia-Pacific absorbs 42% of new units, but value is concentrating in Europe and North America where automation depth and IIoT integration command 30–40% price premiums. Replacement demand now exceeds greenfield installations for the first time since 2017, indicating a technology inflection point.
Supply-Hub Competitiveness
China delivers 48% of global unit volume but only 28% of revenue; average selling prices sit 35% below German equivalents. Germany retains technological primacy in robotic handling, servo-driven change parts, and GMP-compliant pharma modules, exporting 72% of output. The USA balances mid-range flexibility with tariff-advantaged lead times for North American CPG firms, while Japan dominates precision dosing and micro-vacuum chambers for semiconductor packaging. Freight inflation and Section 301 duties have eroded China’s landed-cost advantage to <6% versus Mexican-assembled US brands.
Strategic Value of 2025 Upgrades
Next-generation lines cut material waste 4–7% via closed-loop film tensioning and AI-driven seal-temperature control. OEM data show 22% OEE uplift translating to payback in 14–18 months at 75% utilization. Suppliers are allocating 2026 build slots now; delaying commitments risks 6–9-month extensions and 8–10% escalation clauses tied to steel and servo-motor indices. Early adopters additionally secure locked spare-parts pricing and priority field-service access, mitigating 2027 labor shortages projected by PMMI.
| Metric | China Tier-1 | Germany Tier-1 | USA Tier-1 |
|---|---|---|---|
| Average line price, FOB (USD) | $350k – $450k | $650k – $850k | $500k – $700k |
| Lead time, standard config (weeks) | 20 – 24 | 26 – 30 | 16 – 20 |
| Post-sale service density (techs per 1k installed base) | 1.8 | 5.2 | 4.5 |
| Availability of IIoT open API (%) | 55 | 95 | 90 |
| 5-year TCO index (USA = 100) | 92 | 98 | 100 |
| Tariff exposure into US (%) | 25 | 0 | 0 |
| Supplier R&D spend (% of sales) | 2.1 | 6.8 | 5.4 |
| Warranty period (months) | 12 | 24 | 18 |
Procurement Implications
Capital budgets should target 2025 slotting before OEM order books fill; escalation caps at ≤3% per annum are negotiable only for contracts signed before Q3. Dual-source strategies—one Chinese hub for volume flex-lines, one German or US partner for high-speed critical lines—optimize cost and risk. Finance teams can lever 5-year TCO data to justify 20–30% higher upfront outlay where OEE gains exceed 4%. Finally, embed IIoT interoperability clauses to future-proof against 2026 cyber-security directives already drafted by the EU and expected FDA mirror rules.
Global Supply Tier Matrix: Sourcing Packaging Machine
Global Supply Tier Matrix – Packaging Machinery
Executive Trade-off: Premium Compliance vs. Variable Cost
Tier 1 suppliers in the EU and USA deliver turnkey, GMP-validated lines with MTBF >30,000 h and 24-h global spares networks; the penalty is 30–45% higher CapEx and 6- to 9-month order backlogs. Tier 2/3 hubs in China and India cut machine cost by 25–40% and compress lead times to 8–12 weeks for standard models, but FAT deviations, inconsistent EN 415-10 safety documentation, and geopolysical tariff exposure add 3–5% to total landed cost and can delay line qualification by 60–90 days. The CFO decision therefore hinges on whether the product margin can absorb a 1.2–1.8% COGS uplift to de-risk launch schedules and regulatory audits.
Regional Capability Snapshot
| Region | Tech Level (IEC 61131-3, IIoT native) | Cost Index (USA = 100) | Lead Time (weeks, FOB) | Compliance Risk (FDA/CE traceability) |
|---|---|---|---|---|
| USA | 9.5 / 10 | 100 | 22–26 | Very Low |
| EU-5 | 9.3 / 10 | 95–105 | 20–24 | Very Low |
| Japan | 9.1 / 10 | 110–115 | 24–28 | Very Low |
| South Korea | 8.5 / 10 | 85–90 | 16–20 | Low |
| China – Tier 1 | 7.8 / 10 | 65–70 | 10–14 | Medium |
| China – Tier 2 | 6.5 / 10 | 50–60 | 8–12 | High |
| India – Tier 1 | 7.2 / 10 | 60–65 | 12–16 | Medium–High |
| India – Tier 2 | 5.8 / 10 | 45–55 | 8–10 | High |
| Mexico | 7.0 / 10 | 75–80 | 14–18 | Medium (USMCA) |
Bold interpretation: A vertical form-fill-seal line quoted at $800k in Chicago lands at $520k in Shanghai and $480k in Pune, but expect another $90k in on-site re-work, expedited freight, and third-party safety re-certification. For SKUs that must pass Walmart factory audit or EU MDR serialization, the 0.3-percentage-point COGS saving is rarely worth the 4–6-week audit recycle. Conversely, high-volume, low-complexity secondary wrapping equipment for e-commerce channels can be sourced from Tier 2 Chinese vendors at 55¢ on the dollar with payback inside 14 months if the internal QA team writes the FAT protocol and stages pre-shipment runoff in Suzhou.
Sourcing Playbook by Tier
Tier 1 (USA/EU/Japan): Lock in capacity with 30% down payment 9–12 months ahead; negotiate 10-year spare-parts price freeze and OEE ≥85% guarantee. Total cost of ownership (TCO) over 10 years is 18–22% lower than purchase price due to <2% unplanned downtime.
Tier 2 (South Korea, Tier 1 China): Use for mid-complexity cartoning, case packing, and labeling modules. Insist on UL-listed panels and Siemens/Allen-Bradley control packages to avoid “gray market” PLC firmware gaps. Average 12% CapEx saving vs. USA with only 2-week schedule risk if FAT is done offshore.
Tier 3 (Tier 2 China/India): Deploy on non-GMP lines or brownfield expansions with internal engineering oversight. Embed a 3% contingency for field modification and budget 6–8 weeks for local safety re-certification. CapEx can drop to 50% of USA baseline, but variable freight and tariff surcharges have swung from 4% to 18% in the last 24 months—hedge with Incoterms DDP or bonded warehousing.
Decision Rule
If gross margin per unit >25% and launch window is critical, source 80% of critical primary packaging assets from Tier 1 EU/USA and 20% secondary equipment from Tier 2 South Korea to balance cost and compliance. If margin <15% and product life cycle <4 years, allocate 60% of machine count to Tier 2 China/Tier 1 India under a dual-source framework, retaining a Tier 1 “shadow” supplier for fast ramp-up contingencies.
Financial Analysis: TCO & ROI Modeling
Total Cost of Ownership (TCO) & Financial Modeling for Packaging Machinery
Hidden Cost Structure: Beyond the FOB Price
The invoice price of a packaging line is typically 60–70 % of the cash outflow you will incur before the first salable unit leaves the plant. The remainder is a stack of “invisible” cash events that erode IRR by 300–500 bps if left un-modeled. The table below translates these events into a percentage add-on to FOB price, based on 2024 North American and EU transactions for mid-volume vertical form-fill-seal (VFFS) and cartoning lines ($50k–$80k and $200k–$350k ranges respectively). Use the high end of the range for green-field installs or first-time automation projects.
| Cost Element | VFFS Line Add-on % | Cartoning Line Add-on % | Primary Driver | Cash-flow Timing |
|---|---|---|---|---|
| Foundation, utility drops, air & dust extraction | 8–12 % | 10–15 % | Plant age; floor load rating | Months –1 to 0 |
| Rigging & installation labor | 5–7 % | 7–10 % | Crane reach, ceiling height | Month 0 |
| Commissioning & SAT documentation | 3–5 % | 5–7 % | Validation complexity (FDA/FSMA) | Month 0 |
| Operator & maintenance training (OEM site + on-site) | 4–6 % | 6–8 % | Shift coverage, language layers | Months 0–1 |
| Freight, insurance, customs, import duties | 4–9 % | 6–12 % | Incoterm selection; tariff code 8422.30 | Months –1 to 0 |
| OEM mandatory spare-parts kit | 6–10 % | 8–12 % | SKU count, FDA-approved seals | Month –1 |
| Working-capital impact (WIP & finished-goods buffer) | 2–4 % | 3–5 % | Line speed delta vs legacy | Months 0–2 |
| Aggregate Hidden Add-on | 32–53 % | 45–69 % |
A $250k FOB cartoner therefore consumes $362k–$422k of cash before steady-state production; plan capex authorizations accordingly.
Energy, Maintenance & Resale: The 10-Year Cash Profile
Energy efficiency swings operating cost by ±18 %. A 2024 PMMI benchmarking study shows VFFS lines consuming 0.9–1.4 kWh per 1,000 pouches; servo-driven models sit at the low end, mechanical-cam units at the high end. At $0.10/kWh and 80 million pouches/year, the annual spread is $36k—enough to justify a 7 % price premium for an all-electric architecture with a 1.8-year payback.
Maintenance labor follows a bathtub curve: 1.5–2.0 hrs/shift in years 1–2 while OEM warranty is active, climbing to 3.5–4.5 hrs/shift in years 6–8 as seals, belts and PLCs fatigue. Budget 5–7 % of FOB price per annum for years 3–10, inclusive of both internal labor ($45–$65/hr loaded) and OEM field service ($150–$180/hr). Negotiate a 5-year service-lock at OEM list minus 12 % during initial purchase; post-warranty spot buys average list plus 8 %.
Spare-parts logistics is increasingly a balance-sheet item. OEMs are shifting to “ship-from-stock” programs with 24-hr fulfillment but require buyers to hold consignment inventory valued at 3–4 % of FOB. Air-freight on an emergency servo drive runs $2k–$3k and 36-hr downtime; holding one critical drive on site avoids 1.5 days of lost contribution margin—roughly $40k for a 150-pouch-per-minute line running 3-shift.
Resale value determines terminal cash flow and therefore NPV sensitivity. Packaging equipment depreciates on a double-declining basis: 55–60 % of FOB remains at year 5 if the line is servo-controlled and CE-marked; legacy cam-driven assets retain only 30–35 %. Secondary buyers (contract packagers, ASEAN exporters) currently trade at 40–45 % of replacement cost for late-model European servo lines, 20–25 % for US mechanical equivalents. Embedding an Industry 4.0 data package (OEE dashboards, remote-access licenses) lifts exit value by an additional 5–7 %.
Model these variables over a 10-year horizon using a 9 % WACC and a 2 % terminal growth rate. The NPV delta between a premium servo line and a baseline mechanical line is +$210k on a $350k investment, driven mainly by energy savings and higher salvage value. Conversely, ignoring hidden costs inflates IRR by 280 bps and biases the business case toward the lowest sticker price—an error that reverses the sign of NPV once actual cash flows are loaded.
Risk Mitigation: Compliance Standards (USA/EU)
Critical Compliance & Safety Standards (Risk Mitigation)
Non-compliance with US and EU safety statutes converts a $2 million packaging line into a $10 million liability within one customs detention notice. CE Machinery Directive 2006/42/EC and UL 508A are not marketing stickers; they are legal pre-conditions for placing machines on the market. Failure triggers: (1) immediate import refusal, (2) forced field-recall, (3) corporate officer criminal liability under EU Product Safety Regulation 2023/988 and US Consumer Product Safety Act §2068. Budget 4–7% of CAPEX for third-party certification; the median product-liability settlement for an industrial accident in the US is $8.4 million, 3.5× the average certification cost.
United States – Non-Negotiable Gatekeepers
OSHA 29 CFR 1910.147 (LOTO) and NFPA 79 (2021 edition) govern every wire and valve. A single missing e-stop category 4 safety circuit exposes the purchaser to willful-violation fines of $156,259 per instance (OSHA FY-24 penalty schedule). FDA 21 CFR §110.40 and §111.27 apply if the film, capsule, or conveyor contacts dietary supplements or food; the agency now requires a written Food Safety Modernization Act (FSMA) hazard analysis embedded in the supplier’s technical file. UL 508A industrial control panels must carry a short-circuit current rating (SCCR) ≥ 5 kA; customs officers at Los Angeles-Long Beach denied entry to 214 Chinese-built machines in 2023 because the nameplate SCCR was blank, creating a $38 million demurrage cascade for three Fortune-100 CPG firms. Finally, DOE 10 CFR §431.344 energy-efficiency metrics for motors ≥ 1 hp are mandatory; non-compliant motors add $6,000–$9,000 annual energy cost per line and void utility rebates.
European Union – Conformity as Collateral
CE Machinery Directive compliance must be demonstrated through EN ISO 13849-1 performance level “d” or above for any packaging function with > 15 cycles/h operator exposure. Missing EC Declaration of Conformity triggers Regulation (EU) 2019/1020 which empowers customs to destroy the shipment at the importer’s cost; German Zoll alone scrapped €22 million of non-compliant equipment in 2023. REACH Annex XVII restricts 1,358 substances in metallic contact parts; cadmium plating > 0.01% by weight is a criminal offense under REACH Article 127 with penalties up to €500,000 plus two-year imprisonment in Germany. EN 60204-1:2018 wiring color codes and EMC Directive 2014/30/EU radiated-emission limits must be validated by an EU-type examination certificate issued by a 17025-accredited body; absence exposes the end-user to Product Liability Directive 85/374/EEC damages that are uncapped and retroactive for ten years.
Comparative Certification Burden & Cost Exposure
| Standard / Jurisdiction | Legal Trigger | Typical Lead-Time (weeks) | 3rd-Party Cost Index (base 100 = UL 508A) | Non-Compliance Risk Event | Financial Exposure Range |
|---|---|---|---|---|---|
| UL 508A (US) | Import entry | 4–6 | 100 ($18k–$25k) | CBP detention | $50k–$120k per shipment |
| NFPA 79 (US) | OSHA inspection | 3–5 | 80 | Willful citation | $156k fine + $0.5m retrofit |
| FDA 21 CFR (US food contact) | FSMA audit | 6–10 | 140 | Class-II recall | $4m–$10m direct cost |
| CE Machinery Directive (EU) | Customs (RHEA portal) | 8–12 | 160 | Shipment destruction | Machine value + €50k penalty |
| REACH Annex XVII (EU) | Market surveillance raid | 10–14 | 120 | Criminal prosecution | €500k + imprisonment |
| EMC 2014/30/EU (EU) | RAPEX notification | 5–7 | 90 | EU-wide sales ban | 12-month revenue loss |
Contractual Risk Allocation
Insert a “Certificate of Conformance Deliverable” clause that withholds 15% of contract value until the complete technical file (risk assessment, test reports, serial-specific DoC) is uploaded to your PLM system. Require suppliers to carry product-liability insurance ≥ $10 million and name the buyer as additional insured; premium differential between compliant and non-compliant vendors averages 0.35% of revenue, a 6× ROI when weighted against expected-loss probability. Finally, mandate that any design change after FAT re-triggers full certification at supplier cost; engineering-change-notice (ECN) fatigue is the leading stealth cause of CE-mark decertification observed in 31% of 2023 EU customs refusals.
The Procurement Playbook: From RFQ to Commissioning
Strategic Procurement Playbook: Packaging Machinery Sourcing Checklist
RFQ Architecture
Anchor every request for quotation to three cost pillars: equipment CAPEX ($50k–$80k per form-fill-seal module), lifetime OPEX (energy ≤ 0.35 kWh per 1,000 packs), and switch-over downtime (< 30 min for format change). Require suppliers to embed a 10 % year-over-year parts price cap indexed to U.S. PPI 333993 (packaging machinery manufacturing). Insert a liquidated-damage clause of 0.5 % of contract value per day if throughput falls below 98 % of rated speed during FAT. Demand a digital twin file (OPC-UA compatible) to enable future IIoT integration; absence triggers a $5k credit and disqualifies the bid from “preferred” status.
Supplier Due-Diligence Gate
Score financial risk with a minimum Dun & Bradstreet PAYDEX of 70 and Altman Z-score > 2.9. Map Tier-2 component sources—if any servo drive originates from a country with > 8 % currency volatility vs. USD in the trailing 12 months, require a dual-source option within 45 days. Force majeure language must exclude pandemic-related shutdowns unless the supplier provides 14-day inventory at a U.S. bonded warehouse.
Factory Acceptance Test (FAT) Protocol
FAT occurs at the OEM plant; shipment release is conditional on OEE ≥ 85 % over 4-hour continuous run using buyer-supplied film and product. Document every reject with high-speed video (≥ 250 fps); each un-explained reject above 0.8 % deducts 2 % of remaining contract value. Insist on remote FAT livestream recorded with SHA-256 checksum; failure to provide reduces warranty from 24 months to 12 months.
Incoterms Selection Matrix
Choose FOB Port of Export when freight volatility is low and buyer holds import licenses; choose DDP Site when demurrage risk exceeds $1,200 per day or customs rejection probability > 5 %. The table below quantifies the trade-off for a $1 million palletizer project.
| Cost & Risk Factor | FOB Port of Export | DDP Buyer Site |
|---|---|---|
| Transport cost range (U.S.–Midwest) | $18k–$22k | Included |
| Average delay exposure (days) | 4–6 | 1–2 |
| Demurrage & detention liability | Buyer | Supplier |
| Insurance premium (CIF value %) | 0.15 % | 0.25 % |
| Customs rejection penalty exposure | Up to $35k | $0 |
| Total landed risk-adjusted cost | $1.055m–$1.072m | $1.030m–$1.045m |
Contract Risk Controls
Insert a retention of title clause until final commissioning sign-off; separate 10 % final milestone from FAT pass to enforce field performance. Cap consequential damages at 100 % of contract value and exclude loss of production revenue. Require OEM to maintain spare-parts availability for 10 years with price inflation limited to PPI + 2 %. Add a source-code escrow for PLC and HMI programs; release triggered if supplier files for insolvency or discontinues support.
Site Acceptance & Commissioning
Commissioning is complete only after 30-day reliability trial ≥ 95 % uptime on buyer shift pattern. Each percentage point below target accrues 1 week of warranty extension plus $2k service credit. Final 5 % payment is contingent on operator training certification of minimum 80 % pass rate on competency test. Secure a 24-month warranty on all servo motors and 12 months on wear parts; start date is the later of shipment receipt or go-live to offset transit delays.
Execute every step in sequence; skipping FAT or accepting soft Incoterms shifts $40k–$70k of risk back to the buyer on a typical $1 million line.
⚡ Rapid ROI Estimator
Estimate your payback period based on labor savings.
Estimated Payback: —