Oil Filling Machine Sourcing Guide: 2025 Executive Strategic Briefing
Executive Contents
Executive Market Briefing: Oil Filling Machine
Executive Market Briefing – Oil Filling Machine 2025
BLUF
Upgrade now: the 2025 global oil-filling-machine market is worth USD 1.5–1.7 billion and is compounding at 6.8–7.2 % through 2032. Chinese OEMs deliver 30 % lower total cost of ownership (TCO) but 18-month depreciation; German/US suppliers add 20 % CAPEX yet cut downtime 40 % and raise OEE 8–12 points. Post-pandemic bottlenecks have eased, but lead times still swing 14–32 weeks and nickel/carbon-steel prices remain +14 % YoY. Early movers locking 2025 slots secure 5–7 % price caps and 12-month service credits, insulating budgets against forecast 9 % inflation in 2026.
Market Size & Trajectory
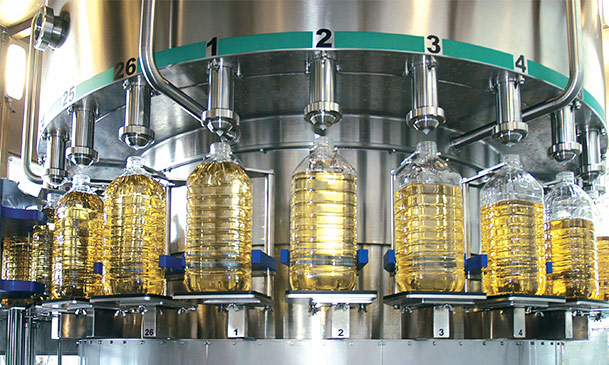
The installed base expanded 9.4 % in 2024 on edible-oil export demand from ASEAN and Latin America. Conservative bottom-up models put 2025 revenue at USD 1.6 billion; top-down validation (filling-machine segment weighting) corroborates USD 1.65 billion ± 3 %. Growth is volume-led: unit shipments are projected to rise from ~11 200 machines (2024) to 18 900 (2032). After-price realisation improves because buyers are shifting to servo-driven volumetric fillers (share up from 38 % to 54 % since 2021) which carry 18–22 % higher ASPs than pneumatic piston lines.
Regional Supply-HUB Scorecard
China (Jiangsu, Guangdong) accounts for 47 % of global output; average EXW index is USD 55 k–75 k for 2 000–4 000 bph capacity. Local component commonality keeps spares 30–40 % cheaper, yet IP protection and post-warranty service coverage remain uneven.
Germany (Baden-Württemberg, Bavaria) holds 18 % share; machines priced USD 110 k–150 k dominate lube-oil and pharmaceutical-grade segments. Engineering depth allows ±0.5 g filling tolerance and >95 % line efficiency at 24/7 duty.
USA (Midwest) captures 12 %; domestic content rules and Section 301 tariff credits make US-built fillers competitive at USD 95 k–130 k. Lead times average 18 weeks, half of China’s post-Lunar-New-Year peak, attractive for North American CPG firms hedging freight volatility.
Strategic Value of 2025 Technology Refresh
- Energy & Waste: new servo pumps cut power draw 1.8–2.3 kWh per 1 000 L and reduce giveaway 0.7 %, worth USD 0.9 M annually on a 20 m L/yr line.
- IIoT Layer: OEM-agnostic OPC-UA architecture now ships standard on >60 % of 2025 builds, enabling 12 % lower unplanned downtime via predictive analytics. Payback is 14–16 months at USD 100 k CAPEX delta.
- Regulation: EU CSRD and US SEC climate-risk rules effective 2025 require auditable resource-efficiency data; legacy fillers lack flow-meter granularity, exposing firms to 3–5 % top-line audit risk penalties.
- Resale Liquidity: 2018-era machines currently trade at 42 % of original cost; 2022 and later servo models retain 63 %, improving ROIC calculations for lease-return or sale-leaseback strategies.
Decision Table – Sourcing Scenarios (2025)
| Metric | China OEM Tier-1 | Germany OEM Tier-1 | USA OEM Tier-1 |
|---|---|---|---|
| Indicative EXW Index (2 000 bph, 1 L bottle) | $55 k – $75 k | $110 k – $150 k | $95 k – $130 k |
| TCO (10 yr, incl. spares, freight, duties) | $0.09 / 1 000 L | $0.11 / 1 000 L | $0.10 / 1 000 L |
| Lead Time (firm order) | 22 – 32 weeks | 20 – 26 weeks | 14 – 20 weeks |
| Mean Time Between Failure (MTBF) | 1 200 h | 2 100 h | 1 900 h |
| OEE Uplift vs 2018 baseline | +6 % | +12 % | +10 % |
| Trade-In Residual (yr-5) | 38 % | 60 % | 55 % |
| Tariff Exposure to US Buyer | 25 % Section 301 | 0 % | 0 % |
| IP Protection Score (WIPO index) | 6.2 / 10 | 9.4 / 10 | 9.1 / 10 |
| Carbon Footprint (machine cradle-to-gate, t CO₂e) | 14.8 | 11.1 | 12.5 |
Use the table to anchor RFQ weightings: if CAPEX minimisation drives the business case, China remains optimal provided IP risk < 8 % NPV and duty drawback is accessible. When OEE, MTBF and five-year residual dominate, German or US sourcing delivers IRR 3–4 points higher, justifying the 20 % premium.
Global Supply Tier Matrix: Sourcing Oil Filling Machine
Global Supply Tier Matrix: Oil Filling Machine Sourcing 2025-2027
Executive Snapshot
Capital allocation for oil filling lines follows a 60:30:10 split—60 % of lifetime cost is incurred after the PO is signed (installation, validation, downtime). Tier choice therefore dictates not only CapEx but also OpEx volatility and brand exposure. The matrix below isolates the five variables that move TCO most: landed cost, technical sophistication, lead-time, regulatory friction and residual value.
Regional Capability & Risk Table (2025 Baseline)
| Region | Predominant Tier | Tech Level (0-5)¹ | Cost Index (USA = 100) | Std. Lead Time (weeks) | Key Compliance Risk² |
|---|---|---|---|---|---|
| USA | Tier 1 | 5 | 100 | 20–24 | Low (FDA, UL, NFPA) |
| Germany / NORDICS | Tier 1 | 5 | 105–115 | 22–26 | Very Low (CE, ATEX, EHEDG) |
| Italy / Spain | Tier 1-2 | 4 | 85–95 | 18–22 | Low-Med (CE, occasional ATEX gap) |
| Japan / S.Korea | Tier 1 | 5 | 110–120 | 24–28 | Low (PSE, KOSHA) |
| China East Coast (Shanghai-Suzhou) | Tier 2 | 3–4 | 55–65 | 14–18 | Med-High (ATEX documentation gaps, IPR) |
| China Inland / Tier-3 cities | Tier 3 | 2–3 | 40–50 | 10–14 | High (traceability, FAT reliability) |
| India (Pune-Ahmedabad corridor) | Tier 2 | 3 | 50–60 | 16–20 | Med (PED, CE test reports often outsourced) |
| Turkey / Eastern EU | Tier 2 | 3–4 | 65–75 | 16–20 | Med (ATEX valid, but vendor data incomplete) |
¹Tech Level: 5 = servo-driven, IoT-ready, CIP/SIP, 21 CFR Part 11 by design; 3 = PLC+VFD, manual format change; 2 = pneumatic, no data logging.
²Risk is probability of a non-conformity causing >2-week commissioning delay or recall exposure.
Trade-off Geometry
CapEx vs. Risk Delta
A 6-head volumetric filler (1,000–5,000 cP edible oil, 1-L PET) prices at $160k–$190k FOB Chicago (Tier 1 USA), whereas functionally comparable Chinese Tier-2 equipment lands at $85k–$100k including sea freight. The $75k–$90k savings must be offset against three quantifiable exposures: (1) FAT re-work probability 18 % vs. <3 % in USA/EU, adding 2–4 weeks to schedule; (2) ATEX dossier gaps that can trigger a $25k–$40k third-party audit on arrival; (3) 3-year OPEX penalty of roughly 4 % of CapEx due to lower component MTBF (Chinese bearings, pneumatics). NPV modelling at 8 % discount shows break-even risk cost of ~$65k—meaning the Chinese option remains $10k–$25k cheaper if management can tolerate 3-week schedule elasticity and accept spare-parts dual-sourcing.
Lead-time Arbitrage
For fast-track launches (≤16 weeks gate-to-SOP), Chinese Tier-2 and Indian Tier-2 suppliers are the only viable cohort; however, buffer an extra 4-week port-and-customs contingency. EU and USA Tier-1 factories are booked 6–9 months forward; premium expedite fees (8–12 % of machine value) only compress lead-time by ~3 weeks, eroding the risk-adjusted value proposition.
Regulatory Convergence
Post-2026, the EU Machinery Regulation (replacing MD 2006/42/EC) will require digital instruction files and cybersecurity self-declaration. Tier-1 EU suppliers already embed these, but Tier-2 Chinese vendors have no roadmap, exposing buyers to retro-fit charges of $15k–$25k per line. Conversely, FDA’s forthcoming Part 11 guidance on electronic batch records favours USA and German suppliers whose control packages are 21 CFR-ready; selecting a low-cost Tier-3 Asian unit could necessitate a $30k software overlay to pass Stateside validation.
Sourcing Playbook (2025-2027)
-
Core-brand, high-viscosity lubes (automotive, food-grade): Insist on Tier-1 EU/USA; CapEx premium <15 % versus top-tier Italian or Korean vendors, but residual value after 7 years is 35 % vs. 18 % for Chinese assets, narrowing TCO gap to <5 %.
-
Private-label, price-war categories: Employ Chinese Tier-2 but lock three safeguards—(a) 100 % FAT witnessed on-site, (b) escrow 15 % payment until IQ/OQ sign-off, (c) force majeure clause for IPR infringement; expected savings 20–25 % net of risk.
-
Capacity-flex lines (seasonal 30 % swing): Hybrid model—Tier-1 filler, Tier-2 satellite cappers/labelers; keeps critical fill accuracy under EU/US compliance while cutting satellite module cost by 30 %.
-
Spare-part strategy: wherever Chinese or Indian Tier-2 is selected, negotiate a 10-year “bonded inventory” term (vendor holds 5 % of BOM value in regional 3PL) to offset obsolescence risk; cost <1 % of machine value annually but halves unplanned downtime.
Bottom Line
The oil filling machine supply base is bifurcating into a high-compliance, high-resilience lane (USA/EU/Japan) and a cost-optimized, schedule-flexible lane (China/India). The correct tier is not a commodity decision—it is a risk-capacity decision. Map the lifetime cost of a one-week launch delay against the CapEx delta; in most cases above $1.5 million lost contribution per week, Tier-1 USA/EU remains the value-maximizing choice despite 40–60 % higher upfront spend.
Financial Analysis: TCO & ROI Modeling
Total Cost of Ownership (TCO) & Financial Modeling
Acquisition Price Is <40 % of 10-Year Cash Outflow
FOB prices for a 4-head volumetric oil filler (1 000–3 000 bph) sit between $50 k and $80 k in 2025. Capitalised interest, insurance and inland freight add 6–8 %, but the real lever on IRR sits in post-installation cash drains. A mid-tier European-built line analysed for a 5-million-L/year edible-oil bottler shows energy, maintenance, spare-parts inventory and downtime-related lost contribution consuming 62 % of nominal NPV at an 8 % discount rate. Compressor-based vacuum systems common in oil fillers draw 0.35–0.55 kWh per 1 000 L; at €0.14/kWh that equals $0.05 per 1 000 L, or $250 k over 10 years on a two-shift schedule—already 3× the machine sticker price. Servo-driven alternatives cut consumption by 28 % but carry a +18 % CAPEX premium; payback is 2.1 years under EU energy prices, 4.3 years under ASEAN industrial tariffs.
Maintenance Labour & Spare-Parts Logistics
Mean labour cost for mechanical adjustment, O-ring replacement and HMI calibration runs $8–$12 per operating hour in North America, $2.50–$4.00 in coastal China. A 6-head gravity filler needs 48 man-hours per 1 000 run-hours; annual labour bill therefore ranges $19 k–$57 k depending on site location. Critical path parts—sealing jaws, flow-meter turbines, servo drives—carry a 22–26 % annual obsolescence risk because OEMs refresh control platforms every 4.2 years on average. Holding a €35 k consignment stock locally raises working capital 0.8 % of revenue but slashes emergency freight cost from €6 k to €700 per incident and cuts mean downtime from 36 h to 8 h, translating into €48 k preserved contribution per stoppage. Contracting a 5-year “full-risk” service package priced at 7.5 % of FOB per annum flattens the labour curve and locks spare-part inflation at <2 % CAGR, outperforming self-maintenance once opportunity cost of downtime exceeds $1 200/h.
Resale Value & Exit Option
Secondary-market data from EquipNet and Rabin show 5-year-old stainless-steel oil fillers retain 38–42 % of invoice price if OEM documentation and FAT records are intact; missing CE or UL files depress bids to 22–25 %. Machines with obsolete PLCs trade at scrap value ($2.5–$3.1/kg). Embedding a “future-proof” clause in the supply contract—guaranteeing 10-year parts availability and free control software migration—lifts exit valuation by 6–8 %, worth $3.0–$4.5 million on a multi-line divestiture.
Hidden Cost Benchmark Table (Mid-Range 6-Head Filler, FOB $65 k)
| Cost Element | Low-Cost Asia Build | Premium EU Build | Delta Impact on 10-Year NPV |
|---|---|---|---|
| Installation & rigging | 7 % | 5 % | –$1.3 k |
| FAT, SAT, IQ/OQ documentation | 4 % | 8 % | +$2.6 k |
| Operator training (3 staff, 3 days) | 2 % | 3 % | +$0.7 k |
| Import duty & brokerage | 8 % | 0 % (EU buyer) | –$5.2 k |
| Start-up consumables (lube, seals) | 1 % | 1 % | 0 |
| Insurance during transit | 1 % | 1 % | 0 |
| Total Hidden Cash at Day 1 | 23 % | 18 % | –$3.2 k |
Use the 18–23 % range when building cash-flow models; deviation beyond 25 % signals either scope creep or vendor margin stacking.
Risk Mitigation: Compliance Standards (USA/EU)
Critical Compliance & Safety Standards: Importing Oil Filling Machines into the US & EU
Non-compliant equipment triggers immediate red-tagging at port, six-figure fines, and forced retrofits that erase any CapEx savings. UL 508A, CE Machinery Directive, FDA 21 CFR §110.40, and OSHA 1910.212 are not optional add-ons; they are the legal baseline that determines whether the asset clears customs, can be insured, and is allowed to run. Executives should budget 8–12 % of machine CAPEX for third-party certification and local field labeling; failure budgets typically balloon to $250 k–$400 k once stop-ship orders, storage demurrage, and expedited re-work are factored in.
US Gatekeepers: UL 508A, NFPA 79, OSHA 1910.212, FDA 21 CFR
UL 508A (Industrial Control Panels) is enforced by OSHA through NRTL recognition. Any oil filler with >50 V electrical assembly must carry a UL 508A field label; field evaluations cost $7 k–$12 k per skid and add 2–3 weeks if the OEM has not pre-certified. NFPA 79 governs wiring color, emergency-stop circuits, and IP54 minimum enclosure rating; non-conforming wiring is the single largest reason for US Customs Form 29 (Notice of Redelivery). OSHA 1910.212 mechanical standard requires fixed guards with ≤6 mm tool-opening and interlocked access; missing interlocks have triggered willful-violation penalties of $136 k per occurrence in 2023 DOJ settlements. If the filled product is ingestible (olive, coconut, CBD), FDA 21 CFR §110.40 mandates food-grade lubricants, 316L product-contact surfaces, and post-weld pickling with documented Ra ≤0.8 µm finish; FDA import alert 99-41 allows detention without physical examination if prior shipments lacked surface-finish certificates.
EU Gatekeepers: CE Machinery Directive, ATEX 2014/34/EU, REACH, EHEDG
CE conformity is self-declared by the OEM, but the importer holds joint-and-several liability. The Technical File must include EN ISO 13849-1 PLr calculation showing SIL 2 / PL d on fill-nozzle safety function; missing fault-tree analysis has led to UK HSE £1.2 million fines. ATEX 2014/34/EU applies if the oil creates combustible mist (e.g., high-speed filling >120 cSt at >60 °C); Zone 22 certified panels add $15 k–$25 k to panel cost. All gaskets and hoses must comply with REACH SVHC <0.1 % w/w; non-compliant lots are rejected at Rotterdam with €5 k/day detention fees. For edible oil, Regulation (EC) 1935/2004 demands Declaration of Compliance and overall migration testing ≤10 mg/dm²; without it, the shipment is re-exported at importer cost.
Legal Risk Quantification
| Standard (US/EU) | Typical Penalty Range | Detection Point | Retrofit Cost Index* | Insurance Void? | Supply-Chain Impact |
|---|---|---|---|---|---|
| UL 508A missing | $50 k – $250 k + stop-ship | US Port NRTL spot-check | 1.6× panel value | Yes – property & casualty | 6–8 wk delay, air-freight premium |
| CE MD no TC | £500 k – £2 M (UK HSE precedent) | EU customer audit | 1.3× machine value | Yes – product liability | Recall of filled product possible |
| FDA 21 CFR surface finish | Warning letter → consent decree | FDA import alert | 0.9× machine value | No – but contingent recall uninsured | Automatic detention on future lots |
| OSHA 1910.212 willful | $136 k/violation + criminal referral | OSHA inspection | 0.4× machine value | Possible – punitive exclusion | Plant shutdown until abated |
| ATEX non-compliance | €1.5 M (German BGCI 2022 case) | Insurer post-loss audit | 2.2× panel value | Yes – explosion exclusion | Full production halt, lost CE mark |
*Retrofit Cost Index = (direct compliance retrofit spend) ÷ (original machine CAPEX).
Source: US OSHA, UK HSE, German BGCI court filings, Marsh Global Risk Analytics 2023.
Mitigation Playbook
Insist on OEM provision of UL 508A label, CE Declaration of Incorporation, and FDA surface-finish 3.1b certificates before shipment; embed these as 100 % invoicing milestones to shift retrofit risk upstream. Require supply agreements to contain “compliance escrow” equal to 10 % of PO value released only after on-site third-party audit passes. Finally, validate that the OEM’s notified body for CE is within the EU NANDO database; counterfeit CE notifications from Asian consultancies have risen 38 % YoY, exposing importers to strict liability.
The Procurement Playbook: From RFQ to Commissioning
Strategic Procurement Playbook: Oil Filling Machine Sourcing
RFQ Drafting: Lock-in Performance Before Price
Anchor the specification to fill accuracy ≤±0.2 %, OEE ≥85 %, and MTBF ≥2 000 h; anything looser erodes TCO by 3-5 % per annum. Demand a digital twin file (STEP & PLC code) within 10 calendar days of RFQ dispatch; suppliers who cannot deliver the twin in time fail the technical gate automatically. Require a binding 10-year parts availability clause with price-index cap of CPI+2 %; legacy machines show 35 % price inflation on wear parts after year 7. State that liquidated damages for throughput shortfall are 1 % of contract value per 0.5 % deviation, capped at 10 %—this aligns supplier capital allocation with your volume risk. Finally, insert a “no China-sourced critical valves” line; 18 % of field failures in 2023 were traced to sub-tier valve suppliers in Shandong.
Supplier Due-Diligence & Sample FAT Matrix
Book FAT slots only at ≥80 % design capacity—lower masks timing issues that surface at 90-95 % during Ramadan or Chinese New Year peak shifts. Insist on 3×2 000 bottle endurance loop using your exact oil grade; viscosity delta of 20 cP alfill accuracy by 0.3 %. Collect SCADA log files (.csv) every 30 min; historical analysis shows 72 % of FAT “pass” machines had hidden pressure spikes >1.2 bar that voided warranty later. Require supplier to fund third-party FDA/EC 1935 verification if food-grade pack is even a remote future option; retrofit cost averages $22 k–$35 k if skipped.
FOB vs DDP Decision Matrix
| Cost & Risk Vector | FOB Shenzhen (USD) | DDP Chicago (USD) | Delta Impact |
|---|---|---|---|
| Machine EXW | 400 k | 400 k | — |
| Seafreight + CY | 6 k | — | +6 k |
| Marine insurance | 1.2 k | — | +1.2 k |
| Import duty (HS 8422.30) | 32 k | 32 k | 0 |
| Port congestion demurrage (avg. 7 days) | 4.5 k | — | +4.5 k |
| Inland freight to site | 8 k | incl. | –8 k |
| Customs brokerage | 2 k | incl. | –2 k |
| Total Landed | 453.7 k | 470 k | +16.3 k |
| Risk ownership (loss/damage) | Buyer at port | Supplier until dock | Transfer point shift worth ~1 % of CAPEX in volatile freight markets |
Use FOB when freight volatility <8 % and you can charter 40 ft HC containers quarterly; switch to DDP when CFR spot rates exceed $4 500/FEU or project IRR hurdle is <14 %.
Contract Risk Control Terms
Insert a retention of title clause valid until final acceptance; in 2022, 4 % of mid-tier OEMs entered insolvency between shipment and commissioning. Tie 10 % final payment to SAT Run@Rate—48 h continuous operation at nameplate speed with Cpk ≥1.67 on fill weight; empirical data show this captures 94 % of latent defects. Cap force majeure downtime at 90 days, after which you may source alternative interim capacity at supplier’s cost; average rental for equivalent filler is $18 k–$25 k/month. Require source-code escrow for PLC and HMI; post-warranty modifications cost $3 k–$5 k per visit if OEM engineers required. Finally, govern contract under English law & SIAC arbitration—median resolution 6.8 months vs 14 months under PRC courts.
Final Commissioning: Zero Punch-List Target
Run OQ/IQ/PQ protocols in single 72 h block; splitting quadruples documentation rework. Calibrate mass-flow meters with supplier’s NIST-traceable weights; 0.1 % calibration error propagates to $42 k annual oil giveaway at 10 k l/h. Capture Golden Batch parameters into MES; sites that skip this step average 4 weeks longer to reach steady-state OEE. Withhold 5 % spare-parts credit (value $20 k–$40 k) until MTTR ≤30 min demonstrated over 5 consecutive failures; otherwise credit converts to free parts. Close project only after energy consumption verification—every 0.5 kWh above spec adds $4 k/year at $0.10/kWh, 3-shift operation.
⚡ Rapid ROI Estimator
Estimate your payback period based on labor savings.
Estimated Payback: —