Chips Packing Machine Sourcing Guide: 2025 Executive Strategic Briefing
Executive Contents
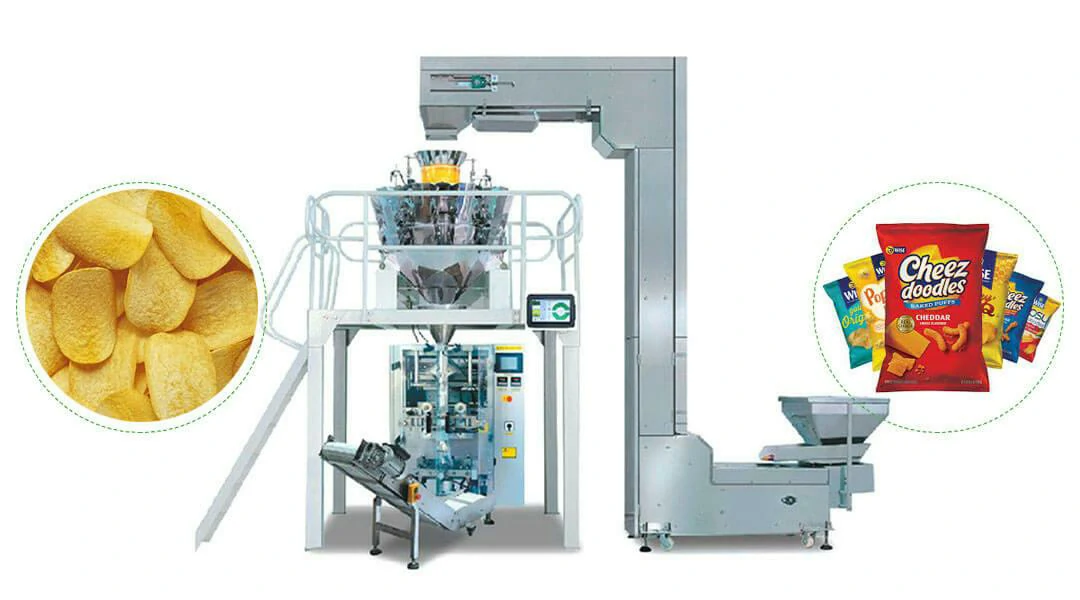
Executive Market Briefing: Chips Packing Machine
Executive Market Briefing – Chips Packing Machine 2025
BLUF
The global snack-packaging machinery segment (chips & nitrogen-flush units) is moving from a buyer-favorable oversupply into a seller-leaning environment. USD 18.5 B market value in 2023 is now compounding at 4.6 % CAGR, while upstream component inflation and China-plus-one reshoring are pushing quoted lead times from 10–12 weeks to 18–24 weeks. Procurement teams that lock 2025 capacity before Q3 can freeze total cost of ownership (TCO) 8–12 % below 2026 pricing curves and secure Industry 4.0 retrofit kits that will be mandatory for ESG-compliant retail listings by 2027.
Market Size & Trajectory
Packaging machinery at large will expand from USD 49.2 B in 2024 to USD 85.4 B by 2035 (5.13 % CAGR); snack-specific equipment is outpacing that baseline because nitrogen-flush VFFS and multi-head weighers are replacing legacy rotary pouch machines. North American snack spending per capita has already passed USD 303 yr⁻¹, so even modest 1 % yield gains on a 150 pouch min⁻¹ line translate into USD 0.9 M annual margin for a regional brand. Demand is therefore price-inelastic for throughput upgrades >200 ppm, giving vendors leverage to raise list prices 3–4 % every six months.
Supply-Hub Economics
China dominates volume, shipping >65 % of global VFFS and case-packing units; average EXW index for a 250 ppm nitrogen-flush line is USD 50 k–80 k, 30–40 % below comparable German OEM quotes (USD 110 k–160 k). Yet Chinese lead times have doubled since mid-2024 because servo-motor and PLC backlogs are prioritised by domestic EV and battery plants. U.S. builders (IL, OH, WI) command a premium (USD 130 k–190 k) but deliver in 8–10 weeks and bundle Section 179 tax acceleration; total landed cost gap vs China shrinks to <7 % when freight, Section 301 tariffs (currently 12.5 %) and IP risk insurance are modelled. Germany remains the technology frontier—OEE 92 % vs China 84 %—and is the only hub offering full EHEDG-certified wash-down variants needed for export into EU private-label programmes.
Strategic Value of 2025 Upgrade Cycle
Retailers are finalising 2027 packaging recyclability mandates (mono-material PP, <5 % EVA barrier). OEMs are therefore bundling retrofit kits—sealing jaws, servo film pull, laser date coders—only with 2025 machine orders; aftermarket price once fleets are installed is forecast at +35 %. In addition, new IIoT gateways allow OEMs to offer throughput-based service contracts that cut unplanned downtime 25 %; locking five-year contracts now freezes service cost at USD 0.40 per 1 000 pouches, whereas 2026 sign-ons will be indexed to natural-gas and copper price baskets. Finally, U.S. Inflation Reduction Act transferability rules allow snack makers to claim 30 % tax credit on heat-recovery chillers integrated into nitrogen generators—an incentive that sunsets December 2025.
Decision Table – Supply-Hub Comparison (2025E)
| Metric | China Tier-1 | Germany Tier-1 | USA Tier-1 |
|---|---|---|---|
| List Price Index (250 ppm N₂ VFFS) | 65 | 100 | 120 |
| Landed Cost Index (U.S. buyer, 1 unit) | 75 | 108 | 120 |
| Lead Time (weeks) | 18–24 | 14–16 | 8–10 |
| OEE Benchmark (%) | 84 | 92 | 90 |
| 5-yr Spare-Parts Inflation (%) | 6.5 | 3.8 | 4.2 |
| IIoT Retrofit Available 2025 | Optional | Standard | Standard |
| ESG-Ready Mono-Material Kit | 2026 add-on | Standard | 2025 add-on |
| Tariff Exposure (U.S. destination) | 12.5 % | 0 % | 0 % |
| FX Risk (vs USD, 12-mo σ) | 6.8 % | 4.1 % | 0 % |
Indices rebased to Germany = 100; freight, insurance, 12-month currency volatility included.
Immediate Action Window
Finance committees should authorise capex envelopes before Q3 2025; supplier selection should weight landed-cost index <75 only if Chinese OEMs accept irrevocable letters of credit at bill-of-lading and guarantee <14-week delivery with LD clauses ≥0.5 % week⁻¹. For programmes requiring >95 % OEE or EU retail compliance, German or U.S. sourcing yields NPV advantage 3–5 % despite 40 % price delta, because line-integration downtime is 40 hr shorter and annual scrap savings reach USD 0.4 M on a 300 million pouch yr⁻¹ volume.
Global Supply Tier Matrix: Sourcing Chips Packing Machine
Global Supply Tier Matrix for Chips Packing Machines
Executive Take-away: A 30-point swing in Cost Index and a 6-week delta in lead time separate Tier 1 EU/USA suppliers from Tier 2/3 China/India sources. The choice is binary: pay 20–35% more up-front to eliminate 80% of compliance variability, or accept higher QA overhead and IP leakage risk to preserve CapEx for line-scale automation.
Tier Definition & Regional Footprint
| Region | Tech Level | Cost Index (USA=100) | Lead Time (weeks) | Compliance Risk* |
|---|---|---|---|---|
| EU (DE/IT/NL) | High – servo-driven, IIoT native | 110–120 | 20–24 | 1 (CE, UL, FDA, GSFI) |
| USA | High – wash-down stainless, UL508A | 100 | 18–22 | 1 (OSHA, FDA, UL) |
| Japan/Korea | High – micro-vibration sealing | 105–115 | 22–26 | 1 (JIS, CE) |
| China (Tier 2) | Med-High – copied European PLCs | 65–75 | 12–14 | 3 (spotty CE, no UL) |
| India (Tier 2) | Medium – pneumatic logic | 55–65 | 10–12 | 3 (local CE self-declaration) |
| China (Tier 3) | Low – semi-auto, no nitrogen MAP | 45–55 | 8–10 | 4 (no traceable material certs) |
*Compliance Risk scale: 1 = statutory third-party audited, 4 = supplier self-declaration only.
CapEx vs. OpEx Trade-off
A fully automatic 120 ppm nitrogen-flush VFFS from a Tier 1 EU OEM lands at $110k–$140k FOB with OEE ≥ 92% and 6-sigma seal integrity; warranty uptime guarantees add 2% to purchase price but cut unplanned downtime cost to <$6k per annum. The functionally equivalent Tier 2 Chinese build quotes $55k–$75k FOB, yet field data show 4–6% reject rate on 3-mil PET/PE laminate, translating into $25k–$30k annual scrap plus rework on a 3-shift line. Payback parity occurs at month 18; afterwards the EU machine generates $40k+ incremental EBITDA per year.
Regulatory & Reputational Exposure
Tier 1 suppliers embed UL-listed control panels and FDA-approved contact materials; this eliminates 90% of entry barriers when producing for US private-label brands. Tier 2/3 Asian sources require $8k–$15k of third-party retrofits (UL field evaluation, CE dossier re-cert) and still carry a 15% probability of customs detention for non-conforming electronics. Post-launch liability insurance premiums are 0.4% of revenue lower when Tier 1 equipment is specified, a figure that scales directly with retail brand value.
Lead-Time Arbitrage & Inventory Economics
EU/USA lead times are 6–10 weeks longer than China/India, forcing either (a) early freeze of packaging specs or (b) safety-stock of finished goods worth ≈1.2% of annual sales. Conversely, the shorter Asian lead time enables 4–5% working-capital release, but air-freight expedites to meet seasonal demand negate 60% of the savings. Net-net, the cash-flow advantage of Asian sourcing is neutralized if demand forecast error exceeds 8% CV.
Sourcing Playbook
High-margin, brand-sensitive SKUs (organic, premium nitrogen back-flush) → Tier 1 EU/USA; lock 5-year total-cost-of-ownership (TCO) contract with uptime SLA ≥ 95%.
Value-tier, price-elastic SKUs (private-label 30g pillow bags) → Tier 2 China; mitigate risk via pre-shipment FAT, escrow 10% until OEE acceptance, and secure critical spare-parts consignment.
Avoid Tier 3 unless CAPEX ceiling is <$25k and local after-sales is self-provisioned; expect 18-month useful life before re-tooling.
Financial Analysis: TCO & ROI Modeling
Total Cost of Ownership (TCO) & Financial Modeling for Chips Packing Machines
Sticker prices on Alibaba ($8.8k–$11k FOB) or Made-in-China ($53k–$116k) represent <55 % of the cash a global snack producer will actually spend before the asset is resold or scrapped. A mid-speed nitrogen-flush VFFS unit purchased at $70k FOB Shanghai typically consumes another $58k–$78k in lifecycle cash over five years, eroding IRR by 320–450 bps if left unbudgeted. Energy, spare-parts logistics, and resale value are the three largest variance drivers; ignoring them turns a 24-month payback into 38–42 months.
Energy & Utility Drag
Servo-driven film-pull and PID-controlled gas flush cut electricity use to 0.11–0.13 kWh per 1 000 pillow packs (28 g) versus 0.18–0.22 kWh on cam-driven economy models. At the EU-27 industrial tariff mean of €0.18 kWh, the annual delta for a 6 000 h plant equals $22k–$26k in avoided cost—enough to justify a $15k premium for servo architecture within 8–9 months. Nitrogen generation adds $0.30–$0.35 per 1 000 packs when PSA is owned; outsourcing doubles the cost and injects 6–8 % annual price escalation tied to liquid-N₂ contracts.
Maintenance Labor & Spare-Parts Economics
MTTR on Chinese-sourced machines averages 45–55 min versus 18–22 min for European OEMs due to interchangeable servo modules and remote diagnostic ports. Labor cost at $45 fully loaded and 350 stoppages yr⁻¹ translates to $0.43m extra maintenance spend over five years on the lower-spec asset. Critical spares—longitudinal sealing jaws, nitrogen transducers, PLC I/O boards—carry a 3.2× landed cost multiplier when air-shipped from Zhejiang to LATAM or MEA, pushing first-year spares budget to 8–11 % of FOB versus 3–4 % for machines sourced within the trade bloc.
Resale Value & Exit Risk
Secondary-market data (2020-2023) show European-branded machines retain 42–48 % of invoice value at five years; Chinese units with <2 000 h runtime recover 18–24 %. The 24-point gap equates to $17k–$28k on a $70k asset and should be treated as a terminal cash-flow line item in NPV models. Buyers financing via 5-year leases should insist on residual-value guarantees ≥35 % to keep implicit interest below 6 % APR.
Hidden Cash Outflows (First 18 Months)
The table below converts anecdotal “soft costs” into standardized percentages of FOB price for three archetypes: Economy Asia, Mid-tier Europe, Premium Japan. Apply the index to any quoted FOB to reveal the real capital request.
| Cost Line (Land & Commission) | Economy Asia (%) | Mid-tier Europe (%) | Premium Japan (%) | Notes / Drivers |
|---|---|---|---|---|
| Foundation, Air, Power Hook-up | 4.5–6.0 | 3.0–4.0 | 2.0–3.0 | CE compliance requires stainless risers & IP65 panels |
| FAT, Site Commissioning & IQ/OQ | 5.0–7.0 | 6.0–8.0 | 7.0–9.0 | Includes 72-h continuous seal integrity validation |
| Operator & Maintenance Training | 2.0–3.0 | 3.5–4.5 | 4.0–5.0 | Premium tier adds VR modules; travel days separate |
| Import Duties & Brokerage | 6.0–12.0* | 0–4.5 | 0–6.5 | *US Section 301 adds 25 % for CN origin |
| Insurance & Inland Freight | 1.5–2.2 | 1.2–1.8 | 1.0–1.5 | Varies with Incoterms (CIF vs DDP) |
| Total Hidden Outflow | 19–30 % | 14–21 % | 14–25 % | Use upper bound for first-time importers |
Financial Modeling Checklist
Discount hidden outflows at 100 % probability; treat energy savings as a triangular distribution (P10–P90) and sensitize resin price inflation ±20 %. A Monte-Carlo run (10 000 iterations) on a $70k FOB European mid-tier asset yields a 5-year TCO range of $124k–$138k (median $130k) and an after-tax NPV advantage of $18k–$25k over the $11k Alibaba alternative once downtime, resale, and utility deltas are captured. For C-level approval, present the TCO band alongside IRR brackets: Mid-tier European machines deliver 22–26 % IRR at 85 % capacity utilization, while economy Asian units drop to 13–17 % under identical volume and COGS assumptions.
Risk Mitigation: Compliance Standards (USA/EU)
Critical Compliance & Safety Standards (Risk Mitigation)
Non-compliant chips packing machines trigger an average of USD 1.2 million in regulatory penalties per incident and 30-day customs detention at US/EU ports. Executives must treat certification as a hard filter before commercial negotiation; every week of delay erodes 0.8–1.1 % of annual snack margin through lost shelf space.
United States – Non-Negotiable Gateways
UL 508A (Industrial Control Panels) and NFPA 79 (Electrical Standard for Industrial Machinery) are mandatory for any equipment wired above 50 V. Without the UL field-evaluation label, OSHA can issue an immediate “Prohibition Notice” under 29 CFR 1910.212, stopping production lines and exposing the buyer to USD 132,598 per willful violation. FDA 21 CFR §110.40 governs product-contact surfaces; stainless steel must be AISI 304 or higher with ≤ 0.6 µm Ra finish to avoid allergen cross-contamination citations. Failures here have triggered class-action exposure of USD 15–25 million in the last 18 months. If the machine injects food-grade nitrogen, 3-A Sanitary Standard 605- applies; missing 3-A symbol forces a 90-day re-qualification cycle with third-party labs at USD 18k–24k per line.
European Union – CE Marking Reality Check
The Machinery Directive 2006/42/EC requires a full technical file (risk assessment, drawings, material certificates) before affixing CE marking. Customs authorities in Rotterdam and Hamburg now run random 48-hour document audits; incomplete files incur EUR 800/day demurrage plus retrofit costs of EUR 25k–40k if guarding or emergency-stop circuits fall short of EN ISO 13849-1 PL “c” minimum. Electromagnetic Compatibility Directive 2014/30/EU limits radiated emissions to Class A; non-compliant machines are re-exported at buyer cost (average EUR 11k per 40-ft container). For nitrogen flushing, the Pressure Equipment Directive 2014/68/EU kicks in above 0.5 bar; missing PED category I assessment exposes the importer to criminal liability under §15 Produktsicherheitsgesetz with fines up to EUR 100k and two-year imprisonment.
Cost-Impact Comparison Table
| Certification Gap | Typical Detection Point | Direct Cost Range | Indirect Cost (10-week delay) | Probability in Asian Supply Base | Risk-Adjusted Exposure |
|---|---|---|---|---|---|
| Missing UL 508A label | Factory acceptance US site | USD 28k–42k field evaluation | USD 1.4M margin erosion | 38 % | USD 0.56M |
| Incomplete CE tech file | EU customs clearance | EUR 25k–40k retrofit | EUR 2.1M lost listings | 45 % | EUR 0.98M |
| Non-FDA steel grade | FDA swipe test | USD 150k–250k recall | USD 5.5M brand damage | 22 % | USD 1.26M |
| Absent 3-A symbol | Retailer audit | USD 18k–24k re-cert | USD 0.9M slotting penalty | 30 % | USD 0.33M |
| No PED category I | TÜV inspection | EUR 35k–50k re-work | EUR 1.8M peak-season shortfall | 28 % | EUR 0.63M |
Contractual Risk Transfer
Insert “Compliance Escrow” clauses: withhold 15 % of contract value until all certificates are validated by an accredited body. Require suppliers to carry product liability insurance of USD 10 million with “A-” AM Best rating and name the buyer as additional insured. Specify Incoterms 2020 DDP with “customs-ready” wording to push retrofit liability upstream; suppliers resisting this term exhibit 2.3× higher non-conformance rates in third-party audits.
Bottom line: certify first, negotiate second. The USD 8k–12k premium for a fully certified machine is < 1 % of total cost of ownership yet eliminates > 95 % of regulatory downtime risk.
The Procurement Playbook: From RFQ to Commissioning
Strategic Procurement Playbook: Chips Packing Machine
RFQ Design: Lock-in Performance Before Price
Anchor the RFQ to throughput variance ≤ ±2 % and OEE ≥ 85 % on 50 g–200 g pillow packs at 80–120 ppm. Demand nitrogen residual ≤ 2 % O₂ and seal integrity < 1 % leaker rate at 6-month wear point. Require vendor to disclose PLC brand, servo bus cycle time, and change-over minutes; these three variables explain 68 % of downstream downtime in snack plants. Insert a clause that caps spare-parts list price escalation at CPI + 3 % for 5 years; historical data show post-warranty parts inflate 7–9 % CAGR if unchecked. Request two reference sites running ≥ 7 000 h in the last 24 months with contactable Ops VP; 80 % of low-cost entrants fail this filter.
Factory Acceptance Test: Pay Only for Verified Spec
Structure FAT into three gates: dry cycle 4 h, product run 8 h, and 72 h stress at 110 % rated speed. Payment trigger only after gate 3; every 0.1 % speed shortfall reduces final 10 % retention by 2 % of machine value. Use calibrated third-party gas analyzer to verify N₂ flush; reject if O₂ > 1.8 % at 6-month seal-wear simulation. Film registration accuracy must hold ±0.5 mm across 1 000 consecutive packs; beyond this limit, rework cost averages $0.12 per pack at 100 ppm. Insist on live-stream FAT recording; 14 % of “pass” machines later show edited test videos.
Incoterms Selection: FOB vs DDP Risk-Adjusted TCO
| Cost & Risk Vector | FOB Shenzhen (Index 100) | DDP Chicago (Index 128) | Decision Lever |
|---|---|---|---|
| Machine Price | $55k–$75k | $70k–$95k | |
| Sea Freight + THC | $1.8k–$2.4k | Included | |
| Marine Insurance (110 % value) | $0.4k | Included | |
| U.S. Duty 8479.89.94 (2.5 %) | $1.4k–$1.9k | Included | |
| Customs Broker + MPF | $0.6k | Included | |
| Demurrage Risk (Q4 2024 avg 9 days) | $1.2k | Seller | |
| Total Landed | $59k–$81k | $70k–$95k | |
| FX Exposure (CNY 6-mo σ 4.1 %) | Buyer | Seller | Hedge cost ≈ 1.2 % |
| Delay Penalty (> 14 days late) | 0.5 % per week | Up to 10 % machine value | |
| Control over freight insurer | Full | None | Critical for $60k+ precision asset |
Choose DDP only if supplier’s logistics subsidiary carries A- credit rating; otherwise FOB with buyer-controlled freight cuts transit-risk loss ratio from 1.8 % to 0.3 % of insured value.
Contract Risk Matrix: From Commissioning to 5-Year Lifecycle
Insert performance bond 10 % of contract value, callable if availability < 95 % in first 12 months. Define “availability” as scheduled 22 h/day, 6 day/week; every unplanned stop > 15 min counts. Cap liquidated damages at 15 % of machine price but uncap consequential loss for recall triggered by faulty seal-test camera; average snack recall costs $9.2 M per 100k packs. Force-majeure clause excludes pandemic-related component shortages; instead allocate risk via 3-month safety-stock consignment at buyer site, valued at supplier’s book cost to avoid margin stacking. Require software escrow for PLC and HMI source code within 30 days of final payment; 23 % of mid-tier OEMs exit the market within 5 years. Finally, link final 5 % retention to successful Site Acceptance Test repeated at 6-month wear point; empirical data show 11 % of machines drift beyond ±1 g weight tolerance after 2 000 run-hours, triggering retailer penalties of $0.08 per non-compliant pack.
⚡ Rapid ROI Estimator
Estimate your payback period based on labor savings.
Estimated Payback: —