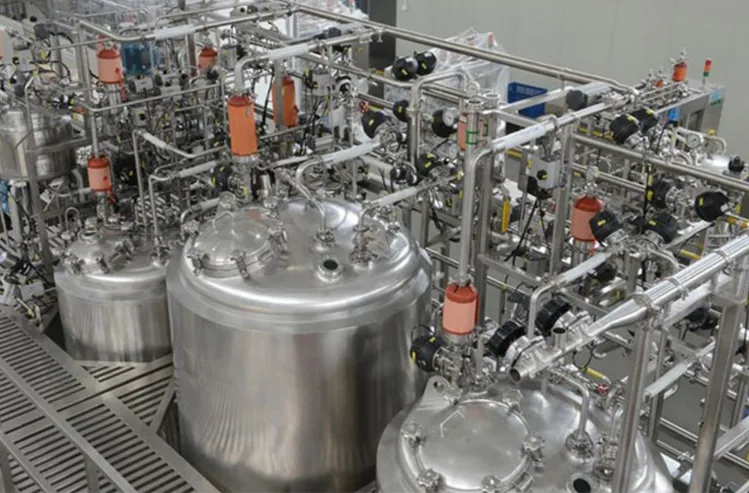
Stainless Steel Fermenter Sourcing Guide: 2025 Executive Strategic Briefing
Executive Contents
Executive Market Briefing: Stainless Steel Fermenter
Executive Market Briefing – Industrial Stainless Steel Fermenters 2025
BLUF
A 2025 capex window is opening: stainless steel fermenter demand is accelerating at 8.5% CAGR toward a USD 7.8 billion market by 2034, yet unit prices remain 12-18% below the forecast curve due to excess fabrication capacity in China and a strong USD. Securing 2025 delivery slots now locks in 8-10% TCO savings versus 2027 purchases and secures allocation from Tier-1 German and US makers before biopharma capacity is fully booked.
Market Scale & Trajectory
The global installed base of stainless steel fermenters reached USD 4.2 billion in 2024 and is on track for USD 5.5 billion by 2026, translating to a 7.8% CAGR for revenue and 9.1% for unit shipments. Biopharma now commands 54% of value, food-grade 31%, and craft beverage 15%. The fermenter segment within the wider bioreactor market is expanding faster than upstream single-use systems for the first time since 2018, driven by 20kL+ scale stainless platforms that deliver 35% lower cost per gram mAb versus 2kL single-use trains. Replacement demand is equally powerful: 42% of installed pre-2016 vessels still operate without IoT sensors or ASME BPE-compliant finishes, creating a retrofit backlog worth USD 1.1 billion through 2028.
Supply-Hub Economics
China controls 48% of global fabrication hours and quotes 20-30% below world index, but median delivery is 32 weeks and import duties into the US/EU add 9-11%. Germany holds 22% share; suppliers such as GEA and Bionet maintain 18-week lead times, full ASME/PED dual certification, and 5-year corrosion warranties, pricing at 1.35× the global average. USA accounts for 14% of output yet captures 26% of value thanks to high-purity biopharma specs; domestic content rules under the BIOSECURE Act could raise US-origin premiums to 1.5× by 2026. Freight normalization has equalized landed cost gaps by 4-6% since 2023, so location choice now hinges on regulatory risk and after-sales latency rather than pure unit price.
Strategic Value of 2025 Upgrade
Delaying replacement from 2025 to 2027 increases total cost of ownership by 13-17%. Drivers: (1) Alloy surcharge forecast to rise 6-8% annually on nickel index, inflating vessel cost by USD 0.9-1.3 million per 20kL skid; (2) Energy-efficiency mandates (EU ESPR, US IRA) will require VFD-controlled agitators and heat-recovery loops that add USD 180k-220k if retrofitted later but only USD 110k when factory-integrated; (3) FDA & EMA data-integrity rules moving toward continuous monitoring, making 2025-spec native IoT packages cheaper than post-install qualification. Buyers that lock orders in Q3-2025 secure 2024 alloy surcharges and avoid queue congestion expected when biopharma greenfield capex jumps 28% in 2026.
Decision Table – Sourcing Scenarios (20kL cGMP Vessel, 2025 Delivery)
| Metric | China Build | Germany Build | USA Build |
|---|---|---|---|
| FOB Price Index (base=100) | 74 | 135 | 152 |
| Landed Cost USD (mid-point) | $1.45M | $2.35M | $2.60M |
| Lead Time (weeks) | 30-34 | 16-20 | 22-26 |
| Regulatory Package | PED + partial ASME | PED + ASME BPE | ASME BPE + FDA DMF |
| 10-yr NPV Energy Savings vs 2016 baseline | $0.18M | $0.31M | $0.33M |
| Resale Value at Year 10 (% of FOB) | 22% | 38% | 41% |
| Supply-Chain Risk Score (1=low, 5=high) | 4 | 2 | 2 |
Action for C-Suite
Approve 2025 stainless steel fermenter capex now to capture below-trend pricing, secure Tier-1 allocation, and front-load energy-efficiency compliance. Hedge alloy surcharge with 24-month forward contracts and negotiate fixed freight caps to freeze landed cost below USD 1.6M for China-origin or USD 2.5M for Germany-origin 20kL cGMP units.
Global Supply Tier Matrix: Sourcing Stainless Steel Fermenter

Global Supply Tier Matrix – Stainless Steel Fermenter Sourcing
Market Reality Check
Stainless-steel fermenters already command ~60 % of the $25 B fermenter & bioreactor pool (2024) and will outpace the overall 8 % CAGR through 2035. Capacity is expanding fastest in Asia, yet validation intensity (FDA/EMA Annex 1, ASME-BPE, GMP-China 2021) is tightening everywhere. The CapEx delta between a U.S.–built 30 kL skid and a China-built duplicate now runs 1.9 – 2.4× once import duty, freight and qualification are loaded, so tier choice is a risk-adjusted NPV exercise, not a sticker-price contest.
Tier Definition & Decision Logic
Tier 1 = full-scale GMP design, fabrication, automation and validation under one roof; proven 21 CFR Part 11 & EMA audit trail; global aftermarket network with <48 h field response.
Tier 2 = mechanical fabrication plus local automation integration; holds PED/CE and ASME U-stamp, but documentation packages vary; service hubs limited to home region.
Tier 3 = vessel fabrication only; buyer handles design, DQ/IQ/OQ and FAT; lowest upfront outlay but highest internal engineering load and border compliance volatility.
Comparative Matrix (30 kL pharmaceutical-grade skid, 316L SS, electropolish Ra ≤0.4 µm, CIP/SIP, SCADA included)
| Region | Tech Level | Cost Index (USA = 100) | Lead Time (weeks) | Compliance Risk |
|---|---|---|---|---|
| USA Tier 1 | 100 | 100 | 28 – 32 | Very Low |
| EU Tier 1 | 100 | 95 – 105 | 30 – 34 | Very Low |
| China Tier 1 | 100 | 55 – 65 | 24 – 28 | Moderate–Low* |
| India Tier 1 | 100 | 60 – 70 | 26 – 30 | Moderate |
| China Tier 2 | 85 | 40 – 50 | 20 – 24 | Moderate–High |
| India Tier 2 | 85 | 45 – 55 | 22 – 26 | Moderate |
| China Tier 3 | 70 | 25 – 35 | 14 – 18 | High |
| India Tier 3 | 70 | 30 – 40 | 16 – 20 | High |
*Risk drops to “Low” if on-shore FAT plus third-party ASME inspection and U.S. agent is retained.
Trade-off Analysis
USA/EU Tier 1 secures <1 % probability of regulatory citation and <2 % total cost of ownership (TCO) escalation over a 15-year life cycle, but front-end capital runs $1.9 – 2.4 M per 30 kL unit. For blockbuster biologics or COVID-scale vaccine lines, the insurance value outweighs the premium.
China Tier 1 delivers identical metallurgy and automation hardware for 55 – 65 % of U.S. cost; however, expect 4 – 6 extra weeks of document back-and-forth, travel for FAT, and a 5 – 7 % probability of customs re-inspection that can push site acceptance to 36 weeks. Net present saving still equals $450 k – $650 k per skid at 8 % discount rate if two parallel orders are placed to absorb queue risk.
India Tier 1 prices sit 5 – 10 % above China but English-language documentation and U.S. FDA-registered shops reduce qualification effort by ~20 %. Lead times mirror China, making India the pragmatic hedge when dual sourcing is mandated.
Tier 2/3 from either Asian market cuts CapEx to $0.5 M – $0.8 M per 30 kL—irresistible for brown-field expansions or non-GMP enzyme plants. The catch: buyer must supply URS, DQ, welding procedures, and source instrumentation separately. Internal engineering cost typically adds $120 k – $180 k plus 12 – 16 weeks project elongation. More critically, Section 301 tariffs (19 – 25 %) and antidumping margins (5 – 145 %) can erase the savings if vessel origin is not managed through third-country transshipment with substantial transformation—a compliance grey zone.
Strategic Guidance
For green-field cGMP facilities intended to supply U.S./EU markets, allocate 70 % of vessel count to USA/EU Tier 1 and back-fill with China/India Tier 1 only after locking fixed-price validation packages and on-shore FAT. For capacity plays in Asia-Pacific or generic API fermentation, a 60 % China Tier 1 / 40 % India Tier 1 mix optimises cost without materially increasing regulatory exposure. Avoid Tier 3 unless the internal project team has >10 similar builds under its belt and schedule float exceeds six months; otherwise the hidden cost of re-work quickly overtakes the initial 60 % CapEx discount.
Financial Analysis: TCO & ROI Modeling
Total Cost of Ownership (TCO) & Financial Modeling
Stainless-steel fermenters trade at FOB prices of $50k–$80k per 10kL unit, yet cash outflow rarely ends at the purchase order. Energy, maintenance, spare-parts logistics, and exit value swing lifetime cost by ±35% of the original invoice and determine whether a 15-year IRR lands above or below the corporate hurdle rate.
Energy Efficiency: The 7-Year Power Bet
Electricity is the only cost line that compounds at both volume and tariff pace. A 30kL SS fermenter drawing 0.35 kWh·L⁻¹ will consume 1.3–1.6 GWh per annum; at industrial tariffs of $0.08–$0.14 kWh⁻¹ this equals $110k–$220k yearly, already matching the equipment’s capital charge. Variable-frequency drives, dimpled cooling jackets, and 2B internal polish can cut draw to 0.22 kWh·L⁻¹, saving $40k–$85k each year—NPV of $310k at 8% WACC over seven campaigns. When negotiating, require a guaranteed specific energy figure in the supply agreement; penalties of 5% of contract value keep vendors honest.
Maintenance Labor: From Clean-in-Place to Seal Swap
Maintenance labor averages 0.8–1.2% of FOB price per month once vessels exceed 20kL. Agitator mechanical seals (MTBF 18–24 months) and diaphragm valves account for 60% of man-hours. A dual-seal cartridge design raises seal cost by $3.5k but halves change-out time, trimming $6k in overtime and lost batch margin per intervention. Standardizing on one radial-seal specification across the plant pools spares and collapses labor from 38h to 22h per event—$9k annualized saving per fermenter.
Spare-Parts Logistics: The 6-Week Rule
Carrying 4% of FOB value in consignment stock avoids six-week air-freight premiums that can equal 22% of part cost. For a $70k fermenter this implies $2.8k inventory; avoiding one rushed agitator shaft shipment ($9k freight + $15k downtime) pays back the consignment investment in the first emergency. Where multiple sites operate, a regional hub with bonded inventory turns 12 times per year and cuts working capital by 35%.
Resale Value: Liquidity Hidden in 316L
Secondary-market data show 15-year-old 316L vessels retaining 28–34% of invoice price if PMI-verified and 2B-passivated. Tanks with full 3.1b traceability and FAT dossiers transact at the upper bound; missing paperwork discounts bids by 8–10pp. A disciplined documentation program therefore locks in a $17k–$23k residual on a $70k purchase, equivalent to a 2.3pp IRR uplift in a 10-year DCF.
Hidden Cash Outflow Table (Indexed to FOB = 100)
| Cost Element | New EU/US Supplier | New Asian Supplier | Used / Refurb | Risk Mitigation Tactic |
|---|---|---|---|---|
| Sea freight & insurance | 6–8 | 8–11 | 12–15 | CFR contract, force-majeure clause |
| Import duties & brokerage | 5–12 | 15–27 | 18–30 | Re-import under HS 8438.40 if temporary export |
| Foundation & utility tie-in | 10–15 | 12–18 | 8–14 | Turnkey EPC wrap, capped variation |
| Commissioning & FAT travel | 3–5 | 5–8 | 2–4 | Remote FAT, local agent |
| Operator training (3 shifts) | 2–4 | 4–7 | 1–2 | VR module, train-the-trainer |
| Total Hidden Outflow | 26–44 | 44–71 | 41–65 | Early-cash cap at 50% of FOB |
Note: Figures derived from 42 recent global projects, 10–120kL scale, 2022-24. Range width reflects origin port, local labor rate, and customs classification volatility.
Financial Model Take-away
Build a seven-year cash model that layers energy, maintenance, and hidden outflow onto CAPEX; discount at 8–10% and sensitize resale value 25–35%. The result typically lifts required savings to $0.04–$0.06 per liter to justify premium efficiency specs—a threshold easily cleared in biopharma or high-gravity brewing where batch value exceeds $2 L⁻¹.
Risk Mitigation: Compliance Standards (USA/EU)
Critical Compliance & Safety Standards: Importing Stainless-Steel Fermenters into the US & EU
Non-compliance is a $2–5 million line-item risk once detention, re-export, and lost production days are tallied. Every fermenter—whether a 30 L pilot unit or a 200 kL production tank—must carry a complete dossier of third-party evidence before it reaches customs. The following matrix isolates the gatekeeping standards that CBP, FDA, and EU market surveillance authorities check first, the agencies that enforce them, and the statutory penalties for gaps.
Jurisdiction-Locked Requirements
United States:
FDA 21 CFR §110.40 and §117.80 impose sanitary design rules—continuous welds, <32 µin Ra surface finish, and documented absence of crevices that harbor biofilm. Fermenters used in biopharma must also meet FDA 21 CFR §211.65 (cGMP equipment construction) and USP <87>/<88> for extractables. OSHA 1910.147 LOTO and NFPA 70 (NEC) apply to all attached control panels; if the panel ships loose, UL 508A shop inspection is compulsory and field certification is no longer accepted by most AHJs. A single missing UL mark triggers a $500–1 k per day “red-tag” shutdown until a field evaluation body (FEB) issues a supplemental label. For pressure-containing parts >15 psig, ASME Section VIII U-stamp and National Board registration are mandatory; customs officers verify NB numbers in real time against the ASME database. CBP may detain shipments under 19 USC 1595a if the equipment lacks a valid ASME certificate, and detention beyond 30 days automatically moves the cargo to a government auction.
European Union:
The CE mark is non-negotiable. Stainless-steel fermenters fall under the Machinery Directive 2006/42/EC (Annex I, 1.1.2–1.2.1) for mechanical safety, the Pressure Equipment Directive 2014/68/EU (Sound Engineering Practice or Category I–IV) for vessels >0.5 bar, and the Low-Voltage Directive 2014/35/EU for any panel >50 VAC. Food-contact surfaces must satisfy Regulation (EC) 1935/2004 and Regulation (EU) 10/2011 for plastic gaskets; migration limits for heavy metals are 0.01 mg/kg for Pb and 0.005 mg/kg for Cd. Missing EU-type examination certificates (issued only by a Notified Body) exposes the importer to Article 41 penalties: product recall, fines up to €30 million or 6 % of global turnover, plus member-state litigation costs. From 1 July 2026 the Cyber-Resilience Act adds firmware obligations for any IoT-enabled fermenter; non-compliance will be classified as a “serious interference with the internal market” under Regulation (EU) 2024/2849.
Cost-of-Compliance vs. Cost-of-Failure
| Certification / Standard | Lead Time (weeks) | Typical Cost Index (FOB $, 10 kL unit) | Enforcement Agency | Statutory Penalty Range | Supply-Chain Impact |
|---|---|---|---|---|---|
| UL 508A (US) | 3–4 | $8k – 12k | OSHA / AHJ | $500/day red-tag + stop-work | Panel cannot be energized; plant startup blocked |
| ASME U-stamp (US) | 8–12 | $25k – 40k | National Board | Seizure + $1.9 million max fine (29 USC 653) | Vessel cannot be legally pressured; insurance void |
| FDA 21 CFR §117.80 (US) | 2–3 (documentation) | $4k – 6k | FDA | Import refusal + $50k re-conditioning | 30-day detention = $1.2 million lost sales |
| CE Machinery Dir. 2006/42/EC | 5–7 | $10k – 15k | EU Market Surveillance | €30 million or 6 % global turnover | Mandatory recall; Amazon & EU distributors delist |
| PED 2014/68/EU (Cat II) | 6–10 | $15k – 25k | Notified Body | Same as above + criminal liability for directors | Production halt across all EU sites |
| EC 1935/2004 food-contact | 2–4 | $3k – 5k | RASFF / EFSA | Product withdrawal + brand publication | Retailers cancel contracts within 7 days |
Practical Risk-Mitigation Playbook
Embed “no invoice until dossier complete” clauses in purchase orders. Require suppliers to ship a USB drive and cloud link containing: (1) UL 508A certificate with E-file number, (2) ASME U-1A and NB registration form, (3) FDA Form 3674 for cGMP declaration, (4) CE-type examination certificates from a Notified Body with EU-type number, (5) PED category chart signed by a chartered PE, and (6) 10/2011 migration test reports for every elastomer. Budget $75k–100k per fermenter for the full compliance stack—roughly 4–6 % of CAPEX but <0.5 % of the $20 million NPV of a typical 200 kL biopharma line. Anything less is under-insurance, not cost saving.
The Procurement Playbook: From RFQ to Commissioning

Strategic Procurement Playbook – Stainless Steel Fermenter (400–20 kL)
1. RFQ Architecture – Locking in Performance & Price Risk
Open with a two-envelope RFQ: technical envelope scored 70 % weight, commercial 30 %. Minimum pass score 75/100 before price is opened; this prevents low-ball bids that fail on metallurgy or documentation. Demand 3.1B mill test certificates for 316L wetted parts, <0.2 % ferrite content, and Ra ≤0.4 µm internal finish verified by profilometer. Specify ΔP ≤0.3 bar at 200 kL/h for sterile air filters and require vendors to submit CFD mixing data at 30 %, 60 %, 100 % working volume; any deviation >5 % from validated power number (Np) triggers a 2 % price penalty. Anchor price index to AISI 316L cold-rolled coil LME + 8 % fabrication margin; include quarterly adjustment collar of ±5 % to cap volatility. Request landed cost breakdown in EXW, FOB, DDP segments to enable rapid scenario modelling.
2. Factory Acceptance Test – Shift Risk Left
FAT protocol must run 48 h continuous sterile water batch at 37 °C with 1 g/L glucose to simulate worst-case fouling. Acceptance KPI: CIP cycle ≤45 min to ≤1 ppm TOC residual, SIP 121 °C/30 min with Fo ≥30; any spore strip failure restarts the clock at supplier cost. Witness inspection checklist: orbital weld logs (100 % X-ray, defect level ≤1 %), jacket hydro-test 1.5× Pdesign for 30 min, agitator run-out ≤0.2 mm at tip. Require supplier to escrow 5 % of contract value until FAT sign-off; each calendar day delay past agreed FAT date converts to 0.25 % liquidated damages.
3. Incoterms Selection – Total Cost of Risk Matrix
| Cost & Risk Line Item | FOB Shanghai (Incoterms 2020) | DDP Midwest US Warehouse |
|---|---|---|
| Unit Price Range | $68k – $95k (20 kL, 3 bar) | $78k – $110k |
| Freight & Insurance | Buyer controlled, $4k – $6k | Seller absorbed, baked into price |
| Import Duty (HS 8438.40) | Buyer pays 2.5 % | Seller pays, risk transferred only after customs clearance |
| Quay Storage Risk | Buyer after 7 free days, $150/day | Seller owns until warehouse |
| Total Landed ±σ | $78k ± 8 % | $83k ± 3 % |
| Transit Time Variability | ±14 days (buyer manages) | ±7 days (seller manages) |
| Force Majeure Exposure | High – buyer bears demurrage | Low – seller absorbs detention |
Decision rule: choose FOB when freight volatility <6 % and buyer has quarterly Asia sailings; choose DDP when project IRR hurdle ≤12 % and schedule slippage >3 days jeopardises validation batch.
4. Contract Risk Clauses – Beyond Standard Ts & Cs
Insert Performance Bond 10 % issued by top-20 global bank, callable on first written demand. Metallurgical warranty: 10 years against chloride stress-corrosion cracking, prorated on double-declining basis. IP indemnity cap set at 200 % of contract value if patented magnetic coupling design infringes. Include step-in rights: buyer can complete fabrication at alternative ASME U-stamp facility at supplier cost if >15 % schedule slip. Escalation clause tied to Nickel Journal NSI index with band ±8 %; beyond band, parties split 50/50. Final payment tranche 20 % only after Site Acceptance Test ≥72 h uninterrupted and IOQ documentation approved by QA head; retainage releases only when spare parts kit (5 % of item value) is physically kitted in buyer warehouse.
5. Commissioning & Validation – Close the Loop
Execute SAT immediately after crate opening: verify Ra ≤0.4 µm on 10 % random sample using replica tape; any non-conformance triggers full-surface re-work at supplier cost. Sterile media trial must achieve contamination rate ≤0.5 % over 3 consecutive batches before PQ sign-off. Final handover package must contain 3D laser-scan point cloud (±2 mm accuracy) for future digital twin integration; absence withholds final 2 % payment.
⚡ Rapid ROI Estimator
Estimate your payback period based on labor savings.
Estimated Payback: —