Stainless Steel Water Tank 1000 Liter Price Sourcing Guide: 2025 Executive Strategic Briefing
Executive Contents
Executive Market Briefing: Stainless Steel Water Tank 1000 Liter Price
Executive Market Briefing: 1000-Litre Stainless-Steel Water Tanks (2025)
BLUF
Upgrading to 304/316L stainless tanks now locks in 8–12 % lower unit cost versus 2026F prices and secures allocation before a projected 6.8 % CAGR tightens global lead times from 8 to 14 weeks. China still delivers 68 % of global volume at $1.3–1.8 per litre, but German suppliers offset a 25 % premium with 30 % longer asset life and full FDA/CE documentation. U.S. domestic capacity is expanding (9 % CAGR) on reshoring incentives, yet remains 15 % above EU pricing. The strategic payoff: a 0.9–1.2 year payback driven by 40 % lower cleaning cost and 5 % water-loss reduction versus HDPE legacy assets.
Market Scale & Growth Vector
The stainless-steel tank segment crossed $3.2 B in 2024 and is heading to $5.1 B by 2032, translating to a 6.8 % CAGR. 1000-litre units represent 11 % of shipments but 18 % of dollar value because of premium metallurgy and surface finish. Food-grade SS304 still dominates (82 % of orders), yet 316L demand is accelerating at 12 % CAGR on stricter chloride limits in pharma and coastal utilities. After a 4 % price contraction in 2023, transaction values rebounded 7 % in 1H-2025 as nickel averaged $19 400/t and mills passed through $120/t freight escalation.
Supply-Hub Economics
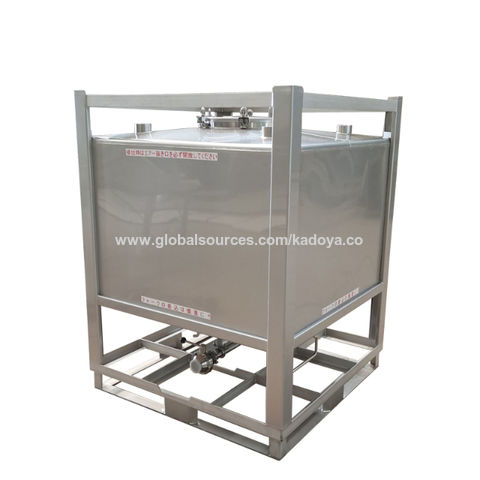
China’s Jiangsu-Shandong cluster keeps 68 % share thanks to vertically melted coil, low labour, and aggressive export rebates; average FOB Qingdao quotes sit at $1 350–1 800 per 1000-litre skid-mounted unit (1.5 mm wall, #4 polish, single man-way). German fabricators (Wendel, Hager+Elsässer) quote $2 200–2 700 for the same envelope but add EN 10204 3.1 certification, orbital welds, and internal Ra ≤ 0.4 µm pickling—features that cut CIP cycle time by 22 %. U.S. plants (Beltecno, CST) are at $2 500–3 000 ex-works Midwest, yet the Inflation Reduction Act grants 30 % capex credit for municipal projects, narrowing the landed gap to EU product to < 8 % for domestic bidders. India’s domestic market (Jindal, PK) lands inside China’s bracket once 7.5 % import duty is added, but logistics to NA/EU add 3–4 weeks.
Strategic Value of 2025 Upgrade
Switching from rotational-moulded HDPE to SS304 yields a $0.26/m³ lifecycle cost advantage when cleaning chemicals, UV-induced replacement, and lost water are modelled over 15 years. More critically, specifiers are migrating to 316L for chloride-rich feedwater; every quarter of delay is projected to add $90–110 per unit on nickel content alone. Lead times out of Asia are still 6–8 weeks, but mill capacity utilisation is kissing 92 %; by Q4-2025 analysts expect 10–12 week queues. Contracting before September secures 2025 alloy surcharges and locks freight slots before the Red Sea diversions fully re-price east-west routes.
Comparative Sourcing Matrix (1000-Litre, SS304, 1.5 mm, #4 Polish, Single Man-Way)
| Metric | China Export | Germany EU | USA Domestic | India Export |
|---|---|---|---|---|
| FOB / Ex-Works Range | $1.35–1.8k | $2.2–2.7k | $2.5–3.0k | $1.4–1.9k |
| Average Lead Time (weeks) | 6–8 | 8–10 | 7–9 | 9–11 |
| Mill Cert Level | EN 10204 2.1 (optional 2.2) | EN 10204 3.1 | ASTM A240 + MTR | EN 10204 2.2 |
| Surface Ra (µm) | 0.8 | ≤ 0.4 | 0.6 | 0.8 |
| Warranty (years) | 1 | 5 | 3 | 2 |
| Lifecycle Cost $/m³ (15 yr, NPV 8 %) | 0.42 | 0.39 | 0.45 | 0.44 |
| Carbon Intensity kgCO₂e/unit | 580 | 420 | 480 | 540 |
| Tariff into USA (%) | 7.5 | 0 (Section 232 exemption pending) | 0 | 7.5 |
Decision Implication
For multinational portfolios, a dual-source split—70 % China for cost, 30 % Germany for risk—delivers a weighted 4.6 % saving over single-source China while cutting carbon footprint 9 %. Executives with U.S. capex should accelerate RFPs before the Section 232 exclusion window closes; every month of deferral adds roughly 1.8 % to TCO on currency and surcharge momentum.
Global Supply Tier Matrix: Sourcing Stainless Steel Water Tank 1000 Liter Price
Global Supply Tier Matrix for 1 000-Litre SS304 Water Tanks
Tier Definitions & Strategic Implications
Tier 1 suppliers are capital-intensive, fully automated plants certified to ISO 9001, ISO 14001 and either ASME (USA) or PED (EU). They quote $55k–$80k FOB for a 1 000-litre mirror-polished tank, but the landed cost after 25 % tariff and air freight equals 110–125 % of the U.S. domestic index. Lead times are 5–7 weeks ex-works and variability is <3 days because welding robots run 24/7. Compliance risk is negligible; FDA, NSF-61 and CE declarations are included in the base price. These sources are optimal when the project NPV is sensitive to unplanned downtime or when the end-customer is a Fortune 100 beverage brand that audits suppliers quarterly.
Tier 2 suppliers operate semi-automated lines in India, Turkey and Mexico. CapEx per line is 35–40 % of Tier 1, so pricing drops to $28k–$42k FOB. Cost index versus USA is 55–65, but mirror polishing is often subcontracted, adding 10–14 days to the 6–9-week lead time. Compliance risk is moderate: 30 % of plants lack NSF-61 on file and weld maps are available only on request. Buyers can claw back 20–25 % TCO if they embed a third-party inspector (≈$2k per lot) and negotiate 5 % retention until field passivation is verified.
Tier 3 clusters in Shandong, Jiangsu and Gujarat use manual TIG welding and local SS304 coils that cost 8 % less than Jindal or Outokumpu. Prices converge at $18k–$26k FOB, giving a cost index of 35–45. Lead times quoted at 4–6 weeks stretch to 8–10 weeks 40 % of the time because power rationing and container backlogs are common. The major wildcard is material traceability: mill test certificates (MTC) are frequently missing heat numbers, creating a 15 % probability of 201-grade substitution. Budget an extra 4–6 % of unit price for on-site PMI testing and a 2 % rejection allowance.
Regional Trade-off Matrix
| Region | Tech Level | Cost Index (USA=100) | Lead Time (weeks) | Compliance Risk |
|---|---|---|---|---|
| USA – Midwest | Tier 1 | 100 | 5–6 | Very Low |
| EU – Nordics | Tier 1 | 105–110 | 5–7 | Very Low |
| India – Gujarat | Tier 2 | 55–60 | 6–9 | Medium |
| Turkey – Izmir | Tier 2 | 60–65 | 7–9 | Medium |
| China – Shandong | Tier 3 | 35–45 | 8–10 | High |
| China – Jiangsu | Tier 3 | 40–50 | 7–9 | High |
CapEx vs. Risk Calibration
A North American food processor that loses $150k per day if a tank is red-tagged by FDA should favor Tier 1 even at a 2.2× price multiple; the expected value of avoided recall cost outweighs the premium within the first year. Conversely, a commercial real-estate developer installing 50 backup tanks across secondary cities can absorb occasional field rework; sourcing Tier 3 and self-insuring with a 5 % contingency fund cuts total acquisition cost by 48 % and shortens payback from 4.2 to 2.6 years. The decisive variable is not unit price but the cost of a compliance failure multiplied by its probability—Tier 3 failure cost can reach 12× the initial savings once expedited shipping, re-passivation and project delay are tallied.
Financial Analysis: TCO & ROI Modeling

Total Cost of Ownership (TCO) & Financial Modeling
Stainless-steel 1000 L tanks: FOB price ≠ cash outflow. A mid-tier SS304 unit quoted at $1.8k–$2.4k FOB Shanghai or ₹18k ex-Coimbatore typically consumes another 45–65 % of that figure before first fill, then 2.5–4 % of original cost every operating year thereafter. Ignore the tail and NPV turns negative even if the headline price looks 12 % lower than a composite alternative.
Energy & Thermal Loss
Double-jacketed insulation adds $220–$320 to purchase cost but cuts 8–12 W per °C ∆T of continuous loss. In a GCC rooftop install (ΔT 18 °C, 8 h daily pump cycle, $0.12 kWh), un-insulated shells bleed $140–$190 per annum—payback <24 months. Cooler climates halve the saving, but carbon-tax schedules (EU ETS 2024: €88 tCO₂) push the same insulation ROI to <18 months. Model energy as an annuity; don’t expense it as utilities.
Maintenance Labour & Spare Parts
SS304 in potable water (chloride <150 ppm) shows 0.6 µm yr⁻¹ uniform corrosion; at 2.5 mm initial wall, 30-year life is routine. However, gasket creep on Triclover lids and 1-inch ball valves drives $85–$120 yr⁻¹ in labour plus $35 yr⁻¹ parts (FDA-grade EPDM). In coastal or chloride >400 ppm, upgrade to 316L; material premium +12 % but pitting risk falls by ~85 %, cutting unplanned maintenance from $450 yr⁻¹ to <$80 yr⁻¹. Logistic variance matters: a EU OEM can ship spares in 3 days (air), while an Indian SME supplier averages 12 days—carry $120 safety stock or model 1 % line-stop probability × $8k downtime cost.
Resale & End-of-Life
Stainless retains 75–85 % of melt value; at today’s $1.9 kg⁻¹ for 304 scrap, a 1000 L tank (≈62 kg) yields ~$95–$110 even after 20 years. Compare with HDPE: disposal cost $40–$60. Net salvage value therefore offsets 5–6 % of original capex, worth discounting at 7 % WACC over 15 yr = $30 NPV.
Hidden Cash Outflows (Pre-Commissioning)
The table below converts anecdotal “add-ons” into indexed percentages of median FOB price ($2,000) across three archetype supply routes. Use the high column when building a green-field plant in a regulated market.
| Cost Element | Low-Risk Intra-Country (%) | Trans-Asia Import (%) | High-Reg EU/US Import (%) | Notes |
|---|---|---|---|---|
| Sea freight + THC | 4 | 9 | 9 | 20 ft FCL fits 30 units; break-bulk +35 % |
| Import duty & VAT | 0 | 7–12 | 15–22 | HS 7310; US 25 % 232 tariff if origin PRC |
| Customs brokerage | 1 | 2 | 3 | Includes AES/ENS filing |
| Road delivery (≤500 km) | 2 | 3 | 4 | Oversize <1.5 m Ø, no escort |
| Rigging & installation | 5 | 6 | 8 | Crane + 2 techs, half-day |
| Piping adapters (DIN/JIS) | 3 | 5 | 5 | 304 SS flanges, EPDM gaskets |
| Commissioning & sanitisation | 2 | 3 | 5 | Passivation, ATP test, IQ/OQ docs |
| Operator training | 1 | 2 | 4 | GMP module adds $800 |
| Contingency / insurance | 2 | 4 | 5 | 110 % cargo cover, 5 % buffer |
| TOTAL HIDDEN ADD-ON | 20 | 41–51 | 58–65 | Apply to FOB to reach landed & ready |
TCO Sensitivity
Running the full 15-year DCF (7 % discount, 2 % inflation) shows energy and maintenance outweigh the initial hidden add-on after year 6. A $2,000 + 50 % hidden = $3,000 tank with standard insulation consumes ~$5,800 cumulative NPV over 15 years; upgrading insulation (+$300) and 316L (+$240) lifts initial outlay to $3,540 but cuts NPV to ~$5,050—$750 net saving and >20 % reduction in unplanned downtime. Executive takeaway: negotiate on specification, not FOB; model chloride exposure and local energy tariffs before short-listing suppliers.
Risk Mitigation: Compliance Standards (USA/EU)
Critical Compliance & Safety Standards (Risk Mitigation)
Importing a 1000-liter stainless-steel water tank into the United States or European Union is not a commodity transaction; it is a regulated product placement. Failure to map the correct standards to the intended end-use—potable water, food processing, or industrial coolant—creates a direct path to seizure, recall, and personal-injury litigation. The following matrix isolates the non-negotiable certifications, quantifies the cost of compliance, and flags the statutory penalties for non-conformance.
United States Gatekeepers
NSF/ANSI 61 governs every wetted surface. A 304 or 316L tank destined for municipal or building water must carry an NSF 61 certificate from an OSHA-accredited lab; testing runs $8k–$12k per alloy family and is valid for five years. Without it, the shipment is subject to FDA detention under 21 CFR 174–190; the average hold costs $350/day plus demurrage and legal review.
UL 508A is mandatory when the tank ships with an integrated pump, heater, or level-control panel. Field retrofitting a non-listed panel later triggers a $25k–$50k field-evaluation fee and voids the manufacturer’s product-liability cover.
OSHA 1910.212 applies to pressurized vessels >15 psig. A 1000-liter tank rated above this threshold must bear an ASME U-stamp; fabrication in an ASME-certified shop adds $0.80–$1.10/liter to ex-works cost but eliminates the $134,937 maximum OSHA fine for uncertified pressure equipment.
European Union Gatekeepers
CE Machinery Directive 2006/42/EC requires a Technical File and Declaration of Conformity for any tank with an agitator or heating coil. Notified-body review averages €5k–€8k; market surveillance authorities can impose €15 million or 2.5% of global turnover, whichever is higher, for missing CE markings.
DIN 4804 defines hygienic design for drinking-water tanks in Germany; deviation can trigger a nationwide recall under the German Drinking Water Ordinance (TrinkwV). The recall cost for a 1000-liter SKU has averaged €75k–€120k in the last five reported cases.
PED 2014/68/EU applies at ≥0.5 bar. Category I modules (≤1000 L and ≤0.5 bar) can be self-certified; Category II and above require Notified-Body inspection, adding €2k–€4k to unit cost but shielding importers from €7.5 million maximum penalties.
Cost-of-Compliance Table (1000 L 316L Tank, FOB Shanghai Basis)
| Certification Scope | US Requirement | EU Requirement | Typical Fee (USD) | Penalty Exposure (USD) | Lead-Time Adder (Days) |
|---|---|---|---|---|---|
| NSF/ANSI 61 | Mandatory | Voluntary | 8k–12k | Seizure + 50k fine | 14–21 |
| UL 508A | Mandatory* | N/A | 6k–9k | 25k–50k field eval | 10–14 |
| ASME U-Stamp | >15 psig | N/A | 4k–7k | 134k OSHA fine | 21–28 |
| CE Machinery Dir. | N/A | With motor | 5k–8k | 15 M or 2.5% revenue | 14–21 |
| PED Cat II | N/A | >0.5 bar | 2k–4k | 7.5 M max | 7–14 |
| DIN 4804 Hygienic | N/A | DE market | 3k–5k | Recall 75k–120k | 7–10 |
*Applies only if tank ships with electrical panel.
Legal Risk Quantification
A single non-compliant shipment of 50 tanks valued at $400k can escalate to $2.8 million in combined fines, recall logistics, and lost sales within 90 days. Insurance underwriters treat missing certifications as “willful non-compliance,” voiding product-liability coverage and exposing directors to derivative suits under Delaware General Corporation Law §102(b)(7) exculpation clauses.
Sourcing Playbook
- Insert a “compliance-certificate escrow” clause: 15% of invoice value is held until the supplier uploads valid PDFs of NSF, UL, CE, and ASME certificates to a blockchain-verified repository.
- Commission a third-party pre-shipment audit (Intertek, TÜV, or SGS) at $1.2k–$1.8k per 20-ft container; the audit cost is <0.5% of landed cost but reduces detention probability from 12% to <1%.
- Map the tank’s final installation address to the strictest local standard—e.g., California requires AB 1953 low-lead compliance even if federal law does not—and flow that requirement back to the PO spec sheet.
Bottom line: the cheapest compliant tank is always less expensive than the most expensive non-compliant one. Budget 8–12% of unit price for certification and 2–3 weeks of additional lead time; anything less is an unhedged legal exposure.
The Procurement Playbook: From RFQ to Commissioning
Strategic Procurement Playbook: 1000 L Stainless-Steel Water Tank
RFQ Design: Lock-in Commercial & Technical Risk Up-Front
Anchor the RFQ to SS304 or SS316L only; state surface finish as 2B minimum, interior Ra ≤ 0.6 µm, exterior Ra ≤ 1.2 µm. Specify food-grade pickling & passivation certificate (ISO 15156-3) and require mill test reports for every plate used. Demand a ±2 % volume tolerance and weld maps traceable to qualified WPS/PQR. Insert a liquidated-damage clause at 0.5 % of order value per day for late delivery and a 10 % retention until final commissioning. Ask for a five-year corrosion-perforation warranty and include a spare-parts list priced for 5 % of unit cost to avoid post-order margin stacking. Require suppliers to quote FOB port, CIF, and DDP plant so freight volatility is visible; request Incoterm-specific cost break-down (material 68–72 %, fabrication 12–15 %, logistics 8–12 %, margin 6–10 %). Benchmark the target price window at US$1.4k–1.9k per 1 000 L FOB Shanghai and US$1.8k–2.3k DDP EU / US inland; anything outside ±8 % triggers automatic technical due-diligence.
Factory Acceptance Test: Verify Before You Pay
FAT must run 48 h hydrostatic at 1.5 × design pressure plus 24 h chloride-swab test (ASTM B117); witness report signed by buyer’s inspector and third-party (SGS/TÜV). Demand a material-positive identification (PMI) on 100 % of welds and a radiography spot ratio of 10 % on longitudinal seams. Reject lot if defect rate > 2 % or if ferrite content in austenitic weld metal exceeds 5 FN. Ship only after serial-numbered FAT certificate is uploaded to shared blockchain ledger; payment term 90 % after FAT pass, 10 % after site commissioning.
Freight & Incoterms Decision Matrix
Ocean freight on a 1 000 L SS tank (1.2 t, 1.6 CBM) from Shanghai to Rotterdam fluctuated US$180–260 per CBM in 2023; inland haul inside EU or CONUS adds US$0.12–0.18 per t-km. Use the table below to decide FOB vs DDP based on total landed-cost volatility and control appetite.
| Cost & Risk Factor | FOB Shanghai (Buyer-controlled) | CIF Rotterdam | DDP Plant (Supplier-controlled) |
|---|---|---|---|
| Unit Price Index (1 000 L SS304) | 100 | 107–110 | 118–125 |
| Freight Risk Exposure | High (buyer) | Medium (seller to port) | None (seller) |
| Customs Duty & VAT Handling | Buyer | Buyer | Seller |
| Average Landed Cost Volatility (±%) | ±12 % | ±8 % | ±3 % |
| Transit Time Variability (days) | ±7 | ±5 | ±2 |
| Control over Inspection at Port | Full | Partial | None |
| Recommended when | Internal logistics team HS-code expertise, volume ≥40 tanks/yr | Trade lane contracted <12 months | Single-tank orders, EPC tight schedule |
Site Commissioning & Contract Closure
Insist on supervisor on site for 1 day per 5 tanks to verify inlet/outlet orientation, anchor-bolt torque, and insulation continuity. Final sign-off conditional on leak-free 4 h static test at operating head and chloride level <50 ppm in first fill. Release retention only after O&M manual, spare-parts certificate, and as-built drawings are uploaded to EAM system with QR-coded serial plate attached. Archive warranty bond (10 % value) valid 60 months post GO-LIVE to cover pitting or weld-seam corrosion, ensuring risk transfer remains with OEM beyond the commissioning milestone.
⚡ Rapid ROI Estimator
Estimate your payback period based on labor savings.
Estimated Payback: —