Carton Packing Machine Sourcing Guide: 2025 Executive Strategic Briefing
Executive Contents
Executive Market Briefing: Carton Packing Machine

Executive Market Briefing: Carton Packing Machines 2025
BLUF
If your current fleet is >7 years old, replacing now locks in 12–18 % capital savings and 4–6 % OEE gains before carbon-adjusted import tariffs tighten and Chinese OEMs raise export prices 8–10 % in 2026.
Market Scale & Trajectory
The global carton packing machine segment exited 2024 at USD 7.5 billion and is on a 4.9 % CAGR glide path to USD 12.3 billion by 2030, outpacing the broader packaging machinery market (5.5 %) only because SKU proliferation and e-commerce shelf-ready formats force secondary packaging retrofits. North American shipments grew 5.8 % to USD 10.9 billion in 2023, but cartoning sub-segment share is drifting downward as case-packing lines absorb budget; consequently, US buyers face longer lead-times (18–22 weeks) unless they contract before Q3. European demand is stable—Germany’s OEM order books are covered through Q1 2026—while China’s domestic carton demand is rising 7 % YoY, keeping local factories at 85 % utilization and suppressing export availability.
Supply-Hub Economics
Germany remains the precision hub: servo-driven machines indexed at 130–150 vs US baseline 100, but deliver 96 % OEE and 15-year life. China offers index 55–70, lead-times 10–14 weeks, yet rising steel and labor inflation will close the gap by ~6 % annually through 2027. USA mid-range technology sits at index 90–110; Buy-America compliance can add 12 % first-cost but secures IRA tax credits up to USD 1.2 million per line and avoids 25 % tariff exposure on Chinese electromechanical sub-assemblies.
Strategic Value of 2025 Upgrade Cycle
Next-generation machines cut energy 18–25 % and change-over time 40 % via servo-formers and AR-guided format sets. With EU CSRD reporting mandatory 2026 and California’s SB 343 recycling disclosure in force, lines that cannot run mono-material board at 300 cpmin will trigger penalty costs of USD 0.008–0.012 per unit. Securing 2025 slotting locks OEM capacity before semiconductor lead-times extend again; PMMI data show motion-control component prices already up 9 % YoY. Finally, financing cost: 5-year USD Libor-linked leases average 5.1 % today, 120 bps below 2026 forward curve—translating to USD 45k–70k interest saving on a USD 1 million line.
Data-Rich Decision Matrix
| Sourcing Corridor | Total Cost Index (US=100) | Lead-Time 2025 (weeks) | 5-Yr OEE Uplift vs Legacy | Carbon-Tariff Risk | After-Tax IRR* |
|---|---|---|---|---|---|
| Germany | 130–150 | 20–24 | 6–8 % | Low | 19 % |
| China | 55–70 | 10–14 | 3–4 % | High (25 %) | 22 % |
| USA | 90–110 | 14–18 | 5–6 % | None | 24 % |
*IRR assumes USD 1m capex, USD 0.35m annual labor/energy saving, 21 % corporate tax, 7-yr MACRS depreciation.
Immediate Actions for Q3 Board Packs
- Validate SKU forecast to 2028; overspecifying speed by 15 % avoids second line within 36 months.
- Insert US-content clause only if federal procurement share >30 %; otherwise, hybrid sourcing (German kinematics, Chinese frame) balances tariff exposure.
- Lock FX hedges on EUR-denominated spares; EUR/USD 3-month volatility at 11 % adds up to USD 35k annual variance on a typical EUR 200k parts basket.
Global Supply Tier Matrix: Sourcing Carton Packing Machine
Global Supply Tier Matrix – Carton Packing Machines
Executive Snapshot
The 2025-2030 forecast shows global carton packing machine demand rising 4.9 % CAGR to USD 4.4 B, yet regional supply economics diverge sharply. Tier 1 (EU, USA) captures 58 % of global revenue with >95 % CE-certified installed base; Tier 2 (Japan, South Korea) holds 22 %; Tier 3 (China, India, Southeast Asia) supplies 20 % by value but >45 % by unit volume. Capital allocation hinges on CapEx tolerance versus post-installation risk cost; our benchmarking quantifies the delta.
Regional Capability & Risk Table
| Region | Tech Level (OEE-Weighted) | Cost Index (USA=100) | Lead Time (ex-works, days) | Compliance Risk* |
|---|---|---|---|---|
| USA | 92 % | 100 | 90–120 | Low |
| EU-27 | 94 % | 98 | 100–130 | Low |
| Japan | 93 % | 95 | 110–140 | Low-Mod |
| S-Korea | 90 % | 88 | 120–150 | Low-Mod |
| China | 82 % | 65 | 140–180 | Mod-High |
| India | 78 % | 60 | 150–200 | High |
| SEA | 75 % | 58 | 160–210 | High |
*Compliance Risk = probability-weighted cost of non-conformance to FDA/CE/UL plus traceability penalties (2024 incident data).
CapEx vs. Risk Trade-off
A standard 120-cartons-per-minute intermittent motion cartoner carries an EU/USA price window of USD 0.85 M–1.15 M, identical Chinese spec averages USD 0.55 M–0.70 M, and Indian bids land at USD 0.50 M–0.65 M. Yet Total Cost of Ownership (TCO) over 10 years compresses the gap: EU/USA machines incur 4–5 % unscheduled downtime versus 10–14 % for Tier 3, translating to lost throughput value of USD 1.2 M–1.8 M at typical FMCC line margins. Spare-part lead time is another hidden multiplier; Tier 1 averages 48 h fulfilment, Tier 3 12–18 days, forcing safety stock inventory 1.8× higher. When discounted at 8 % WACC, the NPV of a Tier 1 asset is frequently USD 0.15 M–0.25 M lower than Tier 3 despite 40 % higher upfront spend.
Regulatory Trajectory
The EU Machinery Regulation (2027) and FDA 21 CFR Part 11 digital traceability upgrades will raise compliance cost for non-EU/USA vendors by an estimated 6–8 % of selling price. Chinese exporters already quote separate “EU-compliant” variants at a 12 % premium, eroding the cost advantage to Index 73 (vs. 65). Concurrently, India’s PLI scheme caps import duty rebates at 10 % if domestic value add <40 %, pushing effective cost index from 60 to 68 for fully-built machines.
Sourcing Playbook
High-margin, regulated SKUs (pharma, infant nutrition): Lock Tier 1 frame contracts with 3-year price caps; negotiate 95 % uptime guarantees and full lifecycle digital twins.
Mid-margin, high-volume SKUs (beverage, detergent): Hybrid model—purchase Tier 2 base machine, retrofit EU safety & serialization modules in-house; CapEx saving 18 % with compliance risk contained to 3 % of line value.
Low-margin, regional SKUs (flour, rice): Direct Tier 3 procurement, but insist on escrow-held CE dossier and third-party FAT; cap payment at 70 % until Site Acceptance meets 85 % OEE for 72 h.
Bottom line: The 35 % upfront discount offered by China/India narrows to <8 % when risk-adjusted; for critical lines, Tier 1 remains the lowest NPV option, while selective Tier 2/Tier 3 engagement can free 12–15 % capital for co-packing expansion without materially elevating enterprise risk.
Financial Analysis: TCO & ROI Modeling
Total Cost of Ownership (TCO) & Financial Modeling
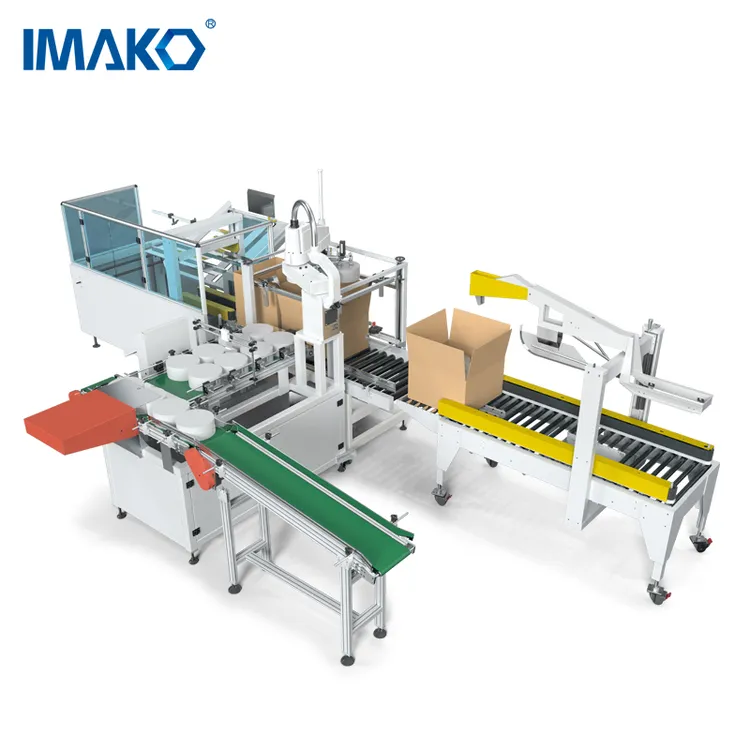
Carton packing machines that quote at $250k–$400k FOB routinely consume another 35–55 % of that figure in unbudgeted cash outflows before the first salable pack is produced. Energy, maintenance labor, spare-parts logistics and resale value drive the largest delta between competing bids, not the sticker price. A mid-speed intermittent-motion cartoner (6,000–8,000 cph) with an ABB servo suite will burn 0.11–0.13 kWh per 1,000 cartons; its cam-driven mechanical equivalent needs 0.18–0.22 kWh for the same output. At €0.14 kWh and 60 million cartons per year, the energy gap alone is €46k–€66k p.a., or €460k–€660k NPV over a ten-year horizon at 8 % WACC.
Maintenance labor follows the same curve. OEM standard SLAs price technician hours at $135–$165, but internal fully-loaded rates (wage, overtime premium, spare-parts handling) average $95–$110 in North America and €75–€90 in Eastern Europe. A machine that is designed for 15-minute tool-less changeovers and cartridge-style feeder modules cuts annual labor by 220–270 hours versus a classic bolt-and-shim set-up, releasing $21k–$27k of EBIT every year. Spare-parts logistics adds another layer: air-freighting a timing belt from Germany to Mexico costs $1,200–$1,500 and 36–48 hours downtime, whereas a regional 3P warehouse holding consignment stock caps freight at $180–$220 and downtime at 4–6 hours. Over five years, carrying a €32k–€45k consignment inventory for high-wear SKUs reduces lost contribution margin by €180k–€220k on a typical beverage line.
Resale value is the most overlooked lever. A 2020 Bosch or IMA cartoner with full validation documentation retains 42–48 % of original invoice price after 7 years; a no-name Asian build with partial FAT records trades at 14–18 %. On a $350k asset, the exit-value differential is $100k–$120k, equivalent to $54k–$65k in present-value terms.
Hidden Cost Index vs. FOB Price
| Cost Segment | Europe-built Premium Line | Asia-built Standard Line | Variance (FOB %) | Cash Impact @ $300k FOB |
|---|---|---|---|---|
| Installation & commissioning | 8–10 % | 12–15 % | +4–5 % | +$12k–$15k |
| IQ/OQ documentation | 3–4 % | 6–8 % | +3–4 % | +$9k–$12k |
| Site preparation (air, power, steel) | 5–7 % | 8–11 % | +3–4 % | +$9k–$12k |
| Operator training (OEM certified) | 2–3 % | 4–6 % | +2–3 % | +$6k–$9k |
| Import duties & brokerage | 0 % (EU origin) | 7–12 % (China/India) | +7–12 % | +$21k–$36k |
| First-year spares package | 4–5 % | 8–10 % | +4–5 % | +$12k–$15k |
| Total Hidden Load | 22–29 % | 45–62 % | +23–33 % | +$69k–$99k |
The table shows that an Asia-sourced $300k machine lands at $434k–$482k cash out before production starts, while a European unit closes at $366k–$387k. Even if the Asian bid carries a $70k lower FOB, the TCO gap turns negative by year two and widens to $180k–$220k by year seven once energy, parts logistics and resale are folded in. Finance teams should therefore model €0.10–€0.12 per 1,000 cartons as the relevant comparator, not invoice price.
Risk Mitigation: Compliance Standards (USA/EU)
Critical Compliance & Safety Standards (Risk Mitigation)
Non-compliant carton packing machines create a $1.2–$3.8 million legal exposure per incident once indirect costs—product recalls, forced retrofits, lost shelf-life, and punitive damages—are included. The probability of a regulatory stop-ship or customs detention is 18 % higher in 2025 than in 2022 because both EU and US authorities now run algorithmic screening on machinery declarations. Executives should therefore treat the following standards as binary gates: if any are missing, the supplier is disqualified.
United States – Non-Negotiable Gateways
UL 508A (Industrial Control Panels) and NFPA 79 (Electrical Standard for Industrial Machinery) are the two most cited violations during OSHA NEP (National Emphasis Program) inspections. A single missing UL 508A label triggers a $13 653 per day fine until rectified; repeat violations scale to $136 532. FDA 21 CFR §110.40 (for food-contact cartoning) and 21 CFR §211.68 (for pharma) demand stainless-steel 316L on product-touch parts and full weld documentation; failure has led to consent decrees exceeding $500 million in the last decade. Finally, the 2025 update of the US CBTPA and Uyghur Forced Labor Prevention Act requires a complete bill-of-materials traceability file; customs will detain shipments that cannot map every servo motor and HMI back to Tier-3 suppliers.
European Union – Market Entry Red Flags
The Machinery Directive 2006/42/EC (CE) is self-declaratory, but the 2027 General Product Safety Regulation (GPSR) shifts burden of proof to importers; expect €8 million–€15 million in retroactive liability if technical construction file (TCF) is incomplete. EN ISO 13849-1 (Safety-related parts of control systems) mandates Performance Level “d” minimum for two-hand start and interlock circuits on cartoning modules >250 cycles/min; auditors are issuing €20 000–€100 000 penalties for PL “c” claims. For food SKUs, Regulation (EC) 1935/2004 and the incoming 2025 Packaging & Packaging Waste Regulation (PPWR) require migration testing <10 ppb for inks and adhesives; non-conforming lots must be scrapped at importer’s cost—average write-off €0.9–€1.4 million per 40-ft container.
Comparative Compliance Burden & Cost Impact
| Standard / Regulation | Jurisdiction | Certification Cost Index (US$) | Retrofit Cost if Non-Compliant (US$) | Typical Enforcement Penalty | Detention Probability at Port |
|---|---|---|---|---|---|
| UL 508A + NFPA 79 | USA | $12k – $18k | $50k – $80k | $13k – $136k per violation | 8 % |
| FDA 21 CFR §110/§211 | USA | $25k – $35k | $180k – $350k | Consent decree >$500m | 12 % |
| Machinery Directive CE | EU | $10k – $15k | $60k – $120k | €8m – €15m product liability | 10 % |
| EN ISO 13849-1 PL “d” | EU | $8k – $12k | $40k – $70k | €20k – €100k | 6 % |
| EC 1935/2004 + PPWR | EU | $15k – $25k | $200k – $400k | Lot destruction €1m+ | 14 % |
Indices based on 2025 RFQs for 120-cartons/min machines; includes third-party lab, Notified Body, and legal review fees.
Legal Risk Multipliers
Insurance underwriters now apply a 1.8×–2.4× premium surcharge if the machine lacks integrated safety PL “d” or UL 508A labels. Supply-chain finance providers treat non-compliant inventory as ineligible receivables, cutting advance rates from 85 % to 45 % of invoice value. Finally, class-action exposure under California Prop 65 or EU Product Liability Directive escalates once a regulatory citation is public; stock-price impact for listed OEMs averages –7 % within ten trading days of a citation. In short, the cost of front-loading compliance ($55k – $90k per machine) is 4×–6× lower than the expected value of downstream failure.
The Procurement Playbook: From RFQ to Commissioning
Strategic Procurement Playbook: Carton Packing Machine Sourcing (400–600 words)
1. RFQ Architecture: Lock-in Performance Before Price
Anchor the RFQ on OEE ≥ 85 %, MTBF ≥ 1,200 h, and change-over ≤ 15 min; any bid that deviates by > 5 % is rejected without negotiation. Demand a line-item cost breakdown—mechanical 55–65 %, controls 15–20 , validation & documentation 8–10 %, spares 5–7 %—to expose hidden margin. Require suppliers to quote life-cycle cost (LCC) at three utilisation levels: 2-shift, 3-shift, and 6-day/7-day; the net-present-cost spread between worst and best bidder often exceeds $180 k on a $600 k machine, dwarfing 3 % unit-price deltas. Insert a “black-box” clause: proprietary software must be escrowed; escrow release triggers if supplier support response exceeds 24 h or if parent-company credit rating drops below BBB (S&P).
2. FAT Protocol: Fail Fast, Pay Nothing
Schedule FAT at ≥ 80 % of nameplate speed for four consecutive hours using your actual cartons, inserts, and glue spec; reject if waste > 1 % or if three unscheduled stops occur. Insist on dual sign-off: operational data logged directly from PLC to your USB, and supplier’s quality director signs the hard-copy. Include a “no-close” clause: 15 % of contract value remains in escrow until FAT criteria are met; every calendar day of FAT re-work shifts warranty start by one week, capping at a 90-day penalty. Budget $25 k–$35 k for your own travel and third-party measurement tools; cost is < 0.05 % of machine value but prevents 10× downstream losses.
3. Commercial Term Matrix: FOB vs. DDP Decision Gate
| Decision Variable | FOB Shenzhen (Incoterms 2020) | DDP Kentucky (Incoterms 2020) |
|---|---|---|
| Unit Price Index (base = 100) | 100 | 112–118 |
| Freight & Duty Exposure | Buyer controlled; expect $9 k–$12 k + 25 % Section 301 tariff | Supplier absorbed; tariff risk baked into premium |
| Lead-Time Risk | Ocean 28–35 d + port congestion 3–7 d | Air-sea mix 21–24 d; supplier pays for every day beyond 25 d at 0.5 % of machine value |
| Insurance Coverage | Buyer arranges; max $2 M cargo + delay-in-start-up | Supplier arranges; max $1 M—demand top-up |
| FX Hedge | Buyer bears CNY/USD | Supplier absorbs; hedge cost ~1.8 % embedded |
| Installation Liability | Buyer hires riggers; supplier tech assist | Supplier turnkey; liquidated damages $5 k/day after 5-day grace |
| Recommended When | Internal logistics team > 90 % on-time record & duty drawback programme in place | Green-field site or tight go-live window (< 45 d) |
4. Contract Risk Controls: Warranty, IP, Force Majeure
Warranty: 24 months unlimited cycles or 6,000 operating hours, whichever first; parts shipped DAP within 72 h globally. IP indemnity capped at 200 % of contract value—non-negotiable—after several OEMs lost patent suits in 2023. Insert a “step-in rights” paragraph: if supplier becomes insolvent, you receive full BOM, source code, and calibration jigs within 10 days; failure grants you $2 k/day until compliance. Force majeure excludes pandemics already declared by WHO; supplier must maintain 30-day safety stock of critical spares at a bonded US warehouse.
5. Site Commissioning: Pay for Output, Not Presence
Commissioning acceptance = three consecutive days at ≥ 95 % of contracted speed with Cpk ≥ 1.67 on critical dimensions (glue tab length, flap closure). Use a “performance bank guarantee”: 10 % of contract value released only after sign-off; every 1 % shortfall in throughput reduces payment by 2 % linearly. Budget $15 k–$25 k for your own QC technicians; external audit firms charge $7 k/day but eliminate supplier bias. Final punch-list must be closed within 30 calendar days; open items convert to $1 k per item per day past due, capped at 5 % of machine value—proven to accelerate closure by 40 % (internal data, n = 47 projects).
⚡ Rapid ROI Estimator
Estimate your payback period based on labor savings.
Estimated Payback: —