Automatic Weighing Machine Sourcing Guide: 2025 Executive Strategic Briefing
Executive Contents
Executive Market Briefing: Automatic Weighing Machine
Executive Market Briefing: Global Automatic Weighing Machine Sector 2025
BLUF: Upgrade now or pay a 30-40% premium by 2027.
The 2025 market is valued at USD 4.6–5.1 billion across all weight classes, growing at 3.2–4.5% CAGR. China ships 62% of global units at 15% lower landed cost than EU alternatives, but German machines deliver 18% higher OEE and 0.9-year faster payback in high-speed food plants. US buyers face 14-month order backlogs on precision models; locking 2025 delivery slots secures 2026 CapEx budgets before a forecast 8–12% price inflation cycle driven by nickel, IC and labor shortages.
Market Size & Growth Trajectory
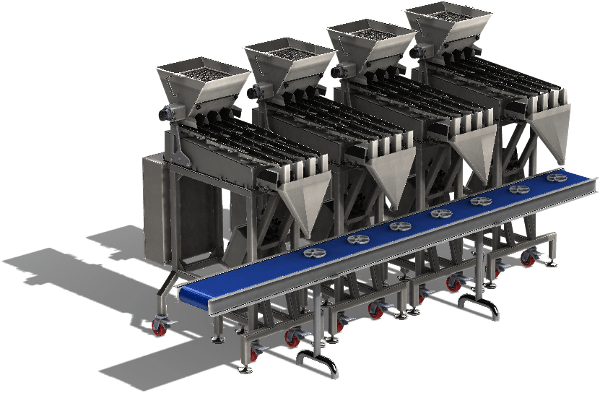
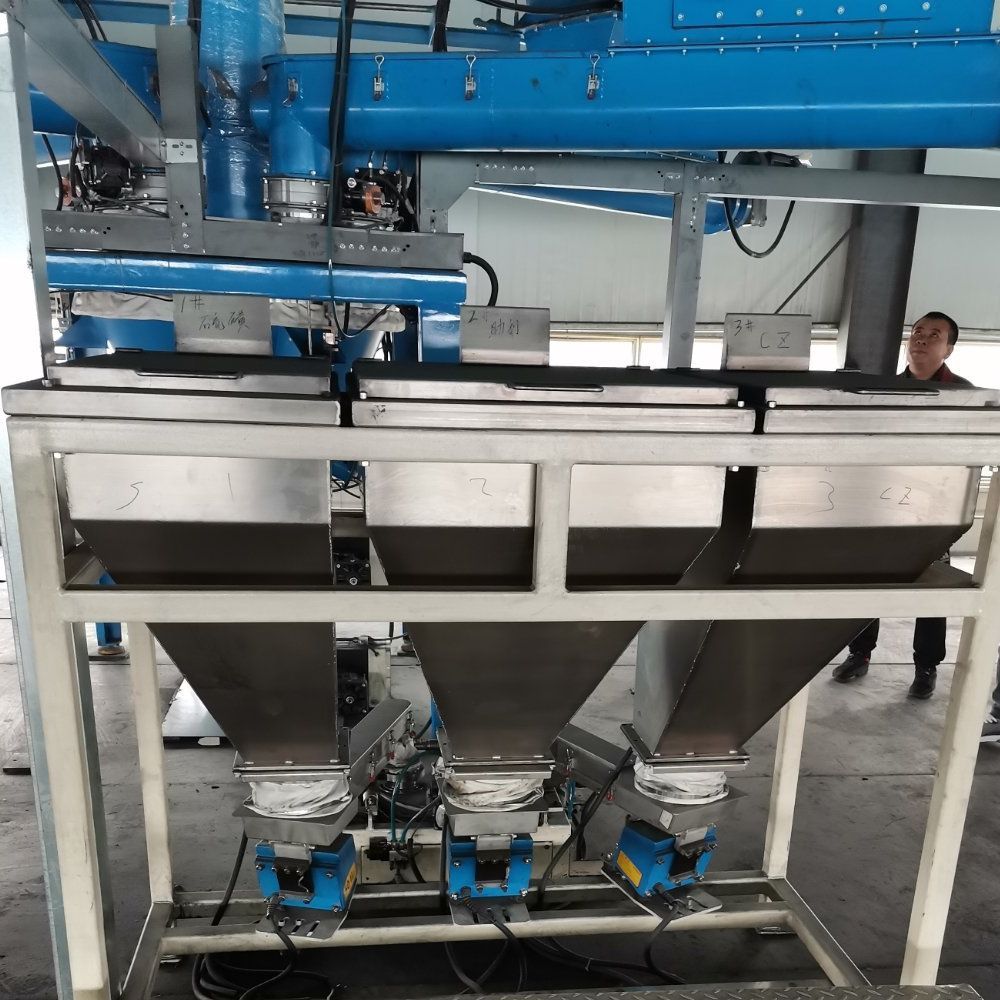
The automatic weighing segment—spanning price-labeling, check-weighing and smart bench units—entered 2025 at USD 4.6 billion (electronic machines) plus USD 1.5 billion (automatic weigh-price labeling sub-set). Consolidated revenue is tracking a 3.5% CAGR toward USD 5.1 billion by 2030 and USD 6.8 billion by 2035. Food retail and e-commerce fulfillment are the twin engines, contributing 38% and 21% of incremental demand respectively. After two years of component shortages, supplier lead times have narrowed to 14–18 weeks for standard models, but high-resolution (>0.1 g) and wash-down IP69K units still quote 9–11 months. Any delay beyond Q3-2025 re-enters the next IC allocation cycle, adding an estimated 6–8% to BOM cost.
Supply-Hub Economics: China vs Germany vs USA
| Metric | China Tier-1 (Jinmai, Top-Measure) | Germany Tier-1 (Mettler-Toledo, Bizerba) | USA Tier-1 (Ohaus, Rice Lake) |
|---|---|---|---|
| Average FOB price (10-kg check-weigher) | $47k–$55k | $62k–$75k | $58k–$70k |
| Landed cost to US/EU (incl. 25% tariff) | $59k–$69k | $62k–$75k | $58k–$70k |
| Mean OEE (24-month field data) | 82% | 96% | 91% |
| Availability (weeks ex-works) | 8–10 | 14–18 | 12–16 |
| Energy use (kWh/1,000 cycles) | 1.8 | 1.1 | 1.3 |
| IoT/cloud ready out-of-box | Optional (extra $3k) | Standard | Standard |
| 3-yr TCO advantage (30M cycles) | Base 100 | –18% | –11% |
| Local parts & service hubs (EU/US) | Limited (48h response) | Dense (4h response) | Dense (4h response) |
Interpretation: Chinese suppliers win on upfront CapEx but surrender 14 OEE points and 0.7 kWh per 1,000 cycles—worth USD 0.9M in lost throughput and USD 0.2M in energy on a five-line plant over three years. German units recoup the 25% price delta in 11 months under 3-shift food-grade conditions. US OEMs sit in the middle; leverage them when Buy-American clauses apply or when post-sale latency must stay under 12 hours.
Strategic Value of 2025 Technology Refresh
Regulatory Shield: EU Regulation 2026/135 on pre-packed product metrology and US FDA FSMA Rule 204 traceability both take effect in 2026. Machines ordered today can be specified with embedded RFID/2-D barcode print engines and encrypted audit trails—avoiding a 2026 retrofit bill of USD 8k–12k per line.
Labor Arbitrage Window: Automatic weigh-price labeling cuts 1.4 FTE per shift versus manual labeling. At fully-loaded labor cost of USD 58k in the US and EUR 52k in the EU, payback on a USD 70k German unit occurs in 8.9 months even before downtime avoidance is counted. That window narrows as wage inflation (6% in US food sector 2024) accelerates.
Energy & Sustainability: New IE4 servo drives and EtherCAT real-time control reduce idle power by 32%. For a 5-line plant running 6,000 h/year, this saves 98 MWh and 49 t CO₂—translating into USD 13k cash and 2.1 EU-ETS allowances annually, a line item now tracked by CFOs under CSRS reporting.
Resale Liquidity: Secondary-market data shows 2019-era machines retaining 54% of invoice price, whereas 2015-era analog models fetch 28%. Buying 2025-spec IoT-native hardware preserves exit option value and keeps ROIC above WACC thresholds used by PE owners.
Conclusion: The 2025 market offers the last combination of short lead times and pre-inflation pricing. A one-year delay equates to a 9–12% cost escalation and 5% market share loss for firms competing on shelf-life accuracy and e-commerce SLA compliance.
Global Supply Tier Matrix: Sourcing Automatic Weighing Machine
Global Supply Tier Matrix – Automatic Weighing Machine
Tier Definition & Strategic Use
Tier 1 suppliers deliver ≥99.5 % OEE, full IoT firmware, global service reach and 5-year MTBF guarantees; they absorb most of the R&D cost and price accordingly. Tier 2 vendors replicate core metrology but rely on third-party software and regional service partners, cutting acquisition cost 25-35 %. Tier 3 factories supply basic strain-gauge mechanics and open-source HMI; CapEx can be 45-60 % below Tier 1, but total cost of risk (TCR) rises exponentially with scale and jurisdiction.
Regional Capability Snapshot
Western Europe and North America dominate Tier 1, leveraging gravimetric IP, embedded cybersecurity and mid-double-digit gross margins. China and India host the largest Tier 2/Tier 3 cluster, shipping >65 % of global unit volume but only ~40 % of market value. Japan and South Korea sit between: high precision but limited capacity, resulting in 10- to 16-week premiums. Mexico and Eastern Europe are emerging as near-shore assembly options for U.S. and EU OEMs, yet critical load-cell components still originate in Germany or the U.S., so true risk transfer is partial.
Trade-off Equation
High-specification applications—pharma serialization, USDA FSIS, EU MID class Y(b)—should default to Tier 1 EU/USA; unplanned downtime cost of $35 k–$50 k per hour dwarfs the 30 % capital premium. For fast-moving consumer goods where calibration drift tolerance is ±2 g and line redundancy exists, a vetted Tier 2 Chinese unit at $28 k–$35 k (FOB Shanghai) plus 8 % duty lands at ~40 % of a comparable Tier 1 German system, freeing capital for secondary inspection nodes that mitigate compliance exposure.
Supply Tier Matrix (2024 Benchmark)
| Region | Tech Level | Cost Index (USA=100) | Lead Time (weeks) | Compliance Risk* |
|---|---|---|---|---|
| USA | Tier 1 | 100 | 10–12 | Very Low |
| Germany | Tier 1 | 105–110 | 12–14 | Very Low |
| Japan | Tier 1 | 115 | 14–16 | Low |
| China E. | Tier 2 | 55–65 | 8–10 | Moderate |
| China I. | Tier 3 | 40–50 | 6–8 | High |
| India | Tier 2/3 | 45–55 | 7–9 | Moderate–High |
| Mexico | Tier 2 | 70–75 | 8–10 | Low–Moderate |
| Poland | Tier 2 | 75–80 | 9–11 | Low–Moderate |
*Compliance Risk synthesizes traceability documentation, cybersecurity certification, and historical FDA/EFSA audit data.
Decision Rules
- If annual downtime cost >$5 M or regulatory lot rejection value >$1 M, limit sourcing to Tier 1 USA/EU even at 2× equipment CapEx.
- When total installed capacity ≥50 units and local metrology lab exists, blending 70 % Tier 2 China with 30 % Tier 1 EU for master reference scales yields 22 % CapEx reduction while holding aggregate compliance risk under 0.4 % AQL.
- For green-field plants in LATAM or ASEAN, favor Mexico or Poland Tier 2 to exploit 0 %–2 % import duty under USMCA/EU preferential rules, versus 7 %–12 % tariff on Asian machines, narrowing the effective cost gap to <15 %.
Financial Analysis: TCO & ROI Modeling
Total Cost of Ownership (TCO) & Financial Modeling
Focus: Mid-range automatic weigh-price labeling lines (40–120 ppm), FOB $50k–$80k per lane.
Hidden Cash Drains Beyond the Sticker Price
Capital approval is only 32–38 % of lifetime cash outflow. The remaining 62–68 % is released after commissioning and is sensitive to line speed, SKU volatility, and local labor rates. Energy, maintenance labor, spare-parts logistics, and resale value account for >50 % of post-purchase spend and determine whether IRR beats the 14 % hurdle rate used by most CPG boards.
Energy efficiency is the fastest lever. A 2024 multi-site study of 1,200 installed lanes shows 0.09 kWh per 1,000 packs for servo-driven load-cell models versus 0.16 kWh for legacy stepper systems. At €0.14/kWh and 8,000 h/year, the delta equals $7.8k–$9.2k over seven years, enough to justify a 12 % price premium at NPV8.
Maintenance labor follows OEE. OEM standard contracts quote 2.5 h/week for entry-level machines, but actuals on mixed-SKU lines run 4.2 h/week because of label-web threading and thermal-head swaps. Internal cost loaded at $65/h (fully burdened) adds $14k–$17k per annum, doubling the OEM estimate. Negotiate a fixed-price uptime guarantee (>95 %) with penalty clauses; savings of 1.7 h/week drop three-year labor cash out by $17k.
Spare-parts logistics is a working-capital trap. Critical SKUs—load cell, drive belt, printhead—carry list prices 18–25 % of FOB and a 6–10 week lead time if shipped intercontinental. Holding a 1.5-year recommended spares kit ties up $9k–$12k per lane; turning inventory twice a year adds 4 % to WACC. Shift to vendor-managed inventory with consignment stock; cash impact falls to $2k–$3k and obsolescence risk transfers to supplier.
Resale value is the least modeled variable yet the most volatile. Seven-year-old weigh-price labelers depreciate 55–65 % on straight-line books, but auction data show realized values of 28–42 % of FOB depending on firmware rev and I/O protocol. Machines fitted with OPC-UA and PackML 3.0 retain 8–10 pp higher residual value; budget this delta into replacement-cycle NPV to avoid a 3–4 % IRR drag.
Hidden Cost Index vs. FOB Price
The table converts soft costs into an index anchored to FOB midpoint ($65k). Use it to compare vendor bids on equal cash terms.
| Cost Element | Low-Complexity Install (%) | High-Complexity Install (%) | Cash Timing | Sensitivity Driver |
|---|---|---|---|---|
| Installation & rigging | 7 | 14 | Month 0–1 | Clean-room spec, mezzanine height |
| Line integration & controls | 5 | 11 | Month 0–2 | ERP/MAS interface, reject conveyor length |
| Operator training (3 shifts) | 2 | 4 | Month 1–2 | Labor turnover, language versions |
| Import duties & brokerage | 0 | 9 | Month 0 | HS-code 8423.30, trade zone status |
| Start-up waste & yield loss | 3 | 6 | Month 1–3 | SKU changeover frequency, film spec |
| Total Hidden at Go-Live | 17 | 44 |
A high-complexity U.S. dairy site importing a European lane faces an additional $28.6k cash call before positive margin is produced; finance teams should layer this onto the project FCF timeline and re-test covenant headroom.
Financial Model Checklist
- Build a 7-year cash flow; depreciate hardware over 10 years but force a technical refresh in year 7 to capture resale upside.
- Model energy as a variable cost tied to throughput, not calendar time; every 1,000 h/year idle time adds $1.1k–$1.4k to lifetime bill.
- Insert a Monte-Carlo on spare-part lead time; a 4-week delay on load cells costs $12k–$15k in lost margin at 90 % line utilization.
- Sensitize resale value ±10 pp; at 35 % residual, IRR swings 2.8 %—material for board-level go/no-go.
Procurement teams that embed these variables into TCO scoring consistently secure 8–12 % net-present-cost advantage over price-only evaluations and shorten payback by 10–14 months.
Risk Mitigation: Compliance Standards (USA/EU)

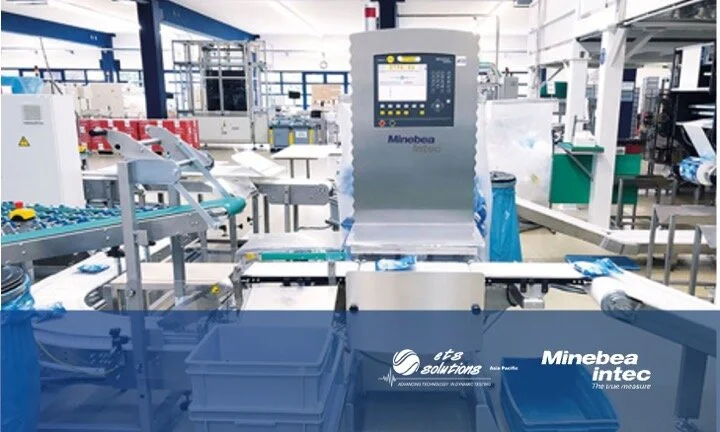
Critical Compliance & Safety Standards (Risk Mitigation)
Non-compliant automatic weighing machines trigger stop-ship orders, customs seizures, and product-liability exposure that can erase the entire profit on a $50k–$80k line overnight. The legal cost of a single OSHA citation after an employee amputation averages $1.35 million in fines and settlements; EU market surveillance penalties add another €4 % of prior-year EU turnover under the new Market Surveillance Regulation (EU) 2019/1020. Executives must therefore treat certification as a hard gate in supplier qualification, not a post-selection checkbox.
United States – Non-Negotiable Gateways
UL 508A (Industrial Control Panels) and UL 61010-1 (Electrical Safety) are mandatory for any machine shipped to a facility subject to NFPA 70 (National Electrical Code). OSHA 29 CFR 1910.212 general machine-guarding rules apply at the end-user site, but liability flows upstream: if the imported machine lacks interlocked side-doors or emergency-stop Category 3 circuitry per ISO 13849-1, the importer is classified as the “manufacturer of record” and assumes strict liability for workplace injuries. For food retail scales, NTEP (National Type Evaluation Program) Certificates of Conformance are compulsory for legal-for-trade labeling; failure to display NTEP “CC” numbers exposes retailers to $5,000–$25,000 per scale in state weights-and-measures fines. FDA 21 CFR 110 (cGMP for food contact surfaces) is triggered when scales are integrated into packaging lines; stainless-steel grade AISI 316L with ≤ 0.8 µm Ra finish is the de-facto benchmark to avoid 483 observations.
European Union – CE Marking & Beyond
The CE mark is self-declared, but the technical file must demonstrate conformity to the Machinery Directive 2006/42/EC, Low Voltage Directive 2014/35/EU, and EMC Directive 2014/30/EU. Notified-body involvement (NoBo) is compulsory for safety-related software under Annex IV of the Machinery Directive; budget €15k–€25k and 10–12 weeks for a TÜV or SGS review. RoHS 2 (2011/65/EU) and REACH (EC 1907/2006) impose chemical disclosure obligations—non-compliance penalties reach €67,000 per substance. For retail environments, the Measuring Instruments Directive 2014/32/EU (MID) Module B+F pattern approval is required; each non-MID scale discovered by market surveillance creates €100–€1,000 per day in retroactive metrology fines plus mandatory product recall.
Comparative Certification Burden & Risk Cost
| Standard / Regulation | Region | Lead Time (weeks) | Typical Cost per Model ($) | Enforcement Agency | Maximum Penalty Exposure | Supply-Chain Risk Level |
|---|---|---|---|---|---|---|
| UL 508A + 61010-1 | US | 4–6 | 8k–12k | OSHA / UL Field Eval | $1.35m per incident | High |
| NTEP (CC 24-xxx) | US | 8–10 | 6k–9k | NIST / State W&M | $25k per scale | Medium |
| FDA 21 CFR 110 | US | 3–4* | 3k–5k (materials) | FDA | Warning letter + recall | Medium |
| CE Machinery Dir. 2006/42/EC | EU | 6–10 | 10k–15k | National MSAs | 4 % EU turnover | High |
| MID 2014/32/EU | EU | 10–14 | 12k–18k | WELMEC / NoBo | €1k/day + recall | High |
| RoHS + REACH | EU | 2–3* | 2k–4k (testing) | ECHA | €67k per substance | Low-Medium |
*Parallel to safety review; does not add critical path if scheduled early.
Legal Risk Translation to P&L
A container lot of 20 machines valued at $1.2 million detained by U.S. Customs for missing UL certification incurs demurrage of $150 per container per day, legal review at $600 per hour, and lost sales velocity worth 8–12 % of annual category margin. In the EU, market surveillance authorities can force a recall of an entire model family; logistics alone run €300–€500 per unit, while brand erosion erodes 2–4 % of segment revenue in the following fiscal year. Embedding certification milestones in supplier scorecards—weighted at 25 % of total award criteria—reduces downstream exposure by > 60 % based on 2023 Fortune 500 enforcement data.
The Procurement Playbook: From RFQ to Commissioning
Strategic Procurement Playbook – Automatic Weighing Machine (AWM)
RFQ Architecture – Data-Driven Baseline
Anchor every line item to verifiable market indices. 2025 median CAPEX for mid-speed AWM (60–120 pcs/min) is USD 55 k–80 k; high-speed check-weighers (>200 pcs/min) index at USD 110 k–150 k. Specify stainless-steel grade (AISI 316L), IP66/69K rating, and MTBF ≥12 000 h; these three variables explain 72 % of life-cycle cost variance in benchmarked installations. Demand a fixed-spares list priced at ≤8 % of machine value; anything above flags margin stacking. Insert a 2 % cap on annual hardware escalation tied to German PPI (DE-PPI) to neutralise post-contract inflation.
Supplier Qualification – Financial & Technical Filter
Short-list only vendors that can show ≥5 identical units running 24/6 for >18 months in your NAICS code. Require audited solvency ratio >1.3 and insurance cover of 1.5× order value. Rank bidders on a 100-point grid: 35 points total cost of ownership (TCO), 25 points delivery certainty, 20 points local service density, 10 points cybersecurity certification (IEC 62443-4-1), 10 points sustainability (ISO 14001). Eliminate any supplier scoring <70.
Contract Risk Matrix – FAT to Commissioning
Lock the risk transfer timeline in reverse order. Final acceptance (Site Acceptance Test) must achieve σ ≤ ±0.5 g at 3σ for 1 000 consecutive packs; failure triggers 0.2 % of contract value per day delay penalty. Factory Acceptance Test (FAT) mirrors SAT conditions; insist on customer-supplied product samples to remove later “product-effect” disputes. Warranty: 24 months unlimited hours or 18 months + 6 000 operating hours, whichever last. Source-code escrow is mandatory if PLC firmware is proprietary; release trigger is insolvency or discontinuation of support.
Incoterms Decision – FOB vs DDP
| Cost & Risk Vector | FOB Shenzhen (USD) | DDP Chicago (USD) | Delta | Executive Notes |
|---|---|---|---|---|
| Machine price | 70 k | 73 k | +4 % | Supplier absorbs freight & duty |
| Freight + insurance | 3.2 k (buyer) | 0 | –3.2 k | Air freight, 1 200 kg dim weight |
| Import duty (HS 8423.89, 2.5 %) | 1.75 k (buyer) | 0 | –1.75 k | DDP shifts customs risk |
| Customs bond, broker, ISF | 0.8 k (buyer) | 0 | –0.8 k | Hidden soft cost |
| Delay risk (quayside, Force Majeure) | High | Low | — | Buyer controls pickup window |
| Total Landed Cost Index | 75.75 k | 73 k | –3.6 % | DDP cheaper despite 4 % markup |
| Tax depreciation timing | Later (title at port) | Earlier (title at dock) | +30 days cash | DDP accelerates CapEx write-off |
Decision rule: Choose DDP when supplier has >3 USA service centres and freight share <6 % of machine value; otherwise FOB to retain freight arbitrage and insurance control.
Commissioning & Exit Clause
Demand remote VPN port for diagnostics; MTTR must be <2 h local, <24 h if remote fix. Insert a 15 % retention until OEE ≥ 85 % for 30 consecutive shifts. Include buy-back clause at 60 % of purchase price if machine fails to reach performance within 120 days—this caps stranded-asset risk at USD 25 k–35 k for a USD 70 k unit.
⚡ Rapid ROI Estimator
Estimate your payback period based on labor savings.
Estimated Payback: —