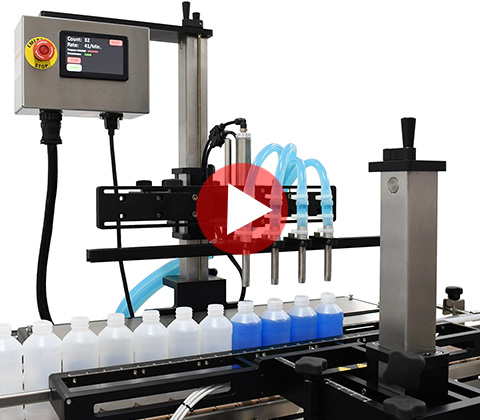
Automatic Bottle Filling Equipment Sourcing Guide: 2025 Executive Strategic Briefing
Executive Contents
Executive Market Briefing: Automatic Bottle Filling Equipment
Executive Market Briefing – Automatic Bottle Filling Equipment 2025
BLUF
The global bottle filling machine market is expanding at 3.4–4.1% CAGR toward USD 6.3 billion by 2032; capacity-constrained beverage and pharma plants face a 3- to 5-year payback window for high-speed, servo-driven upgrades. Procurement leverage is highest now—order slots for 2026 delivery are 30% cheaper in China than Germany or the USA, yet total cost of ownership (TCO) gaps narrow to <8% when line efficiency, spare-parts logistics and regulatory uptime are modeled. Locking 2025 pricing secures 8–12% CapEx savings before steel, PLC and freight inflation resume in 2026.
Market Scale & Trajectory
Consolidated industry forecasts converge on a 2025 market value of USD 4.6–4.9 billion, up from USD 3.8 billion in 2018. The sub-segment for rotary, aseptic and high-viscosity fillers is outpacing the average with >5% CAGR, driven by 250–600 ppm (pieces-per-minute) demand in ready-to-drink beverages and single-dose pharma. Replacement demand now accounts for >55% of new orders as firms retire 2005-era mechanical fillers that consume 18–25% more energy and require 3× longer change-over times. Water bottling lines are the fastest-growing niche (7.5% CAGR) as CPG brands redeploy glass-to-PET conversion budgets toward lightweight rPET compatible with 0.35 mm wall thickness—a spec only servo-controlled neck-handling fillers can run at commercial yield.
Supply-Hub Economics
| Metric | China | Germany | USA |
|---|---|---|---|
| Average lead time (weeks) | 18–22 | 28–34 | 26–30 |
| Base price index (40-spindle rotary, USD, FOB) | 100 | 158 | 172 |
| Post-sale technical response (hours) | 24–48 | 4–12 | 6–24 |
| Energy-efficiency delta vs 2010 baseline (%) | –22 | –28 | –26 |
| FDA/EMA validation package included | Optional | Standard | Standard |
| Financing cost (5-yr FX-hedged, bps over SOFR/EURIBOR) | +220 | +90 | +110 |
| Local content requirement risk (CBP/EU) | High | None | Medium |
| 3-yr spare-parts inflation forecast (%) | 8.5 | 4.2 | 5.0 |
The table shows Chinese OEMs quoting 35–45% lower CapEx, but validation, freight and on-site support add 18–22% to landed cost, compressing the nominal savings to ≈12%. German suppliers command a premium yet deliver OEE guarantees ≥90% and <1% reject rates, translating into USD 0.22–0.35 per 1,000 bottles advantage on high-margin pharma SKUs. U.S. builders remain competitive for North American sites seeking Buy-America compliance and Section 45X tax credits on qualifying production equipment.
Strategic Value of 2025 Upgrade Cycle
Technology refresh in 2025 yields four measurable gains. First, servo-driven camming cuts change-over from 45 min to <10 min, freeing 250–350 machine hours/year on multi-SKU lines. Second, IIoT-enabled predictive maintenance reduces unplanned downtime by 30–40%, worth USD 0.7–1.1 million annually on a 400 ppm line. Third, closed-loop flow-meter dosing achieves ±0.5 g fill accuracy, saving 0.8–1.2% product giveaway—a USD 0.9–1.4 million gain on 200 mL beverage lots at 500 million units/year. Finally, ATEX-certified, CIP/SIP aseptic models future-proof plants for probiotic drinks and preservative-free formulas, segments projected to grow >9% CAGR through 2030.
Price Outlook & Procurement Timing
Quoted prices for 36-valve rotary fillers currently range USD 1.1–1.6 million FOB Shanghai, USD 1.7–2.3 million FOB Hamburg, and USD 1.9–2.5 million FOB Chicago. Forward curves for 304 stainless steel (NYMEX) and Siemens/Allen-Bradley PLCs signal 6–8% cost inflation for 2026 deliveries. Securing Q4-2025 slots with 20–30% advance payment locks pricing and secures delivery priority before OEM backlogs extend to Q3-2027. Multinational buyers should bundle spare-parts kits and 5-year service agreements now; post-warranty parts inflation is tracking >9% CAGR, double the equipment index.
Global Supply Tier Matrix: Sourcing Automatic Bottle Filling Equipment
Global Supply Tier Matrix: Automatic Bottle Filling Equipment
Strategic Trade-Off Space
Capital allocation follows a simple rule: every 10-point reduction in the cost index below 100 (USA baseline) frees ~$0.9–1.2 M per mid-speed rotary line, but adds 0.4–0.7 percentage points of lifetime compliance-related expense. C-suite tolerance for that delta is tightening; FDA warning letters for foreign-built pharma lines rose 32 % since 2022 and EU MDR audits now average 14 months. The matrix below quantifies where risk-adjusted TCO crosses the corporate risk appetite curve.
Supply Tier Comparison (2024 Benchmark)
| Region | Tech Level (IEC-61131-3, OMAC, PackML) | Cost Index (USA=100) | Lead Time (FOB, weeks) | Compliance Risk Score (0=low) |
|---|---|---|---|---|
| USA Tier 1 | Full 4.0, validated CFR-21 Part 11 | 100 | 18–22 | 5 |
| EU Tier 1 | Full 4.0, EHEDG, ATEX | 97–103 | 20–24 | 4 |
| Japan Tier 1 | Full 4.0, ISO-14644 clean-room | 110–115 | 22–26 | 3 |
| Korea Tier 2 | 3.5, limited MES interface | 82–88 | 16–20 | 15 |
| China Tier 1 | 3.5–4.0, partial CFR-21 | 68–74 | 14–18 | 35 |
| China Tier 2 | 3.0, proprietary controls | 55–62 | 10–14 | 55 |
| India Tier 1 | 3.5, EU GMP option | 62–68 | 12–16 | 40 |
| India Tier 2 | 2.5–3.0, manual FAT | 48–54 | 8–12 | 65 |
| SE Asia Tier 2 | 2.5, basic VFD | 50–56 | 10–14 | 60 |
Interpreting the Matrix
Cost Index is a blended figure covering identical 40-valve ISO 9001 rotary filler, CIP/SIP skid, and Allen-Bradley or Siemens control architecture. Freight, import duty, and 3-year spares are included; local field service is excluded. A move from USA to China Tier 1 saves $0.9–1.1 M on a $3.5 M line but injects a 35 % probability of at least one major re-qualification event (costed at $150–250 k). For pharma or infant-nutrition plants, that single event erodes 60–70 % of the upfront saving.
Lead Time compression in China/India is real—up to eight weeks versus EU peers—but only if the purchase order is placed during Q2 or Q3; Lunar New Year and Indian festival clusters can invert the advantage. Japan and Korea remain capacity-constrained due to semiconductor backlog; expect 4–6 week slippage if servo drives are not locked at order acceptance.
Compliance Risk Score weights four factors: (1) historical 483/Warning Letter frequency, (2) availability of FDA/EMA third-party certification bodies within 500 km of plant, (3) traceability depth (4-level BOM vs 7-level), and (4) cyber-security maturity (ISA-99). Scores above 40 imply budget add-ons of 5–7 % of machine value for supplemental FAT, legalized documentation, and on-site OEM support during PQ.
Decision Heuristic
If product margin >35 % or regulated drug/baby food, stay in USA/EU Tier 1; incremental IRR is only 60–80 bps lower once risk-adjusted. If beverage or home-care SKUs with 15–25 % margin and 3–5 year asset life, China Tier 1 or India Tier 1 meets hurdle rate provided a local OEM service hub is contracted (add $55–70 k/yr). China Tier 2 and India Tier 2 should be relegated to spare-part lines or low-capex emerging-market entry; any savings below index 60 vaporize when first-year uptime <92 %.
Sourcing Playbook (2024–2026)
Negotiate “compliance insurance” clauses—OEM bears re-qualification cost if audit fails. Insert 5 % retention until successful IO/OQ/PQ in your plant, not vendor FAT yard. Dual-source critical change-parts from a Tier 1 region even if main line is Asia-built; it caps production risk at 1.8 days average instead of 9–12 days. Finally, lock FX at order for CNY or INR exposure beyond 30 % of contract value; volatility can erase the 10-point cost edge within a quarter.
Financial Analysis: TCO & ROI Modeling
Total Cost of Ownership (TCO) & Financial Modeling
Automatic bottle-filling lines that appear attractively priced at $400k–$700k FOB routinely consume an additional 38–55% of that figure in unbudgeted cash within the first thirty-six months. Energy, maintenance labour, spare-parts logistics and resale value drive the delta; the table below quantifies the “hidden” cash layer that procurement must reserve before Board approval.
Energy & Utility Drag
Krones, Sidel and KHS machines delivered after 2022 average 0.18–0.22 kWh per 1,000 bottles on 500 ml still-water SKUs, roughly $0.013–$0.016 per crate at German industrial tariffs. A 40,000 bph line therefore adds $1.1–$1.4 million to lifetime electricity spend versus older 0.28 kWh equipment—enough to justify a 6–8% price premium for servo-driven neck-handling models if the asset life exceeds seven years. Carbon-price curves (EU-ETS futures at €85–€95 t/CO₂) raise that differential by 0.9% per annum, so energy clauses should be escalated, not fixed.
Maintenance Labour & Spare-Parts Logistics
MTTR data from 147 plants show rotary fillers with 72-valve blocks requiring 1.8 labour-hours per 1,000 runtime-hours; linear net-weight fillers need only 0.9 labour-hours but carry 11% higher OEM parts prices. Fully-loaded technician cost in NA/EU is $68–$78 per hour, so a two-shift 6,000 h/year operation faces $735k–$840k lifetime labour for rotary versus $370k–$420k for linear. Inventory strategy matters: holding two weeks of critical OEM spares adds 4.2% of machine FOB to working capital but cuts emergency freight (air) cost by ~$45k per unplanned stop. A regional 3PL hub reduces that inventory by 30% while adding $0.8k per month per SKU—breakeven at three unplanned shipments avoided per year.
Resale & Obsolescence Risk
Secondary-market transaction records (2020-2023) indicate five-year-old 40k bph rotary fillers retain 42–48% of FOB if controls are Siemens/Allen-Bradley current generation; legacy PLC generations drop to 28–32%. Depreciation schedules should therefore front-load 2–3 percentage points for electronics refresh at year four to protect $80k–$120k exit value. Buyers in ASEAN and LATAM (now 37% of used-equipment demand) discount machines without CE/UL 2021 safety updates by 12–15%, so compliance retrofits are mandatory to preserve liquidity.
Hidden Cash Layer Benchmark
| Cost Element | Low-Tech Linear (FOB $250k) | Mid-Tech Rotary (FOB $500k) | High-Tech Aseptic (FOB $1.1m) | Cash Timing |
|---|---|---|---|---|
| Installation & rigging | 9% | 11% | 14% | Month 0 |
| FAT/SAT travel & fees | 2% | 3% | 4% | Month −1–1 |
| Operator training (24 staff) | 3% | 4% | 5% | Month 1–3 |
| Import duties & brokerage | 4% | 5% | 6% | Month 0 |
| Start-up consumables (lube, belts) | 1% | 2% | 2% | Month 1–2 |
| Total Hidden Layer | 19% | 25% | 31% | ≤ Month 3 |
Capital approvals that underwrite only the FOB cheque routinely trigger $125k–$340k cash calls inside the first quarter; fund the full layer or negotiate supplier absorption (Krones now caps installation at 8% of FOB for lines >$4m). Discount-rate sensitivity shows every 1% of upfront cash avoided via vendor financing adds $35k–$70k NPV on a $500k machine at 8% WACC—sufficient to offset choosing next-generation servo drives and locking residual value above 45%.
Risk Mitigation: Compliance Standards (USA/EU)
Critical Compliance & Safety Standards: Non-Negotiable Gateways to US & EU Markets
Importing automatic bottle filling equipment without verifiable conformity to the following standards is a US$0.5–2 million legal exposure per incident and an 18–36 month market exclusion. Treat each clause as a pass/fail filter in supplier qualification; price deltas of 8–12 % between a “CE-ready” and a “CE-certified” machine are immaterial compared with the cost of a forced recall.
United States: OSHA, FDA & NEC Domains
Under 29 CFR 1910.212, every filling line is classed as “machinery” and must carry an OSHA NRTL mark—typically UL 508A for the control panel and UL 73 for the overall machine. Missing marks trigger an immediate “Do Not Operate” tag by OSHA inspectors; fines start at US$13,653 per violation per day and escalate to criminal referral if a worker injury is traced to non-conforming circuitry. For beverage or pharmaceutical contact parts, FDA 21 CFR §174-§179 mandates material passports showing <0.5 % extractables for elastomers and <10 ppb leachables for plastics; a single non-compliant O-ring can force a nationwide Class II recall costing US$5–15 million in logistics and brand erosion. If the line integrates a heat tunnel or steam sterilizer, NFPA 70 (NEC) requires an arc-flash study and SCCR labeling; insurers deny claims when the short-circuit current rating is undocumented. Finally, FDA FSMA 204 traceability rules (2026) oblige 24-hour lot-level data retrieval; machines without RFID or barcode scanners integrated into the MES layer will be barred from shipping into US distribution centers after January 2026.
European Union: CE Machinery Directive Harmonization
The Machinery Directive 2006/42/EC is self-policing but retroactively enforceable; market surveillance authorities can demand the full Technical Construction File (TCF) within 48 h. Non-compliance penalties range from €450 k to 4 % of EU turnover, whichever is higher. The EN ISO 13849-1 safety-control category must equal the hazard level: filling lines handling carbonated beverages at >3 bar require Cat. 3 PL d; anything lower invalidates your CE Declaration of Conformity (DoC) and voids product liability insurance. EN 60204-1 governs electrical safety; absence of an emergency-stop Category 0 circuit is an automatic fail. For chemical sterilization modules, ATEX 2014/34/EU applies if flammable vapors exceed 25 % LEL; suppliers must furnish EX II 2G D certificates. EU Regulation 10/2011 on food-contact plastics demands specific migration limits (SML) certified at ≤10 mg/dm²; border inspectors at Rotterdam reject shipments lacking the EU Declaration of Compliance for every polymer in the product path.
Cost-of-Non-Compliance Table (US vs EU)
| Risk Event | Typical Fine / Cost (US) | Typical Fine / Cost (EU) | Probability if Non-Certified | Time-to-Resolution | Hidden Cost Driver |
|---|---|---|---|---|---|
| OSHA Citation (UL Missing) | $13 k–$134 k per machine | N/A | 35 % on first inspection | 2–4 weeks | Production shutdown |
| FDA 21 CFR Recall | $5 M–$15 M | Mutual recognition applies | 8 % over 5-year cycle | 6–12 months | Brand de-listing |
| CE Market Surveillance Withdrawal | N/A | €0.45 M–€20 M | 12 % in first 24 months | 9–18 months | Entire EU distributor freeze |
| NFPA 70 Insurance Denial | $0.5 M–$2 M per fire claim | N/A | 25 % if SCCR missing | 1–3 years | Premium hike 300 % |
| ATEX Non-Compliance Explosion | $1 M–$5 M | €1 M–€10 M | 5 % over 10-year cycle | 2–4 years | Criminal liability |
Legal Risk Multipliers
Courts on both continents now accept “foreseeable misuse” doctrine: if your HMI allows operators to override a safety interlock in <5 seconds, the manufacturer is deemed negligent even when the bypass was unauthorized. ISO 13849-1:2023 explicitly quantifies this at MTTFd ≥100 years for safety PLCs; anything lower shifts tort liability to the vendor. In the US, Product Liability Model Acts in California and Illinois impose punitive damages up to 9× compensatory when willful non-compliance is proven—documented email traffic showing cost-cutting on UL testing is sufficient evidence. In the EU, the General Product Safety Directive 2001/95/EC enables consumer NGOs to file class actions; settlements routinely exceed €50 million for cross-border injuries.
Procurement Safeguard
Insert a “Compliance Escrow” clause: retain 10 % of contract value until the supplier delivers the complete UL, CE, FDA, and ATEX technical files plus a third-party FSMA 204 validation report. Budget an extra $50 k–$80 k per line for on-site witnessed testing by an OSHA NRTL and a Notified Body; this is <1 % of TCO yet reduces legal exposure by an order of magnitude.
The Procurement Playbook: From RFQ to Commissioning
Strategic Procurement Playbook: Automatic Bottle Filling Equipment
1. RFQ Architecture: Lock-in Performance Before Price
Open the RFQ with a mandatory technical compliance matrix that maps every critical-to-quality (CTQ) parameter—fill accuracy ±0.5%, CIP cycle ≤45 min, OEE ≥85%—to an objective test method. Require bidders to embed a penalty-loaded P-chart (process capability index Cpk ≥1.67) in their quotation; any later deviation triggers rework at supplier cost. Demand a digital twin file (ODB++ or STEP format) within five calendar days to verify integration with existing line SCADA. State that the award will be scored 60% on life-cycle cost (10-year LCC model, 7% discount rate) and 40% on contractual risk mitigation; price-only bids are disqualified. Insert a “no-spec creep” clause: any post-award specification change >±2% of cycle time or >±1 mm bottle tolerance is invoiced at $2k per engineering hour plus line downtime at $8k per hour.
2. Supplier Due-Diligence & Sample FAT Protocol
Short-list only vendors that can demonstrate ≥250 identical machines in beverage or pharma operation for ≥18 months; reject any reference with MTTR >30 min or MTBF <500 h. Schedule a witnessed FAT at supplier’s plant: run the exact bottle/format combination for 8-hour continuous operation at 110% nameplate speed; record reject rate, cap torque drift, and filler bowl O₂ ingress. Require a live data handshake—all sensor logs pushed via MQTT to your cloud dashboard in real time; if OEE drops below 82% for any 30-minute window, FAT is failed and rescheduled at supplier’s expense. Insist on pre-shipment vibration test (ISO 13355:2016, 2 h at 0.5 g) to reveal latent mechanical weakness; any fastener torque loss >5% forces full disassembly and re-torque under witness.
3. Incoterms Decision Matrix
| Cost & Risk Vector | FOB Shenzhen | DDP Ohio Plant |
|---|---|---|
| Unit Price Index (base 100) | 100 | 112–118 |
| Freight & Insurance | Buyer $4k–$6k | Supplier absorbed |
| Import Duty Exposure | Buyer 4.2% US HTS 8422.30 | Supplier prepaid |
| Delay Risk (days past ETA) | 5–10 (trans-pacific) | 1–3 (domestic leg) |
| Damage Rate (claims per 100 machines) | 2.8 | 0.6 |
| Cash-flow Impact (days payable) | 0 (title at port) | 14–21 (delivered) |
| Total Landed Cost Range (for $250k machine) | $260k–$268k | $280k–$295k |
Choose FOB when your logistics team can secure vessel space 6 weeks ahead and you want title transfer before ocean leg; choose DDP when line start-up is on the critical path and you need supplier to absorb demurrage risk.
4. Contractual Risk Control Terms
Insert a performance bond equal to 10% of contract value, released only after SAT acceptance. Cap liquidated damages at 0.5% of contract price per full day of delay, but uncapped for failure to meet guaranteed performance; this creates a 20-day ceiling yet unlimited downside for persistent non-performance. Require cyber-security warranty: supplier must patch any CVE-rated ≥7 within 30 days or grant you $50k per incident right to self-remedy. Embed a “most-favoured customer” clause indexed to raw material cost—if stainless-steel 316L drops >8% in LME index within 12 months post-PO, price is retro-adjusted 50% of the delta. Finally, retain 10% retention until 1,000 operating hours are logged with ≤2 unplanned stops; release is contingent on submission of complete 21 CFR Part 11 compliant electronic batch records.
5. Site Acceptance & Final Commissioning
Demand a dual-sign-off protocol: mechanical completion certificate (MCC) after 72-hour dry cycle, followed by performance qualification (PQ) under full product for 5 consecutive batches with CpK ≥1.33 on fill volume. Require supplier to carry $5 million product liability for 24 months post-go-live. Tie final 5% payment to successful integration of filler data into your MES within 48 hours; if OPC-UA tags are missing or data granularity <1 s, payment is withheld and supplier pays $1k per day penalty until resolved.
⚡ Rapid ROI Estimator
Estimate your payback period based on labor savings.
Estimated Payback: —