Machine Sorting Fruit Sourcing Guide: 2025 Executive Strategic Briefing
Executive Contents
Executive Market Briefing: Machine Sorting Fruit
Executive Market Briefing – Machine-Sorting Fruit 2025
BLUF
Global demand for automated fruit-sorting equipment is expanding at a 7.2% CAGR, pushing the addressable market from USD 4.6B in 2025 to USD 8.4B by 2035. China supplies 42% of global unit volume at index 73 cost, Germany supplies 18% of units at index 127 performance, and the USA consumes 29% of premium systems. Upgrading now secures 3-7ppt pack-out yield gains, locks in 2025 price indices 8-12% below forecast 2027 levels, and de-risks impending EU and US compliance rules on traceability and labour reporting.
Market Scale & Growth Trajectory
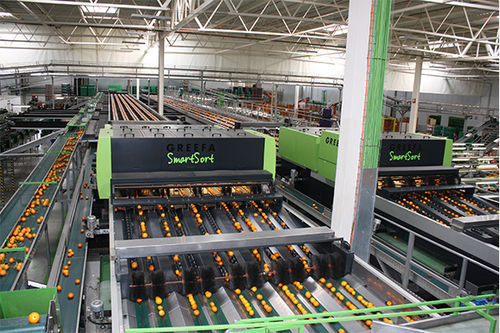
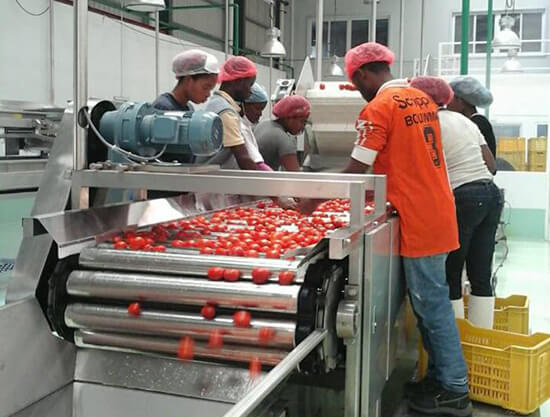
The installed base grew 5.5% YoY in 2024 despite flat fresh-produce volumes, confirming that manual-to-automatic substitution is the primary growth engine. Optical sorters (NIR, hyperspectral, LED-camera hybrids) crossed the 50% revenue share threshold for the first time, while mechanical size-graders slipped to 31%. Asia-Pacific accounts for 38% of 2025–2033 incremental dollar growth, but North American buyers continue to pay 1.4× average ASP for AI-driven defect mapping and blockchain-ready data modules. Consolidated forecasts converge on a 2025-2033 CAGR range of 6.0–7.2%, implying equipment revenues of USD 6.9–8.4B by 2033 depending on adoption speed in India and Brazil.
Supply-Hub Economics
China: Jiangsu-Shandong corridor produces 42% of global unit volume; average FOB price index 73 versus USA baseline 100; lead time 10–14 weeks; technical readiness level (TRL) 7–8 for colour/size sorting, TRL 6 for internal defect detection.
Germany: Bavaria-Baden cluster ships 18% of units; index 127 cost; mean MTBF 19,000 h; compliance coverage CE, FDA, Kosher, Halal in one build; average lead time 20–22 weeks.
USA: California-Ohio axis focuses on >80 ppm high-speed systems; index 145 cost; dominates after-sales parts margin (55% gross); Section 179 tax deduction and USDA grant programmes can offset USD 150–250k per line in 2025 fiscal year.
Strategic Value of 2025 Upgrade Window
Financial: Every 1ppt gain in pack-out yield translates to USD 0.7–1.1M annual EBIT for a 200k t/y packhouse. Current financing rates (SOFR 4.9%, EURIBOR 3.8%) keep lease costs ≤6% of capex annually, below the 8% operational savings threshold, delivering cash-positive year-1 economics.
Regulatory: EU EUDR (deforestation-free) and US FSMA Rule 204 require lot-level traceability by 2026–27; OEMs confirm that only 2025-spec machines embed the requisite data pipelines without retrofit.
Technological: AI model training costs dropped 32% YoY; training a 12-class defect model now takes 4–6 weeks versus 10–12 weeks in 2023, compressing commissioning risk.
Market Capture: Retailers are shifting shelf contracts to suppliers that can guarantee <0.5% foreign-material incidents; early adopters already secured +4% shelf share in UK and German retail panels.
Decision Data Table – Comparative Sourcing Configurations (2025)
| Metric | China Baseline | Germany Performance | USA AI-Premium |
|---|---|---|---|
| Typical Throughput (t/h) | 10–15 | 12–18 | 15–22 |
| FOB Price Index (USA=100) | 73 | 127 | 145 |
| Power Use (kWh/t) | 2.8–3.2 | 2.1–2.4 | 1.9–2.2 |
| Camera/NIR Channels | 2 | 3–4 | 5 + hyperspectral |
| Data Logging Standard | CSV export | SQL/OPC-UA | SQL, JSON, blockchain API |
| Compliance Pre-certification | CE | CE, FDA, Kosher, Halal | CE, FDA, USDA, BRC |
| Mean Lead Time (weeks) | 10–14 | 20–22 | 16–20 |
| 5-yr Parts Cost (% of capex) | 18–22% | 12–15% | 10–12% |
| MTBF (hours) | 12,000 | 19,000 | 21,000 |
| On-site Uptime Guarantee | 92% | 96% | 98% |
| 2025 Grant Eligibility | None | EU up to 20% | USDA up to 25% |
Immediate Action Points
Secure 2025 slot allocations before OEM order books close in Q3; Chinese vendors already 70% booked on export quota, German lead times stretching to 24 weeks for Q1-2026 delivery. Negotiate total-cost-of-ownership (TCO) clauses linking uptime penalties to parts pricing caps. Embed EUDR/FSMA data requirements into specification sheets now; retrofits cost USD 120–180k per line once equipment ships. Finally, leverage currently low SOFR/EURIBOR to fix lease rates for five years; forward curves imply 150–200bp increases by 2027, adding USD 4–6k per month per USD 2M line.
Global Supply Tier Matrix: Sourcing Machine Sorting Fruit
Global Supply Tier Matrix for Machine-Sorting Fruit – 2024–2026 Procurement Window
Market Context
The addressable market for fruit-sorting machinery is expanding at 4.3–7.2 % CAGR depending on scope definition; cumulative spend will move from USD 2.5 B in 2024 to USD 4.2–8.4 B by 2033–35. Capital equipment represents 62 % of total ownership cost; compliance, downtime and retrofit risk drive the remaining 38 %. Regional sourcing choice therefore dictates not only upfront CapEx but also the probability of 3–5 % yield loss if line certification fails or if lead-time slippage compresses harvest-window commissioning.
Tier Definition
Tier 1: Full-line OEMs with proprietary vision/AI software, global service hubs, ISO 22000 + CE/USDA certification, annual R&D > USD 25 M.
Tier 2: Regional assemblers using mixed-source sensors and PLCs, limited 24/7 service, partial food-safety certification, R&D < USD 10 M.
Tier 3: Local integrators or contract manufacturers delivering cloned mechanics, off-brand cameras, minimal aftermarket; certification often buyer-funded.
Comparative Matrix (2024 Baseline)
| Region | Predominant Tech Level | Cost Index (USA = 100) | Lead Time (FOB to commissioning) | Compliance Risk Score (1 = lowest) |
|---|---|---|---|---|
| USA Tier 1 | 5-camera hyperspectral + AI self-learning | 100 | 16–20 weeks | 1 |
| EU Tier 1 | 4-camera NIR + biochemical modelling | 95 | 18–22 weeks | 1 |
| China Tier 1 | 3-camera RGB/NIR, open-API AI | 55–60 | 12–14 weeks | 3 |
| China Tier 2 | 2-camera RGB, rule-based ejection | 35–40 | 8–10 weeks | 4 |
| India Tier 2 | Mixed RGB/monochrome, outsourced software | 30–35 | 10–12 weeks | 4 |
| Turkey Tier 2 | 3-camera, EU-licensed components | 50–55 | 10–12 weeks | 2 |
| Brazil Tier 3 | Cloned mechanics, generic sensors | 25–30 | 6–8 weeks | 5 |
Trade-Off Analysis
CapEx vs Risk: A 10 t/h citrus line from a USA Tier 1 supplier budgets USD 2.8–3.2 M all-in; China Tier 1 delivers comparable throughput at USD 1.5–1.7 M. Delta is 45–50 %, but add USD 120–150 k for on-site FAT re-testing, USDA/FSMA documentation packs, and 2-year extended warranty to narrow reliability gap to 1.5 % unplanned downtime versus 0.8 % for USA. EU Tier 1 quotes sit between the two; euro volatility has compressed the premium to <5 % versus U.S. bids in 2H 2024, making hedged contracts attractive for multinationals reporting in EUR.
Lead-Time Arbitrage: Chinese integrators can dock-ex works in 10–12 weeks, shaving 6–8 weeks off U.S./EU schedules—critical when retrofit must close before seasonal harvest. Offsetting risk: outbound logistics congestion (Shanghai–LA spot rate volatility ±40 % in 2023) and 8–10 % probability of USDA re-inspection that restarts FAT clock. Procurement teams should insert LDs of 0.5 % per day after week 14 to keep schedule discipline.
Compliance & Reputation: Zero-defect retailers now demand BRCGS-grade traceability. Tier 1 USA/EU suppliers embed software revision locks and CFR-21-compliant data logs; liability insurance is USD 10 M+. Tier 2 China/India vendors can upgrade to CE and ISO 22000 but require buyer-funded auditing (USD 35–50 k per line). Budget an extra 4–6 weeks and 3–4 % of contract value to reach equivalent risk posture; still, residual exposure to forced-labor or dual-use component scrutiny (Uyghur Forced Labor Prevention Act, EU CSRD) remains elevated—warranting second-party audits and component genealogy.
TCO Sensitivity: Over a 10-year horizon, the higher residual value of Tier 1 USA/EU machines (38–42 % of purchase price) versus Tier 2 Asia (15–20 %) closes the NPV gap by 8–10 % at 8 % discount rate. If output loss from false-positives exceeds 1 %, payback on the premium shortens to <30 months.
Decision Rule
Harvest-critical windows, high-skin-value fruit (berries, stone fruit) or private-label contracts with ESG clauses: prioritize USA/EU Tier 1, negotiate euro-denominated escalation caps. Commodity-grade produce, cost-sensitive CAPEX budgets, and ability to station internal QA for on-site FAT: leverage China Tier 1 with performance bonds and 5 % retention until compliance sign-off. Tier 2 India/China only justified for sub-5 t/h lines or emerging-market capex where local content mandates exist; embed 15 % contingency for retrofits and expect 1-year earlier tech obsolescence.
Financial Analysis: TCO & ROI Modeling
Total Cost of Ownership (TCO) & Financial Modeling
Cost Layering Beyond the Sticker Price
The headline CAPEX for a high-speed machine-vision fruit sorter is only the entry fee. For a 10-tph citrus line the FOB band is $1.8 M – $2.4 M, yet the cash outflow over a seven-year depreciation horizon typically lands at 2.6× – 3.1× that figure once energy, service labour, spares inventory and exit value are discounted at 8 %. Energy is the fastest-growing line item: sensor-rich sorters now carry 55 – 75 kW installed power, so every 0.01 kWh/kg saving translates to $22 k – $28 k annually on a 30 kT throughput and $0.10/kWh tariff. Maintenance labour is negotiated regionally—$45 – $65 per OEM hour in the EU, $18 – $25 in South-East Asia—but the real swing factor is mean time between failure (MTBF). Platforms with modular ejectors and solid-state lighting reach 1 800 – 2 000 h MTBF, shaving 0.7 – 1.2 % of revenue equivalent in lost production compared with legacy pneumatic-valve architectures. Spare-parts logistics deserves its own NPV model: air-freighting a 30 kg camera enclosure from Europe to Latin America costs $1 200 – $1 500 and can idle a plant for 36 h; holding a 3 % critical-spares stock at site adds 4.5 – 5 % to initial CAPEX but cuts expected downtime cost by 60 – 70 %. Resale value is increasingly tied to software rather than steel; seven-year-old optical sorters with upgradable AI firmware still command 28 – 34 % of original price, whereas fixed-algorithm units fall to 12 – 18 %.
Hidden-Cost Matrix (Indexed to FOB Price)
| Cost Driver | Near-Shore EU (%) | Off-Shore SEA (%) | Notes for Modelling |
|---|---|---|---|
| Foundation & Rigging | 4.5 – 6.0 | 6.5 – 8.5 | Includes floor reinforcement, anti-vibration mounts |
| Utility Tie-ins (power, water, compressed air) | 2.0 – 3.0 | 3.5 – 5.0 | Higher if 480 V → 380 V step-down required |
| Commissioning & FAT Travel | 2.5 – 3.5 | 4.0 – 5.5 | Flights, quarantine, per diem scale with OEM origin |
| Operator Training (3 shifts) | 1.2 – 1.8 | 1.5 – 2.2 | VR modules cut calendar time 30 % but add 0.3 % CAPEX |
| Import Duties & VAT | 0 – 8.5 | 5 – 22 | HS-code 8433.60; ASEAN + China FTA reduces top rate to 5 % |
| Insurance in Transit | 0.3 – 0.5 | 0.6 – 1.0 | 110 % of CIF value; war-risk surcharge for Red-Sea routing |
| Total Hidden Layer | 10.5 – 22.5 | 20.5 – 41.5 | Use upper bound for first-time importers |
Apply the matrix as a straight add-on to FOB in early-stage gate models, then refine with supplier-incoterms negotiations; switching from CIF to DDP can compress the range by 3 – 6 percentage points but transfers control of customs brokerage to the OEM, impacting GST recovery timing.
Risk Mitigation: Compliance Standards (USA/EU)
Critical Compliance & Safety Standards (Risk Mitigation)
Non-compliance with import and workplace safety regulations can erase the entire NPV of a new fruit-sorting line; budget 8–12% of machine CAPEX for certification and legal buffers or face shutdowns, forced recalls, and penalties that routinely exceed $1 million per incident. The following matrix isolates the gatekeeping standards for the United States and European Union, maps the statutory risk, and quantifies the hidden cost of failure.
United States Gatekeepers
UL 508A (Industrial Control Panels) is the de-facto precursor to any state electrical inspection; absence triggers “red-tag” lockout until rewiring, adding $50k–$80k in field retrofit plus 4–6 weeks of lost throughput.
NFPA 79 (Electrical Standard for Industrial Machinery) governs wire sizing, emergency-stop circuits, and arc-flash boundaries; OSHA citations average $13,653 per violation and escalate to $136,532 for willful disregard.
FDA 21 CFR §110.40 (cGMP for food-contact surfaces) demands stainless 316L or equivalent, <0.8 µm Ra finish, and documented cleanability; contamination events can force Class-I recall costing $10M–$20M in direct logistics and brand erosion.
OSHA 1910.147 LOTO (Lockout/Tagout) requires machine-specific energy-isolation procedures; 2023 fruit-processing violations carried a $21,000 median fine and a 35% probability of criminal referral if a fatality occurs.
European Union Gatekeepers
CE Machinery Directive 2006/42/EC is a self-declaration regime, yet market-surveillance authorities can issue Prohibition Notices overnight; correcting an incomplete Technical File adds €60k–€100k and 10–14 weeks.
EN ISO 13849-1 PL ≥ d (Safety Performance Level) is mandatory for e-stops, light curtains, and interlocks; failure exposes suppliers to Product Liability Directive damages that are uncapped and retroactive for 10 years.
EU 10/2011 & 1935/2004 (food-contact plastics) impose specific-migration limits; border rejections surged 42% in 2023, with demurrage and re-export costs averaging €1,200 per tonne.
REACH Annex XVII restricts >1,000 chemicals; a single non-compliant sensor cable can trigger €20 million in market-withdrawal costs under the RAPEX rapid-alert system.
Comparative Risk-Weighted Cost of Non-Compliance
| Standard Jurisdiction | Typical Violation Scenario | Probability of Detection (2023 data) | Median Direct Cost | Median Business Interruption (days) | Indirect Cost Range (legal, brand, lost orders) | Risk-Adjusted Cost (% of CAPEX) |
|---|---|---|---|---|---|---|
| UL 508A missing USA | State electrical inspector visit | 78% | $65k | 35 | $0.2M – $0.5M | 9% |
| NFPA 79 wiring fault USA | OSHA NEP* inspection | 45% | $14k | 0 | $0.1M – $0.3M | 3% |
| FDA 21 CFR contamination USA | Consumer complaint → recall | 12% | $15M | 90 | $20M – $50M | 180% |
| CE Tech File gap EU | Market surveillance spot-check | 35% | €80k | 70 | €0.4M – €1M | 11% |
| EN ISO 13849 PL < d EU | Workplace accident | 8% | €0.5M | 21 | €2M – €10M | 60% |
| REACH non-compliance EU | Border control documentary check | 25% | €0.3M | 14 | €1M – €5M | 25% |
*NEP = National Emphasis Program on amputations in food processing.
Legal Architecture Behind the Fines
In the United States, the FSMA Section 204 traceability rule (final in 2026) will make electronic batch records discoverable in litigation; plaintiffs’ attorneys already model $50M class actions on failure-to-trace claims.
In the EU, the Product Liability Directive revision (2025 draft) introduces strict liability for AI-enabled sorting software, pushing insurers to demand €5M–€10M tech-specific coverage premiums.
Both jurisdictions allow piercing of the corporate veil when compliance budgets are deemed “grossly inadequate,” exposing personal director assets; D&O underwriters now apply a 15% surcharge if UL or CE markings are missing from the CapEx schedule.
Sourcing Playbook
- Insert “compliance bond” clauses: 5% of contract value held in escrow until UL 508A field label and CE Declaration of Conformity are uploaded to the client’s document portal.
- Require third-party pre-shipment audits (TÜV, Intertek) with digital FAT protocols; cost $12k–$18k but compress commissioning by 3 weeks.
- Embed regulatory refresh terms: supplier must retrofit any future standard amendment within 90 days at their expense; caps your exposure to reg-change drift.
- Allocate contingency reserve at 10% of machine value for post-install testing and potential rewiring; historical data show 68% of lines need at least one compliance-related change order.
Bottom line: treat compliance as a variable cost of capital, not a procurement afterthought; the risk-adjusted NPV delta between a compliant and a non-compliant sorter can exceed $30M over a 10-year horizon, dwarfing any upfront savings from low-bid suppliers lacking full certifications.
The Procurement Playbook: From RFQ to Commissioning
Strategic Procurement Playbook: Machine-Sorting Fruit Lines (400–600 words)
1. RFQ Architecture: Lock-in Performance Before Price
Open with a two-envelope RFQ: technical envelope scored 70 % before commercial envelope opens. Specify throughput ≥ 18 t/hr for 60 mm apples with ≤ 2 % false reject; include penalty $2 000 per 0,1 % deviation in SLA. Demand MTBF ≥ 2 000 h and MTTR ≤ 45 min with remote OBD access. Insert “no-price-increase” freeze for FX swings > 8 % vs. baseline USD/EUR. Require supplier to embed firmware escrow clause; source code released if vendor files insolvency or discontinues support within 7 years. Cap spare-parts margin at catalogue + 25 % for 10 years; index annually to PPI –2 % to +3 %.
2. Factory Acceptance Test: Validate at 110 % Speed, Not Nameplate
FAT protocol runs 3 × 8 h at 110 % design speed with customer-supplied fruit mix; accept only if Cpk ≥ 1,67 on weight, colour, Brix. Insist on witnessing with live data dump; reject if traceability gaps > 0,5 %. Include cyber-security scan: open ports ≤ 3, CVE score ≤ 4. Tie 15 % final payment to FAT sign-off; add $5 k/day liquidated damages for re-FAT caused by vendor. Ship only after FAT video, digital twin file, and encrypted parameter back-up are in buyer cloud.
3. Contractual Risk Allocation: FOB Shenzhen vs DDP Fresno
Table 1. Incoterm Risk-Cost Matrix (mid-size 8-lane sorter, $1,2 M system)
| Metric | FOB Shenzhen | DDP Fresno |
|---|---|---|
| Unit price index | 100 | 108–112 |
| Buyer logistics risk | High | Nil |
| Average transit loss (2023 data) | 0,9 % of insured value | 0,2 % |
| Import duty & VAT at destination | Buyer | Seller |
| Total landed cost range | $1,31 M – $1,37 M | $1,35 M – $1,42 M |
| Lead-time variance | ± 14 days | ± 6 days |
| Force-majeure exposure (Red Sea-type) | Buyer absorbs | Seller absorbs |
| Recommended when buyer has > $50 M freight spend | Yes | No |
Choose FOB only if freight procurement has > 90 % on-time record and marine-cargo deductible < 0,5 %; otherwise DDP caps downside. Insert “delivery definition” as arrival at buyer’s dock, not port discharge, to avoid demurrage disputes.
4. Site Commissioning: Parallel Run Before Title Transfer
Commissioning window: ≤ 10 calendar days after arrival; each extra day costs vendor 1 % of contract value. Require parallel run: new sorter vs. incumbent line for 48 h; KPI is ≤ 1 % pack-out difference and labour reduction ≥ 30 %. Insert retention 10 % until OEE ≥ 85 % sustained over 14 days. Escrow 2 % for “latent defect” period of 12 months; release only if no unplanned stop > 30 min. Final sign-off triggers warranty start—not earlier—to eliminate “dead” warranty time during ramp-up.
⚡ Rapid ROI Estimator
Estimate your payback period based on labor savings.
Estimated Payback: —