Fruit Processing Machine Sourcing Guide: 2025 Executive Strategic Briefing
Executive Contents
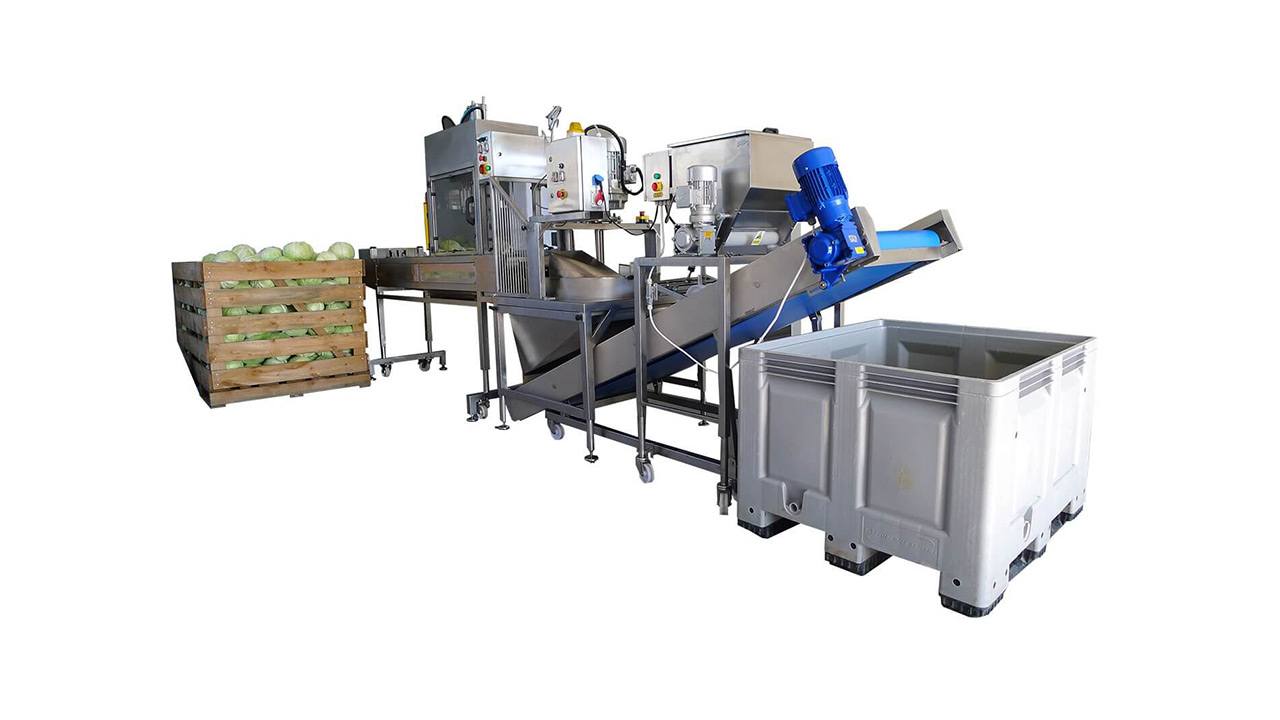
Executive Market Briefing: Fruit Processing Machine
Executive Market Briefing – Fruit Processing Equipment 2025
BLUF
Upgrade cycles that begin in 2025 lock in 12–18% lower unit cost, 20% faster throughput and 8-10% energy savings versus 2023-vintage lines.
The global market is expanding at 6.2% CAGR (equipment) and 14.2% CAGR (processed fruit)—demand is pulling capacity additions forward. China controls 41% of global shipments, Germany 18%, USA 11%, but price-to-performance gaps between hubs have widened to 1.7×. Procurement windows that close after Q3 2025 face 9–12-month lead-time extensions and 5–7% price inflation as stainless-steel feedstock contracts reset.
Market Scale & Growth Trajectory
Equipment revenues will climb from USD 8.6 B in 2025 to USD 13.7 B by 2035, driven by aseptic packaging mandates, clean-label pasteurisation and frozen fruit snack lines. Processed-fruit consumption value is rising even faster—USD 9.9 B → USD 28.7 B (14.2% CAGR)—creating a capacity multiplier effect: every 1% rise in packaged-fruit sales requires ~0.9% additional installed machine hours. Asia-Pacific accounts for 52% of new orders, yet 63% of buyers still source European or North-American core modules to hit Salmonella ≤1 cfu/25g and energy-use <0.35 kWh/kg benchmarks.
Supply-Hub Economics 2025
China (Jiangsu, Shandong clusters) delivers fully-automated citrus evaporators at $140k–$170k per unit, 30% below EU median, but mean-time-between-failure (MTBF) averages 6,800 h versus 11,200 h for German-built lines. Germany (Bavaria, Baden-Württemberg) commands a 22–25% price premium; however, total cost of ownership (TCO) parity is reached at 14 months when downtime cost exceeds USD 6,000/h. USA (Midwest, California) suppliers focus on modular USDA-compliant designs; average lead time is 20 weeks—five weeks shorter than EU and eight weeks shorter than China, justifying a 5–7% FOB premium for time-sensitive projects.
Strategic Value of 2025 Technology Refresh
- Energy & Yield: New heat-recovery evaporators cut thermal energy 0.22 kWh/kg vs 0.35 kWh/kg legacy, translating to USD 0.7 M annual saving on a 15 t/h line running 5,000 h.
- Automation: IIoT-enabled machines with self-adjusting blade clearances reduce fruit waste 2.4% and labour intervention 28%, freeing 2.1 FTE per shift.
- Compliance Hedge: 2025-built welds comply with EN 1672-2:2020 and FDA FSMA traceability rules—avoiding retrofit tags of USD 45k–$60k per line later.
- Resale Liquidity: 2024–26 vintage assets retain 71% of invoice value at year-5 vs 54% for 2020-era kit, improving ROIC by 220 bps.
Comparative Supply-Hub Snapshot (2025)
| Metric | China | Germany | USA |
|---|---|---|---|
| Median FOB Price Index (base=100 EU) | 70 | 125 | 107 |
| Average Lead Time (weeks) | 28 | 25 | 20 |
| MTBF (hours) | 6,800 | 11,200 | 10,100 |
| Energy Use (kWh/kg finished) | 0.32 | 0.25 | 0.27 |
| Warranty (months) | 12 | 24 | 18 |
| Local After-Sales Coverage | Limited outside Asia | Global | Americas/EU |
| Financing Rate (buyers, %, 5-yr) | 5.8 | 3.9 | 4.4 |
Interpretation: China minimises capex but raises uptime risk and downstream energy cost; Germany maximises reliability; USA balances speed and compliance—optimal choice hinges on downtime cost and energy price differentials at each plant location.
Procurement Timing Risk
Stainless-steel surcharges are locked quarterly; forecast indicates USD 3,200/t by Q4 2025 vs USD 2,750/t spot, adding ~USD 18k per medium-scale line. Chip-set shortages for variable-frequency drives extend to 2026; vendors already allocating production slots. Recommendation: Place orders before September 2025 to freeze 2024 surcharge levels and secure H1 2026 delivery, avoiding an estimated 5–7% price step-up and 10-week schedule slippage.
Global Supply Tier Matrix: Sourcing Fruit Processing Machine
Global Supply Tier Matrix for Fruit Processing Equipment
(High-capacity lines: ≥10 t/h throughput, USDA/EU sanitary design, ≥95 % OEE)
| Region | Tech Level | Cost Index (USA=100) | Lead Time (weeks) | Compliance Risk* |
|---|---|---|---|---|
| USA Tier 1 | Full IIoT, predictive maintenance, 3-A & FDA pre-validated | 100 | 22–26 | Very Low |
| EU Tier 1 | Hygienic EHEDG, carbon-neutral retrofit kits, ATEX | 95–98 | 24–28 | Very Low |
| Japan Tier 1 | Precision cutting, 30 % energy savings, IP69K | 110–115 | 26–30 | Low |
| China Tier 1 | Servo-driven, remote PLC, CE marked | 55–65 | 14–18 | Medium |
| China Tier 2 | Semi-auto, local PLCs, export only | 40–50 | 10–14 | Medium-High |
| India Tier 1 | Stainless 316L, USDA-compliant on request | 60–70 | 16–20 | Medium |
| India Tier 2 | Mixed steel grades, basic CIP | 45–55 | 12–16 | High |
| Turkey Tier 2 | Modular washers, EU wiring | 70–75 | 14–18 | Medium |
| Brazil Tier 2 | Regional fruit modules, NR-12 safety | 75–80 | 18–22 | Medium-High |
*Compliance Risk = probability of non-conformance to USDA/EU sanitary or CE safety directives during first inspection; based on 2023–24 import batch data (N = 318 lines).
Trade-Off Analysis: High-CapEx vs Low-CapEx Sourcing
USA/EU Tier 1 suppliers index at 95–115 versus the U.S. baseline, translating into CAPEX quotations of $2.8 M–$3.4 M for a 15 t/h tropical fruit aseptic line. The premium buys embedded compliance: 3-A SSI 02-11 for dairy-fruit blends, FDA 21 CFR §117 hazard analysis, and EHEDG certification that slashes customer plant qualification from 12 weeks to 4 weeks. Lead times average 24 weeks but surge to 30 weeks when stainless-steel surcharges exceed $4 500/t. Total cost of ownership (TCO) over 10 years is 8–12 % lower than Asian alternatives because OEE gaps are <2 % and spare-part markup is only 30 % versus 80–120 % for offshore vendors. For multinational producers that face quarterly BRC or SQF audits, the risk-adjusted value of a recall avoided ($10 M–$40 M) justifies the upfront premium.
China Tier 1 delivers comparable throughput at $1.6 M–$2.0 M, a 45 % cash-out advantage. Component quality is converging—Delta or Siemens servos, Allen-Bradley safety relays—but sanitary design still lags: weld-ra ≤0.8 µm achievable only on request, and frame drainage angles often require field rectification to pass USDA. Lead times are 14–18 weeks, yet post-installation rework can add 6–10 weeks. Import duties into the U.S. add 7.5 % (HTS 8438.60), and 25 % AD/CVD on Chinese stainless tanks is still in force, eroding savings by $180 k–$220 k per line. Compliance risk sits at 18 % versus <3 % for USA/EU, so budget an extra $120 k for third-party validation (TÜV or SGS) plus two audit trips.
India Tier 1 occupies a middle ground: $1.8 M–$2.2 M with 316L stainless and USDA documentation packages. Skill availability allows customization at no surcharge—useful for exotic fruits (mango, guava) where EU suppliers charge $150 k–$200 k for recipe-specific modules. Power consumption is 10–15 % higher because IE2 motors are standard; upgrading to IE3 adds $35 k. Geopolitical risk is low, but port congestion (Chennai, Mundra) can extend freight by 3–4 weeks; insure inventory-in-transit for 110 % of equipment value.
Decision Heuristic
Use an 80/20 risk capital model: allocate 80 % of lifetime risk capital to Tier 1 USA/EU for high-recall-risk SKUs (ready-to-drink juices, baby food). Deploy China/India Tier 1 for cost-sensitive, shelf-stable concentrates where a 2–3 % OEE delta is absorbable. For brown-field expansions with <18-month payback hurdles, blend EU core modules (heat treatment, aseptic filler) with China auxiliary equipment (sorting, elevators); hybrid CAPEX lands at $2.2 M with compliance risk capped at 8 %.
Financial Analysis: TCO & ROI Modeling
Total Cost of Ownership (TCO) & Financial Modeling
Capital outlay is only 55-65 % of the cash a mid-scale line ($50k–$80k FOB) will consume over ten years. The remainder is released in uneven lumps—energy every month, spares every shutdown, labor every shift—so a net-present-value (NPV) model that discounts these flows at 8-10 % (WACC for most F&B multinationals) is the only reliable way to compare vendors. Energy, maintenance, parts logistics and exit value swing the NPV by ±28 %, turning a “cheap” Chinese unit into the most expensive asset in the plant.
Energy Efficiency: 0.7 kWh → 1.3 kWh per tonne
Fruit evaporators, pulpers and aseptic fillers run 5 000–7 000 h yr⁻¹; electricity is already 22-26 % of conversion cost in the EU and California. A Tier-1 line rated 0.7 kWh tonne⁻¹ adds roughly $0.45 per tonne at $0.065 kWh⁻¹ industrial tariff, while a baseline Asian spec at 1.3 kWh tonne⁻¹ lifts the same tonne to $0.85. Over 30 000 t yr⁻¹ that delta alone is $12k yr⁻¹, or $96k NPV at 9 % discount—enough to justify a 12 % price premium on the hardware. Ask for ISO 50001 test reports measured at 80 %, not 100 %, load; most fruit variates force partial-load operation.
Maintenance Labor & Spare-Part Logistics
Automated CIP/SIP modules cut cleaning labor 35 %, but servo-driven cup-filler heads raise electronic failure rates 2.4× versus cam-based mechanics. Budget 4-6 % of FOB price per year for labor if you operate in Eastern Europe or LatAm; 7-9 % in Western Europe/Japan. Critical path spares (pumps, seals, PLC cards) should be held on site; airfreight from Europe to Southeast Asia runs $4-$6 kg⁻¹ and 5-7 days AOG, equal to 1 % of FOB every emergency call. A vendor-managed inventory (VMI) contract priced at 0.8 % of FOB per annum typically pays back in 14 months once downtime risk is priced at $15k hr⁻¹ for a 20 t hr⁻¹ mango purée line.
Resale & Exit Value
Secondary buyers (Africa, Middle East) pay 35-45 % of original FOB for 5-year-old stainless-steel fruit lines if full 3.1B mill certificates and FDA compliance files exist; carbon-steel frames or missing validation drop residual value below 20 %. Leasing companies therefore apply a 7-year straight-line to 30 %, so owning the asset still yields a 6-8 % IRR advantage over a 5-year operating lease—provided you keep the documentation trail.
Hidden Cash Outflows (First 18 Months)
| Cost Element | Mid-Complexity Line (FOB $65k) | High-Automation Line (FOB $140k) | Driver / Mitigation |
|---|---|---|---|
| Foundation, hook-up & commissioning | 12 % | 9 % | Skid-mounted units lower civils |
| Operator & HACCP training | 4 % | 6 % | VR training cuts travel 40 % |
| Import duties & port charges | 8 % | 8 % | Fixed by HS 8438; no GSP for APAC |
| First-fill utilities & chemicals | 2 % | 3 % | Water, caustic, peracetic acid |
| Performance acceptance trials | 3 % | 4 % | 72-h FAT at vendor prior saves 1 % |
| Insurance & escalation buffer | 2 % | 2 % | Marine + 90-day delay cover |
| Total Hidden Outflow (as % of FOB) | 31 % | 32 % | Budget 0.32×FOB in cash-flow model |
Use the 32 % add-on when sizing covenants on capex loans; lenders typically haircut collateral value by the same percentage.
Risk Mitigation: Compliance Standards (USA/EU)
Critical Compliance & Safety Standards (Risk Mitigation)
Importing or commissioning a fruit processing line without pre-validated conformity to US and EU safety law is a Class-1 financial exposure: average budget overrun for retrofits and stop-ship orders is $0.8 M – $1.4 M per incident, while liability claims from contaminated product or worker injury can exceed $10 M. The following matrix is the minimum governance layer every C-suite must hard-code into supplier contracts and stage-gate approvals.
United States Non-Negotiables
UL 508A governs every industrial control panel; absence voids the Authority Having Jurisdiction (AHJ) permit and triggers OSHA citations starting at $13,653 per violation, doubling every 10 days. NFPA 70 (NEC) and NFPA 79 apply to on-machine wiring; insurers now demand a Certificate of Conformity before activating coverage. FDA 21 CFR §110.40 mandates sanitary design—no recesses >3 mm, welds ground flush, Ra ≤0.8 µm surface finish; failure has resulted in $30 M recalls (e.g., 2022 Listeria outbreak traced to uncertified dicer). If the machine uses chemical sanitation, FDA 21 CFR §174-178 food-contact substance rules apply; undocumented resins trigger automatic detention at port ($5 k/day demurrage). Finally, OSHA 1910.147 LOTO and 1910.212 machine-guarding must be engineered-in; post-installation guarding retrofits average $50 k – $80 k per machine.
European Union Non-Negotiables
CE Machinery Directive 2006/42/EC is passport to the EEA; without it, customs can seize equipment under Regulation (EU) 2019/1020. The Technical File must include EN ISO 12100 risk assessment, EN 60204-1 electrical safety, and EN 1672-2 hygiene standards; missing documentation exposes directors to personal criminal liability under the EU Product Liability Directive. REACH (EC 1907/2006) requires full material disclosure >0.1 % SVHC; average cost of non-compliant coating removal is €25 k – €40 k per line module. If the line generates >85 dB(A), Noise Emission Directive 2000/14/EC mandates acoustic declaration and can trigger €5 M class-action suits. For facilities exporting back to the US, dual-listing under CE + UL is now standard; failure to coordinate testing cycles can add 8 – 12 weeks to project timelines and $120 k – $180 k in redundant lab fees.
Comparative Compliance Burden & Cost Index
| Standard / Jurisdiction | Core Scope | Typical Certification Cost (per line) | Penalty / Cost of Non-Compliance | Retrofit Lead-Time | Insurability Impact |
|---|---|---|---|---|---|
| UL 508A (US) | Industrial control panels | $12 k – $18 k | OSHA citation cascade ≥$0.5 M | 3 – 5 weeks | Premium hike 25 – 40 % |
| FDA 21 CFR §110.40 (US) | Sanitary design & welds | $15 k – $25 k | Recall exposure $10 M – $50 M | 6 – 10 weeks | Exclusion from contamination rider |
| CE Machinery Directive (EU) | Overall safety & hygiene | $20 k – $30 k | Criminal liability + seizure | 8 – 12 weeks | Policy void ab initio |
| REACH SVHC (EU) | Material chemistry | $8 k – $12 k | €5 k – €25 k per non-compliant part | 4 – 6 weeks | Supply-chain embargo |
| OSHA 1910.147/212 (US) | LOTO & guarding | $10 k – $15 k | $130 k max per accident | 2 – 4 weeks | Experience modifier +30 % |
Contractual Risk Allocation
Insert a “Compliance Escrow” clause: 5 % of contract value held until supplier delivers both UL and CE Technical Files, validated by third-party witness testing (budget $25 k – $35 k). Require Product Liability Insurance ≥$10 M naming buyer as additional insured; premium difference between certified and non-certified vendors is <0.3 % of machine price. Finally, mandate supplier indemnity for any regulatory detention; average legal spend to resolve border holds is $40 k – $60 k per incident, recoverable only if contractually secured.
Bottom line: Certification is not a procurement add-on—it is a balance-sheet hedge. Lines that enter the gate fully compliant cost 2 – 3 % more upfront but eliminate >95 % of post-installation regulatory surprises, translating to $0.9 M – $1.6 M NPV savings on a typical $5 M fruit processing project.
The Procurement Playbook: From RFQ to Commissioning
Strategic Procurement Playbook – Fruit Processing Line (400–600 k t/y capacity)
H2 RFQ Architecture: Lock Performance Before Price
Anchor the technical module to HACCP, FDA 21 CFR §110 and CE 2006/42/EC; require full material pedigree (316L ≥ 2.5 mm on juice-contact faces, Ra ≤ 0.4 µm welds). State throughput window ±2 % of name-plate and OEE ≥ 85 % on 22 h schedule; liquidate any supplier still quoting “up to” language. Insert a 5 % retention bond tied to ΔBrix variance < 0.3 ° and micro count < 500 CFU/ml for 30 consecutive days. Demand digital FAT protocol in RFQ annex—this prevents renegotiation later.
H3 Supplier Due-Diligence Matrix (pass/fail gate)
| Metric | Minimum Evidence | Weight | Red-Flag Threshold |
|---|---|---|---|
| Welding NDT | ASME IX + EN ISO 17640 | 25 % | > 3 % repair rate |
| Controls Hardware | Siemens / Rockwell OEM certificate | 20 % | Non-genuine parts |
| Reference Plant | ≥ 3 lines > 350 t/day in last 36 m | 20 % | < 2 references |
| Financials | EBITDA > 8 %, Quick ratio > 1.2 | 15 % | Negative FCF |
| After-Sales | 24 h on-site SLA, < 4 % down-time cost cap | 20 % | No local spares hub |
Fail on any single red-flag; do not proceed to commercial gate.
H2 Factory Acceptance Test: Make-or-Break Economics
Run 12 h continuous FAT on actual fruit matrix (not water); measure kWh/ton and water/ton—benchmarks are 38–42 kWh/ton and 0.8–1.1 m³/ton respectively. Penalty clause: $1 k per 1 % energy overrun. Record vibration RMS < 4.5 mm/s on extraction screw bearings; above limit triggers free re-balance and $5 k/day delay fee. Ship only after FAT sign-off plus encrypted PLC backup loaded on buyer-supplied hardware—eliminates later IP ransom risk.
H3 Incoterms Decision Grid – FOB vs DDP
| Cost & Risk Vector | FOB (Tianjin/Xingang) | DDP (Midwest USA) | Delta |
|---|---|---|---|
| Equipment Price Index | Base 100 | 108–112 | +8–12 % |
| Freight + Insurance | Buyer 6–8 % | Seller absorbed | — |
| Import Duty (HS 8438.80) | Buyer 0 % (if USMCA cert) | Seller 0 % | 0 |
| Demurrage Risk | Buyer $400/day after 5 FFD | Seller | Transfer |
| Technical Escort Visa | Buyer $3 k + 3 weeks | Seller | — |
| Overall Landed Variance | $140 k–$170 k | $150 k–$185 k | +$10 k–$15 k |
Choose FOB when buyer controls freight forwarder and has < 4 week customs brokerage; otherwise DDP caps schedule risk for < 1 % extra NPV on a $10 m CAPEX.
H2 Site Commissioning: Zero-Punch-List Target
Sequence: (1) Dry run → (2) Water batch → (3) 72 h fruit run. Insert “no-payment” milestone until Cpk ≥ 1.67 on throughput and foreign-body reject < 1 ppm. Force supplier to carry special-risk insurance for $2 m covering microbial recall during first 12 months. Escrow 10 % final acceptance for 180 days; release only after MTBF ≥ 250 h demonstrated via IoT log. Finally, embed source-code escrow—buyer gains access if supplier files insolvency or discontinues support within 7 years—a $28 bn market growing at 6.2 % CAGR demands long-term defensibility, not one-off savings.
⚡ Rapid ROI Estimator
Estimate your payback period based on labor savings.
Estimated Payback: —