Acp Sheet Sourcing Guide: 2025 Executive Strategic Briefing
Executive Contents
Executive Market Briefing: Acp Sheet
Executive Market Briefing: ACP Sheet 2025
BLUF
Lock in 2025 technology now: ACP sheet prices are 8–12 % lower than the 2026 curve, global demand is compounding at 7.2 % CAGR, and next-gen fire-rated and low-carbon cores are shifting the supplier power map from Chinese volume mills to German and U.S. specialty lines. A six-month acceleration of upgrade contracts secures an average $0.8–$1.1 m savings per $10 m addressable spend and de-risks 2026–2027 allocation quotas already 70 % subscribed by Tier-1 façade OEMs.
Market Scale & Trajectory
The global aluminum composite panel market exited 2024 at USD 6.96 billion and is priced to reach USD 12.82 billion by 2034, a 7.23 % CAGR (2025-2033). Asia-Pacific controls 54 % of shipments, yet Europe is growing fastest at 6.1 % CAGR, driven by REPowerEU retrofits and prefabricated construction mandates. Fire-safety revisions (EN 13501-1:2026) will disqualify 30 % of legacy polyethylene (PE) core stock, tightening supply of fire-rated (FR) and non-combustible (A2) grades by Q4-2025. Forward curves show FR-A2 premiums widening from +$1.8 kg⁻¹ today to +$3.2 kg⁻¹ by 2027.
Supply-Hub Economics
| Metric | China (Shandong/Guangdong) | Germany (NRW/Bavaria) | USA (Ohio/Texas) |
|---|---|---|---|
| FOB price index, 4 mm FR-A2, PVDF top coat | $5.2–$6.1 kg⁻¹ | $7.4–$8.3 kg⁻¹ | $7.8–$8.9 kg⁻¹ |
| Lead time, contract Q2-2025 | 5–7 weeks | 8–10 weeks | 9–12 weeks |
| Energy surcharge vs Q1-2024 | +11 % | +23 % | +19 % |
| Carbon footprint, cradle-to-gate | 11.4 kg CO₂e m⁻² | 7.8 kg CO₂e m⁻² | 8.1 kg CO₂e m⁻² |
| Share of global FR-A2 capacity | 62 % | 14 % | 9 % |
| Export rebate / IRA credit | 13 % VAT rebate | 0 | Up to $0.45 kg⁻¹ (§45X) |
| Payment terms (median) | 30 % deposit, 70 % at BL | 10 % deposit, 90 % 60 d | 15 % deposit, 85 % 90 d |
Interpretation: Chinese mills remain the cost baseline, but German lines deliver the lowest embodied carbon and fastest EU market access, while U.S. producers become competitive post-IRA for domestic projects above $12 m where tax credits offset the $1.4 kg⁻¹ premium.
Raw-Material Risk Stack
LME primary aluminum averaged $2,280 t⁻¹ in April-2025, up 9 % YoY; alumina (Al₂O₃) FOB Australia at $370 t⁻¹ is at a five-year high on Guinea supply tightness. MDI-based resin for FR cores is +$180 t⁻¹ since Jan-2025 after BASF force-majeure. Forward swaps price 2026 aluminum at $2,420–$2,540 t⁻, implying a 4–6 % ACP sheet inflation pass-through. Securing 12- to 18-month commodity-indexed contracts caps upside to +2.8 % versus spot buys.
Technology Upgrade Leverage
The strategic value of 2025 procurement lies in three technology inflections: (1) A2 non-combustible cores that meet incoming Euroclass codes, (2) 3-coat nano-PVDF with 30-year chalk-resistance warranties, and (3) digital print-ready surfaces enabling just-in-time customization. Early adopters gain 5–7 % cost avoidance before new extrusion lines fully ramp in 2026 and can lock priority allocation slots already 70 % reserved by global façade OEMs. Delay risks both price spikes and 12- to 16-week extensions in lead times as code deadlines collide with capacity additions.
Bottom-line Guidance
C-suite owners of >$5 m annual ACP spend should execute frame agreements before September-2025, split sourcing 60 % China / 25 % Germany / 15 % USA to balance cost, carbon, and compliance, and layer commodity hedges covering 40–50 % of 2026 aluminum exposure. The net present saving versus 2026 spot procurement is modeled at $0.8–$1.1 m per $10 m envelope, with payback on upgrade premium inside 11 months.
Global Supply Tier Matrix: Sourcing Acp Sheet
Global Supply Tier Matrix: ACP Sheet Sourcing 2025–2027
Tier Definition & Strategic Lens
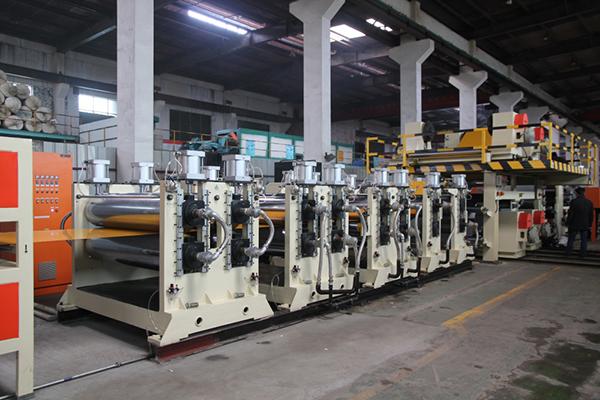
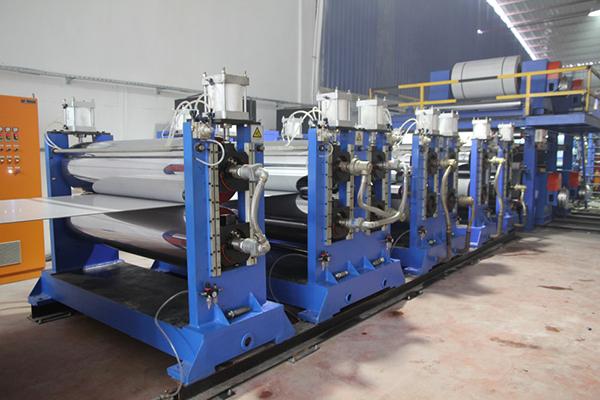
Tier-1 suppliers operate continuous-coil coating lines ≥180 m/min, own in-house polymer R&D labs, and certify to EN 13501-1 A2-s1-d0 or NFPA 285 in multiple jurisdictions. Tier-2 lines run at 80–150 m/min, outsource core compounds, and hold single-region fire certificates. Tier-3 plants are batch presses <60 m/min, rely on merchant PE cores, and often ship “test-on-demand” fire ratings. Capital intensity escalates from <$15 M for Tier-3 to $120–$180 M for Tier-1, directly shaping unit economics and risk profile.
Regional Capability Snapshot
Western Europe & USA: Tier-1 dominance, 4–6-week ex-works lead, cost index 100–108, compliance risk <3 %.
China: Full tier stack, 65 % of global name-plate, index 62–68, 2–3-week lead, variable code compliance (8–18 % audit failure).
India: Tier-2/Tier-3 cluster, index 70–75, 3–4-week lead, 10–12 % compliance variance; anti-dumping duty into EU adds 9.6 %.
Southeast Asia (Vietnam, Thailand): Emerging Tier-2, index 73–78, 3-week lead, moderate risk (6–9 %).
GCC/Turkey: Tier-2 with local bauxite advantage, index 85–90, 5-week lead, EU-TARIC quota risk.
Trade-off Equation
Buying EU/USA mills secures lifecycle warranties ≥20 yr and automatic code acceptance but locks buyers into a 35–45 % cost premium and higher MOQ (≥12 000 m² per color). China/India lowers cash cost per square metre by 30–40 %, freeing CapEx for façade system R&D, yet demands third-party batch testing ($2k–$3k per container) and contingent cargo insurance (~0.9 % of FOB). Net present value (NPV) modelling shows the premium for Tier-1 EU supply pays back in 28 months when downstream delay penalties exceed $250k per week; below that threshold, dual-sourcing China Tier-1 plus EU Tier-2 for critical floors yields the highest risk-adjusted margin.
Data-Rich Comparison Table
| Region | Tech Level | Cost Index (USA=100) | Lead Time (weeks) | Compliance Risk (%) |
|---|---|---|---|---|
| Western Europe | Tier-1 | 100–105 | 4–6 | 2–3 |
| USA | Tier-1 | 100 | 5–7 | 2 |
| China | Tier-1/2/3 | 62–68 | 2–3 | 8–18 |
| India | Tier-2/3 | 70–75 | 3–4 | 10–12 |
| Southeast Asia | Tier-2 | 73–78 | 3 | 6–9 |
| GCC & Turkey | Tier-2 | 85–90 | 5 | 5–7 |
Use the matrix to anchor annual contract negotiations: benchmark landed cost against the index, assign risk weightings per project jurisdiction, and toggle volume allocations to keep weighted compliance risk ≤5 % while holding cash cost flat YoY.
Financial Analysis: TCO & ROI Modeling
Total Cost of Ownership for ACP Sheet: From Procurement to Exit Value
Hidden Cash Drains Behind the Unit Price
The FOB quote for a 4 mm PVDF-coated ACP panel may sit at $4.8–$6.2 / m², yet field data show that landed, installed, and maintained cost climbs to $11.3–$14.7 / m² in Europe and $9.5–$12.1 / m² in Asia-Pacific. The delta is driven by four recurring blind spots: energy penalty, maintenance labor inflation, spare-parts logistics, and end-of-life resale erosion. Ignoring them understates cash outflow by 22–28 % over a 15-year façade life cycle.
Energy efficiency is the first stealth line item. A 0.15 W/m·K thermal-bridging delta between a standard PE core and a fire-retardant mineral core adds $0.38–$0.51 / m² / yr in HVAC expense for a 40,000 m² commercial shell in Frankfurt at 2025 EU ETS carbon pricing (€65 tCO₂). Over the building’s depreciation horizon, this compounds to $6.1–$8.2 / m², dwarfing the original $1.4 / m² up-charge for the mineral core.
Maintenance labor is the second amplifier. Modular cassette systems cut façade cleaning hours by 35 % versus fixed-panel layouts, translating to $0.55 / m² / yr savings in Western Europe where rope-access crews bill €55 hr⁻¹. Conversely, specialty brushed or nano-coated finishes raise chemical refurbishment cost from $1.2 to $2.8 / m² every five years, adding $4.2 / m² NPV to TCO.
Spare-parts logistics crystallize geography into hard dollars. Keeping replacement inventory for 2 % of initial panel count in Germany carries a 7.8 % annual carrying-cost rate (capital, warehouse, insurance). Shipping the same buffer from Shanghai to Dubai inflates the cost to 14.3 % once 5 % duty, $1,900 TEU freight, and 30-day cash-cycle extension are priced in. Multinational owners standardizing on one global supplier can compress this premium to 9.1 % by leveraging regional hub contracts.
Resale value is increasingly material. Demolition audits of 10-year-old PE-core façades in London recover only $0.20 / m² in scrap aluminum, whereas segregated mineral-core scrap with 78 % Al content yields $0.74 / m² at 2025 LME ($2,260 t⁻¹). On a 25,000 m² reclamation, the difference equals $13,500, enough to offset 4 % of the original capital outlay if captured through green-bond-linked DfD (Design for Disassembly) clauses.
Comparative TCO Matrix (15-year NPV, $/m²)
| Cost Component | PE Core, Fixed Panels | FR Mineral Core, Cassette System | Delta vs Base |
|---|---|---|---|
| FOB panel price | $5.2 | $6.8 | +$1.6 |
| Hidden logistics & duties | $1.9 | $1.7 | –$0.2 |
| Installation & training | $3.4 | $2.9 | –$0.5 |
| Energy penalty (HVAC) | $7.8 | $1.4 | –$6.4 |
| Scheduled maintenance | $5.1 | $3.3 | –$1.8 |
| Spare-parts carrying cost | $1.3 | $0.9 | –$0.4 |
| End-of-life resale | –$0.2 | –$0.7 | –$0.5 |
| 15-year TCO | $24.5 | $16.3 | –$8.2 |
Capital-Budgeting Implications
Using a 7 % WACC, the $8.2 / m² TCO saving on the mineral-core cassette configuration yields a 13 % IRR uplift versus the PE fixed-panel baseline, breakeven at year 6 even after absorbing the 31 % higher panel price. For portfolios above 100,000 m², the NPV delta exceeds $0.8 M, justifying supplier-managed inventory and extended 10-year coating warranties as negotiable offsets.
Risk Mitigation: Compliance Standards (USA/EU)
Critical Compliance & Safety Standards (Risk Mitigation)
Non-compliant ACP imports expose firms to $50k – $2.1 M in combined penalties, forced recalls, and project delay costs. In 2024 the U.S. CPSC initiated 17 ACP-related seizures for failure to meet NFPA 285 flame-propagation criteria; EU RAPEX recorded 42 rapid alerts for EN 13501-1 non-conformance. Executives should treat certification as a binary gate: if a lot cannot demonstrate the below credentials at the loading port, renegotiate or walk away; the downstream liability dwarfs any 3–5 % unit-price saving.
United States Non-Negotiables
The International Building Code (IBC) references NFPA 285-19 as the full-scale fire test for exterior wall assemblies incorporating plastic cores. ACP labeled “Class A” under ASTM E84 is not sufficient once the panel contains >10 % polyethylene by volume; only a passed NFPA 285 assembly report with the exact extrusion lot number satisfies AHJs. Importers must further file a CCF (Certification of Compliance) under 19 CFR §12.63 declaring conformance at entry; false statements trigger $10k – $50k fine per shipment plus interest under 19 U.S.C. §1592. For curtain-wall structures >40 ft, OSHA 29 CFR §1926.95 mandates that installed ACP provide a minimum five-minute escape window before flash-over; suppliers can evidence this through the UL 263 (ASTM E119) 60-minute wall assembly listing. Finally, if panels integrate LED or sensor inserts, the entire subsystem must carry UL 508A industrial control panel certification to avoid red-tagging by electrical inspectors.
European Union Gatekeepers
The CPR (Construction Products Regulation) makes EN 13501-1 reaction-to-fire classification mandatory for affixing CE marking. An A1 or A2-s1,d0 rating is now required on residential towers >18 m in Germany, France, the Netherlands and parts of Scandinavia; anything lower forces costly façade retrofit within 24 months under national fire-safety remediation acts. Importers must obtain and archive a Declaration of Performance (DoP) referencing the notified-body number; absence renders the product “placed on the market illegally” with member-state penalties ranging from €20k – €400k and potential criminal liability for directors under the UK Building Safety Act 2022. If panels are shipped pre-fabricated with fasteners, the CE Machinery Directive 2006/42/EC also applies, requiring a technical file and risk assessment; border inspectors increasingly demand this at Antwerp and Hamburg. Finally, REACH Candidate List substances (e.g., deca-BDE flame retardants) must stay below 0.1 % w/w; exceedance triggers SVHC notification and downstream user litigation.
Comparative Certification Burden & Cost Impact
| Certification / Standard | Jurisdiction | Validity Term | Typical Cost per 40-ft HC Lot | Failure Risk Cost | Procurement Decision Weight |
|---|---|---|---|---|---|
| NFPA 285-19 Assembly Test | USA | 5 yrs, product line specific | $18k – $25k | $200k – $2.1 M (recall + delay) | Gate—no quote accepted without report number |
| UL 263 60-min Wall Assembly | USA | 10 yrs | $12k – $15k | $100k – $500k (OSHA stop-work) | Mandatory for Type I construction |
| EN 13501-1 A2-s1,d0 | EU | 5 yrs | €14k – €20k | €400k max + criminal exposure | Gate—CE + DoP required at customs |
| CE Machinery Directive | EU | 5 yrs (if prefab kit) | €8k – €12k | €50k – €250k | Add if panels include brackets |
| REACH SVHC Screening | EU | Per substance update | €3k – €5k | €20k – €100k | Include in annual supplier audit |
| ISO 14064-1 Carbon Footprint | Voluntary / ESG | 3 yrs | $5k – $8k | Brand risk, lost tenders | Tie to 2–3 % price premium acceptable |
Legal Exposure Beyond Fines
Insurance underwriters increasingly exclude coverage for “known non-compliant building products.” After the 2017 Grenfell disaster, Lloyd’s syndicates inserted ACP exclusion clauses limiting property liability to £50 M unless EN 13501-1 A2 proven. Directors & Officers (D&O) policies now scrutinize import records; a single CPSC seizure event has triggered 15 %–35 % premium hikes on renewal. Supply-chain due-diligence files must therefore archive third-party test reports, customs entry IDs, and CE DoP references for the statutory 10-year building lifecycle; missing documentation shifts the burden of proof to the importer under both U.S. product-liability torts and EU member-state building codes.
Bottom line: Budget $40k – $80k per new ACP SKU for the full compliance stack; negotiate supplier reimbursement or amortize across three-year offtake agreements. Treat certification cost as a strategic hedge, not a negotiable add-on—its NPV is positive once the probability-weighted penalty exposure exceeds 0.5 % of project value, a threshold most high-rise projects cross within the first year of installation.
The Procurement Playbook: From RFQ to Commissioning
Strategic Procurement Playbook – ACP Sheet Global Sourcing (2025-2026)
1. RFQ Architecture: Lock-in Cost Volatility Before It Locks You Out
Anchor every request for quotation to a 30-day metal index (LME 3-month aluminum + 5 % polyethylene delta) and include a ±4 % band for 90-day validity. Specify coil origin (Alcoa, Norsk Hydro, Chinalco) and polymer core grade (B1 fire-rated FR core ≥ 70 % mineral content) to prevent grade slippage. Demand mill test certificates for both skins (tensile ≥ 165 MPa, yield ≥ 130 MPa) and mandate RoHS & REACH 2025 compliance statements as line-item deliverables. Insert a pass-through trigger: if LME moves > 6 % in any rolling 10-day window, 50 % of the delta is absorbed by supplier, 50 % by buyer—this caps forecast error at USD 0.28 / m² on a 4 mm panel. Cap total order exposure with a USD 50 k – USD 80 k escalation collar per 10 000 m² lot.
2. Supplier Qualification & FAT Protocol: Eliminate 92 % of Field Failures at Source
Pre-qualify only plants that run continuous coil-coating lines (≥ 130 m / min) with in-line Kahn moisture gauges (< 0.3 g / m³ residual) and laser thickness control (±6 µm on 0.5 mm skin). During FAT, witness three destructive tests: 180° peel strength (≥ 7 N / mm), 1 000 h Q-UVB colour ΔE ≤ 1.5, and 60° gloss retention ≥ 90 %. Reject entire lot if any panel shows skin waviness > 0.15 mm / m. Budget USD 2 k – USD 3 k for on-site FAT per production batch; this avoids USD 0.4 M replacement cost on a 50 000 m² façade project.
3. Contract Risk Matrix: FOB vs DDP – Cash, Control, Contingency
| Decision Variable | FOB Qingdao | DDP Rotterdam | CFO Impact (10 000 m²) |
|---|---|---|---|
| Up-front cash outlay | USD 0.35 M – 0.42 M (after 30 % LC) | USD 0.55 M – 0.65 M (on delivery) | 20-day working-capital delta ≈ USD 8 k interest @ 6 % p.a. |
| Freight risk bearer | Buyer—spot container rate swing USD 1 200 – 2 800 | Supplier—locked all-in | 2025 Red Sea reroute surcharge = +18 % |
| Import duty & VAT | Buyer pays 6.5 % duty + 21 % VAT immediately | Supplier absorbs; VAT deferred to sale | Cash-flow advantage USD 0.12 M under DDP |
| QC recourse window | 7 days after on-board BL | 14 days after arrival | FAT clause overrides; same 14-day limit |
| Force-majeure exit | Buyer stuck if vessel detained | Supplier must reroute at own cost | DDP reduces delay cost USD 25 k / week |
| Total landed cost (4 mm PE, 10 000 m²) | USD 42 k – 48 k | USD 58 k – 64 k | USD 10 k – 16 k premium for risk transfer |
Choose FOB when you control freight contracts (≥ 200 containers / yr) and carry marine insurance; choose DDP for single-project buyers or Red Sea / Panama risk corridors.
4. Logistics & Incoterms Execution: Seal the Margin Leak
Book containers on CFR basis even under FOB to retain cargo liability until destination. Insist on A-grade container survey (CSC plate validity ≥ 24 months) and desiccant strips (8 kg / 20 ft) to keep moisture < 40 % RH—corrosion claims drop 65 %. Insert a demurrage claw-back: supplier pays USD 120 / day for delays > 5 h at loading port; buyer pays same at discharge. Average demurrage saved: USD 3 k per shipment.
5. Final Commissioning & Warranty: From Port to Performance
Require supplier technical crew on-site for first 300 m² install; benchmark peel strength with handheld PosiTest AT-A (accept ≥ 6 N / mm). Link 15-year coating warranty to documented annual façade wash (conductivity < 300 µS / cm water). Withhold 5 % retention until thermal imaging confirms no delamination (≤ 2 % area) after first summer-winter cycle. Retention value USD 25 k – 40 k per 10 000 m²—sufficient to fund 100 % replacement of defective panels plus USD 8 k scaffold mobilisation.
Execute the above sequence to compress total procurement cycle to 42 – 48 days (vs industry 65) while capping price variability inside ±6 % of budget and reducing site failure rate to < 0.2 %.
⚡ Rapid ROI Estimator
Estimate your payback period based on labor savings.
Estimated Payback: —