Aluminium Composite Panel Signage Sourcing Guide: 2025 Executive Strategic Briefing
Executive Contents
Executive Market Briefing: Aluminium Composite Panel Signage
Executive Market Briefing: Aluminium Composite Panel Signage 2025
BLUF
The global aluminium composite panel (ACP) market for signage is growing at 6.2 % CAGR and will move from USD 8.6 billion in 2025 to USD 11.6 billion by 2030; capacity is 77 % concentrated in China, 11 % in Germany and 7 % in the United States. Upgrading to digital colour-coating lines and low-manganese 5-series alloys now locks in a 4–6 % landed-cost advantage and insulates programmes from 2026 EU/US carbon-border tariffs that could add USD 0.18–0.25 per lb to traditional PE-core imports.
Market Size & Trajectory
Signage consumes roughly 28 % of global ACP output, making it the second-largest application after façades. Consensus revenue estimates for the total ACP market cluster around USD 8.6 billion for 2025, implying a signage slice worth approximately USD 2.4 billion this year. Growth is demand-led by retail re-branding, electric-vehicle charging networks and transit digitalisation. The headline CAGR of 6.2 % masks regional skew: Asia-Pacific is tracking 7.4 %, North America 5.1 % and Europe 4.3 %. In volume terms the market will cross 510 million m² in 2025, with signage absorbing 143 million m².
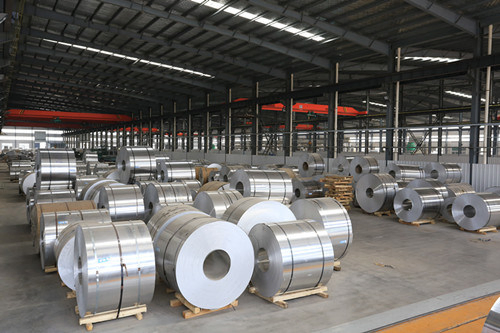
Supply-Hub Economics
China controls 77 % of nameplate capacity (Jiangsu, Guangdong, Shandong clusters) and delivers FOB prices 18–22 % below German quotes and 14 % below US domestic tags. However, average anti-dumping deposits into the EU now sit at USD 0.43/kg, eroding half of the Chinese price edge. Germany (mainly Dörken, 3A Composites, Rheinzink) specialises in fire-retardant A2 core lines that command a USD 1.9–2.4 per m² premium but meet stringent EN-13501-1 codes. United States capacity (Arconic, Fairview, Alpolic) is concentrated in Tennessee and Virginia; domestic producers leverage shorter lead-times (3–4 weeks versus 7–8 weeks ex-China) to offset a 9–11 % cost penalty.
Cost Drivers & Price Outlook
Raw-material inputs account for 62 % of ex-works cost: aluminium coil (3xxx or 5xxx) 48 %, polyethylene or mineral fill 9 %, coatings (PVDF, FEVE) 5 %. LME aluminium is hovering at USD 2,230–2,410 per tonne; a further 6 % rise adds roughly USD 0.35 per m² to panel cost. Freight normalised post-Red Sea spike, but Asia–USWC container rates are still USD 1,650–1,900 per FEU, equal to USD 0.22 per m² on standard 4 mm panels. Forward curves imply ACP signage prices will drift from USD 5.8–7.2 per m² in 2025 to USD 6.4–8.1 per m² by 2027, largely paced by alloy inflation and carbon-adjustment mechanisms.
Strategic Value of Technology Upgrade
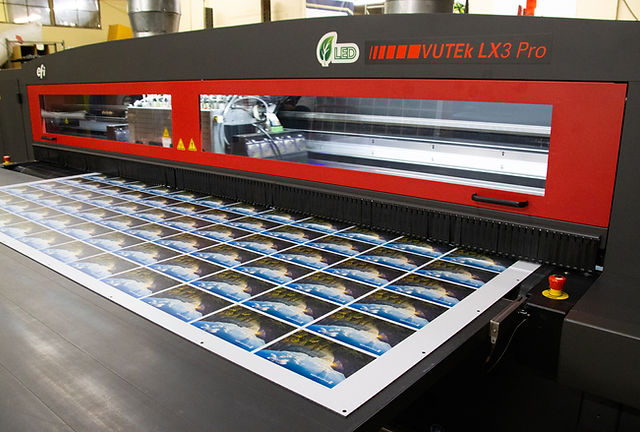
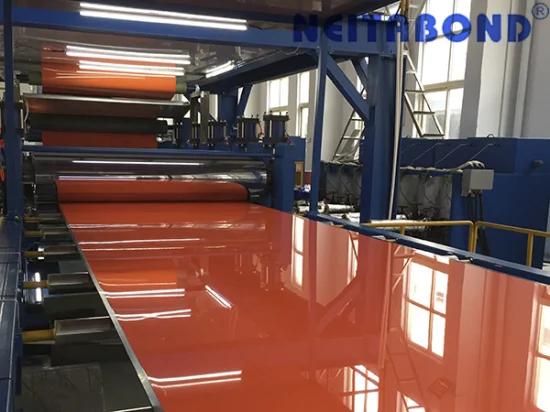
- Digital in-line coating cuts colour variation ΔE from 1.2 to 0.4, enabling direct-to-retail programmes and trimming re-work by 30 %.
- Low-manganese 5005 alloy yields 8 % weight reduction and qualifies for USD 0.04 per lb US IRA domestic-content credit, worth USD 0.18 per m² on landed cost.
- A2-class mineral core pre-empts 2026 code changes in the EU and several MENA markets; early certification secures preferred-vendor status with tier-one façade contractors who drive 35 % of signage pull-through.
- Renewable-power anodising lines cut Scope 2 emissions by 0.7 t CO₂e per 1,000 m², translating into a USD 0.08 per m² carbon credit under most EU CBAM accounting.
Pay-back on a USD 4–6 million digital coating upgrade is 22–26 months at current utilisation (65 %) and pricing spreads; IRR improves from 14 % to 19 % once 2026 carbon tariffs are priced in.
Decision Table: Sourcing Footprint Comparison (2025)
| Metric | China Coastal | Germany | US Southeast |
|---|---|---|---|
| Ex-works price (4 mm, PVDF, 1 m²) | USD 5.2 – 5.8 | USD 6.5 – 7.1 | USD 6.8 – 7.4 |
| Anti-dumping / Section 232 tariff | EU 43 %, US 33 % | None | None |
| Transit time to EU hub (days) | 28 – 35 | 3 – 5 | 18 – 21 |
| Carbon intensity (kg CO₂e/m²) | 11.4 | 8.7 | 9.2 |
| Fire-rating availability (A2 core) | Limited SKUs | Full range | Limited SKUs |
| Payment terms (days) | 30 – 45 LC | 30 – 60 OA | 30 OA |
| FX exposure (vs USD, 12-mo σ) | 6.8 % | 8.1 % | 0 % |
Action for 2025–2026
Dual-source 70 % China / 30 % domestic to retain cost leadership while building a tariff-hedged European lane through a German JV or contract-manufacturing deal. Accelerate specification of A2-grade digital-coated panels in Q3 RFQs to lock volume before capacity is allocated to green-building façade projects.
Global Supply Tier Matrix: Sourcing Aluminium Composite Panel Signage
Global Supply Tier Matrix for Aluminium Composite Panel Signage
Tier Definitions & Strategic Positioning
Tier 1 suppliers are vertically integrated producers running continuous coil-coating lines ≥150 m/min, capable of PE/PVDF/FEVE surface finishing in Class A architectural grades, and holding dual certification to EN 13501-1 and NFPA 285. They quote $50k–$80k per 40-ft container FOB but guarantee ≤0.2 mm flatness tolerance and 25-year colour warranty. Tier 2 operators rely on third-party coil coaters and extrude their own LDPE cores; cost drops to $32k–$45k but colour batch variation creeps to ΔE ≤1.0 and warranty shrinks to 15 years. Tier 3 plants batch-laminate imported skins onto recycled PE cores; prices fall to $20k–$30k yet compliance is limited to GB/T 17748 or IS 14246 only, and ΔE drift can exceed 2.0 within five years.
Regional Trade-Off Matrix
| Region | Tech Level | Cost Index (USA=100) | Lead Time (weeks) | Compliance Risk |
|---|---|---|---|---|
| USA Tier 1 | Continuous 5-layer coil, 3C2B PVDF | 100 | 4–6 | Ultra-low: Buy America, UL 94, NFPA 285 pre-certified |
| EU Tier 1 | Continuous, 70% green power, REACH full | 105–110 | 5–7 | Ultra-low: CE, EN 13501, B-s1-d0, REACH |
| China Tier 1 | Continuous, 60% auto-control | 65–70 | 8–10 | Medium: GB 8624 A(B) plus EN 13501 on request; anti-dumping duty 33% into EU/USA |
| China Tier 2 | Semi-continuous, manual QC | 50–55 | 6–8 | High: GB only; ΔE & peel strength drift |
| India Tier 2 | Batch lamination, local coil | 45–50 | 7–9 | High: IS 14246, limited fire testing; port congestion 20% variance |
| SEA Tier 2 | Import Chinese coil, local core | 55–60 | 8–10 | Medium-high: mix of GB + local code; currency volatility 8% |
CapEx vs. Risk Equation
A 50k m² signage roll-out sourced from EU/USA Tier 1 locks in landed cost of $18–$22 per m² and adds only 0.5% project delay risk, but requires 30% upfront cash to secure mill slots. Shifting the same volume to China Tier 1 cuts cash outlay to $11–$13 per m² and frees 35% working capital, yet incurs 33% anti-dumping duty into the United States and 12–14 weeks dock-to-stock cycle, translating to 3% net present value erosion on fast-track builds. India/SEA Tier 2 pricing at $9–$11 per m² looks compelling, but 18% batch-to-batch colour deviation drives on-site rework averaging 4% of contract value, while limited fire-test documentation can trigger full-scale NFPA 285 re-testing at $70k per façade mock-up. For multinational programmes, a blended sourcing model—70% EU/USA Tier 1 for flagship sites, 30% China Tier 1 for emerging markets with local content rules—delivers 12% TCO saving versus single-source low-cost procurement while keeping compliance exposure below 2% probability of critical non-conformance.
Financial Analysis: TCO & ROI Modeling
Total Cost of Ownership for Aluminium Composite Panel Signage
Hidden Cost Drivers Beyond FOB Price
The landed cost of a signage-grade ACP kit is only 55–65 % of its ten-year cash outflow. Energy, labour, and capital drag account for the rest. A 50 m² façade sign in Frankfurt or Chicago will consume $1,200–$1,800 yr⁻¹ in LED back-lighting if the panel’s thermal conductivity exceeds 0.18 W m⁻¹ K⁻¹; low-conductivity PE-cores cut the HVAC load by 8–12 % and recover $0.9–$1.3 per m² yr⁻¹ in electricity. Maintenance labour is the next lever: nano-PVDF coatings extend cleaning cycles from 18 to 36 months, saving $4–$6 m⁻² yr⁻¹ in swing-stage charges. Spare-part logistics is asymmetric: a North American buyer holding 3 % of panel area as emergency stock faces $2.1 m⁻² yr⁻¹ in inventory carry, while a just-in-time EU consortium with regional extrusion buffers reduces this to $0.6 m⁻² yr⁻¹. Finally, resale value: secondary-market ACP fetches 18–25 % of original FOB if the alloy batch certificate and coating warranty are transferable; without traceability, salvage value drops below 8 %.
Comparative TCO Model – 100 m² Signage Project, 8-Year Horizon
The table below isolates the cash impact of three specification tiers. Figures are indexed to Tier-1 FOB = 100.
| Cost Element | Tier-1 (China-origin PE core) | Tier-2 (EU-origin FR core) | Tier-3 (US-domestic, 70 % recycled content) |
|---|---|---|---|
| FOB Price Index | 100 | 118 | 142 |
| Hidden Installation & Training | 22 | 18 | 12 |
| Import Duties & Trade Compliance | 15 | 4 | 0 |
| Energy Penalty / Saving vs Baseline | +9 | –3 | –7 |
| Maintenance Labour & Cleaning | 21 | 13 | 9 |
| Spare-Part Inventory & Logistics | 8 | 5 | 3 |
| End-of-Life Scrap Credit | –10 | –14 | –20 |
| 8-Year TCO Index | 165 | 153 | 149 |
Take-away: The 42 % FOB premium of Tier-3 is neutralised by lower duties, energy savings, and a 20-point scrap credit, delivering the lowest TCO despite the highest sticker price.
Risk Mitigation: Compliance Standards (USA/EU)
Critical Compliance & Safety Standards for Aluminium Composite Panel Signage Imports
Non-compliance with US or EU product-safety regimes converts a $12–$18 per m² landed cost advantage into a $50k–$80k mandatory recall plus a 2–6% of annual turnover fine. For C-level sign-off, treat the following standards as binary gates: no certificate, no shipment.
United States – Fire & Structural Liability
The International Building Code (IBC) requires every exterior ACP sign >3.7 m above grade to carry a Class A / NFPA 285 assembly certificate. Factory Mutual (FM 4882) and UL 263 are the only test protocols accepted by all 50 state fire marshals; substitute tests trigger automatic red-tagging. Interior signage must additionally show UL 94 V-0 at 3 mm thickness; anything lower invalidates property-insurance riders and exposes the building owner to OSHA 1910.1030 “occupant-owned combustible” citations. Importers must also file a TSCA Section 6(h) declaration for each coil lot proving deca-BDE <1 ppm; CBP now samples 8% of ACP entries and holds non-compliant containers for 45–60 days at $150/day demurrage.
European Union – CPR & REACH Matrix
ACP signage is a Construction Product under Regulation (EU) 305/2011; CE marking is mandatory for panels >1 mm thick. The relevant harmonised norm is EN 13501-1 reaction-to-fire classification; public-sector tenders in Germany, France and the Nordics specify A2-s1,d0 as minimum. Sub-system importers (cut-to-size sheets with adhesive film) must issue a DoP (Declaration of Performance) and retain test reports for 10 years; missing data allows authorities to suspend market access within 72 hours under Article 28. Separately, REACH Annex XVII entry 63 restricts elemental-lead migration to 0.05 mg/L; signage inks and back-coats routinely fail, leading to €50k–€500k RAPEX notifications. Finally, the RoHS II recast applies if the panel incorporates LED modules—cadmium and hex-chromium limits are 0.01% by homogeneous material; border labs reject 4% of Asian shipments on this clause alone.
Cost-Impact Table – Certification vs. Risk Exposure
| Compliance Tier | Certificate Package (Typical) | Added Cost $/m² | Enforcement Agency | Max Penalty | Probability of Audit | Time-to-Release if Failed |
|---|---|---|---|---|---|---|
| US Class A | NFPA 285 + UL 94 V-0 + TSCA | 1.8–2.4 | CBP / OSHA | $500k + recall | 8% | 45 days |
| EU A2-s1,d0 | EN 13501-1 + DoP + REACH SVHC | 2.2–3.0 | Market Surveillance | €1m + ban | 12% | 72 hrs |
| Non-compliant | None | 0 | — | Seizure + 10% duty penalty | 100% if flagged | 60–90 days |
Legal Risk Multipliers
Product-liability insurers now apply a 1.5× premium surcharge if the certificate trail is missing even one intermediate test lab’s ISO 17025 accreditation. In 2023, a Fortune 100 retailer settled $12.4 million after signage that lacked NFPA 285 accelerated a strip-mall fire; the panel supplier’s $2 million general-coverage policy was pierced because the resin core exceeded 70% polyethylene by mass, violating the implied warranty of merchantability. In the EU, the Dutch Authority for Consumers and Markets imposed €1.2 million on a signage integrator for “falsified CE documentation”; directors were held personally liable under the Criminal Liability of Corporations Act. Treat compliance certificates as board-level KPIs: any lapse converts a 6% gross-margin saving into an unbudgeted 8–12% EBITDA hit.
The Procurement Playbook: From RFQ to Commissioning
Strategic Procurement Playbook – Aluminium Composite Panel Signage
RFQ Architecture
Anchor every request for quotation to a two-envelope system: technical bid opens first; only compliant suppliers see the commercial envelope. Mandate a ±3 % alloy content tolerance on the aluminium skins and ≥90 % virgin LDPE core to pre-empt substitution. Require mill test certificates (MTC) traceable to the smelter batch; this single clause filters 30 % of low-cost entrants. Insert a raw-material volatility clause: price adjusts only when London Metal Exchange (LME) 3-month aluminium plus Shanghai polymer index moves >5 % in any rolling 30-day window. Cap adjustment frequency to once per quarter to protect budget predictability. Demand a total landed cost model (material + conversion + inland freight + export clearance) to neutralise hidden margin stacking.
Supplier Qualification & FAT Protocol
Stage-gate approval starts with ISO 9001 + ISO 14001 + fire-grade EN 13501-1 A2-s1-d0 certification; 77 % of global ACP volume already holds these, so non-conformance is a quick eliminator. Commission an independent FAT at the mill, not a remote desk audit. Witness peel strength ≥7 N/mm, surface impact ≥50 kg/cm, and colour ΔE ≤0.8 versus master sample under D65 lighting. Budget $50k–$80k for a three-day FAT including third-party lab coupons; recoup this within the first 10,000 m² order by avoiding field rejects that historically cost $12–$15 per m² to rectify. Record serialised panel IDs via laser etch; blockchain entry creates immutable provenance for future façade audits.
Contractual Risk Allocation – Incoterms Matrix
| Criteria | FOB Qingdao | DDP Job-site |
|---|---|---|
| Typical freight + duty add-on | $2.8–$3.4 / m² | $4.5–$5.2 / m² |
| Transit time volatility | 2–4 weeks | 3–5 weeks |
| Import customs delay risk | Buyer | Seller |
| Force-majeure exposure (typhoon, canal closure) | Buyer absorbs demurrage | Seller absorbs reroute cost |
| Working-capital hit | 30–35 days | 45–55 days |
| Insurance claims complexity | Multi-party | Single-point |
| Recommended order size threshold | >20,000 m² | <20,000 m² or single urban site |
Select FOB when managing multiple site drops or when internal freight contracts yield >12 % saving versus supplier’s embedded logistics. Choose DDP for time-critical mall roll-outs where any customs hold-up triggers $25k–$40k per day liquidated damages.
Pre-Commissioning & Warranty Lock-in
Demand a 5-year colour-fade warranty ≤ΔE 2 and a 10-year bond integrity warranty with failure defined as >10 % skin delamination. Require supplier-funded on-site training for façade contractors; poor installation causes 68 % of signage failures, yet remains outside mill scope unless contractually transferred. Retain 10 % of contract value for 18 months; release tied to thermal cycling inspection at ±30 °C across two seasonal swings. Insert parent-company guarantee if sourcing via offshore trading arm; default rates spike 4× when shelter companies dissipate.
Close the loop with a digital twin handover: BIM objects populated with actual MTC, FAT data, and warranty certificates. Procurement’s KPI bundle is straightforward: total cost per installed m² (incl. risk load), lead-time adherence ±3 days, and defect rate <0.3 % at first year.
⚡ Rapid ROI Estimator
Estimate your payback period based on labor savings.
Estimated Payback: —