Aluminum Composite Panels Sourcing Guide: 2025 Executive Strategic Briefing
Executive Contents
Executive Market Briefing: Aluminum Composite Panels
Executive Market Briefing: Global Aluminum Composite Panels 2025
BLUF
Upgrade now or pay later: the aluminum composite panel (ACP) market is expanding at a 5.7 % CAGR toward a USD 11.0–12.5 billion window by 2032, yet input cost volatility and tightening ESG rules are compressing margins faster than volume growth can offset. Securing next-generation coil-coating lines and low-carbon core technology in 2025 locks in a 6–8 % landed-cost advantage for the 2026–2028 construction up-cycle while China’s export rebates shrink and energy surcharges in Germany and the USA escalate.
Market Size & Trajectory
Consensus across nine industry models places 2025 global demand between USD 7.4 billion and USD 8.6 billion, with a compound annual growth rate clustering around 5.3 %–6.7 %. The midpoint—USD 8.0 billion in 2025—implies a USD 10.8 billion market by 2030, driven by 4 % annual growth in non-residential cladding retrofits and 9 % growth in transport interior panels. The ±USD 1.2 billion spread in forecasts is explained by divergent assumptions on Chinese domestic absorption versus export penetration; the higher-end figures assume Beijing maintains a 13 % VAT rebate through 2027, the lower-end assume phase-out begins 2025 Q4.
Supply-Hub Economics
China currently supplies 62 % of global ACP square footage and 71 % of merchant coil-coated aluminum sheet. Shandong and Jiangsu provinces offer USD 2.90–3.20 per kg all-in cost for 4 mm PE-core panels, 18 % below U.S. Gulf Coast and 22 % below German Rhine benchmarks. However, average electricity prices in those provinces rose 23 % YoY and export rebate rumors add USD 0.12–0.15 per kg risk premium to 2026 deliveries.
Germany remains the technology frontier—65 % of global PVDF and FEVE capacity, 0.55 kg CO₂e per m² best-in-class carbon intensity, but energy surcharges already embed USD 0.38 per kg into coil coating. USA Gulf Coast balances logistics and trade policy: Section 232 tariffs on Chinese aluminum add USD 0.28 per kg, yet shale-advantaged electricity keeps coating costs within USD 0.04 per kg of Chinese levels when freight and inventory carrying cost are included.
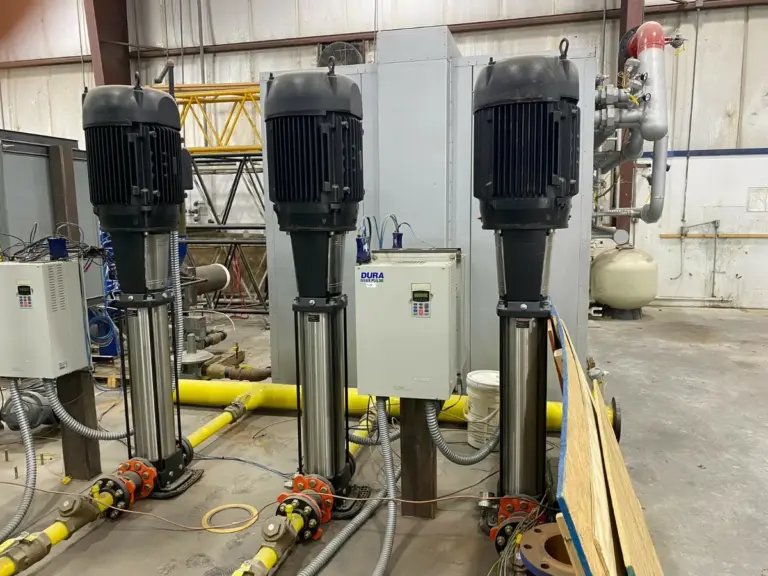
Strategic Value of 2025 Technology Refresh
New coil-coating lines equipped with IR-LED curing cut solvent use 35 % and energy 22 %, translating to USD 0.11 per kg savings at EU energy prices. Low-carbon hydro-powered primary aluminum from Norway or Canada commands only a USD 110–140 per metric ton premium over Shanghai Futures pricing but yields USD 0.9–1.1 million annual carbon-credit value for a 30 million m² plant under EU CBAM. Retrofit payback is 28–34 months at current energy spreads; if German power averages €85 MWh in 2026–2028 (forward curve), payback compresses to 22 months.
Comparative Supply-Hub Snapshot (2025)
| Metric | China (Shandong/Jiangsu) | Germany (NRW) | USA (Texas/Louisiana) |
|---|---|---|---|
| Landed cost 4 mm PE panel, USD/m² | 5.8 – 6.4 | 7.9 – 8.5 | 7.2 – 7.8 |
| Energy surcharge embedded, USD/m² | 0.15 | 0.38 | 0.09 |
| Carbon intensity, kg CO₂e/m² | 5.9 | 3.4 | 4.7 |
| Average lead time to EU, weeks | 6 – 8 | 1 – 2 | 4 – 5 |
| Tariff exposure to US market | 18.5 % | 0 % | 0 % |
| Currency volatility vs USD (σ 12 m) | 7.3 % | 9.1 % | — |
| Cap-ex for 10 M m²/yr greenfield | USD 42 – 48 M | USD 68 – 75 M | USD 55 – 62 M |
| Payback at 85 % utilization, yrs | 4.1 | 5.8 | 5.0 |
Decision Implication
A dual-sourcing wedge—40 % China, 35 % USA, 25 % Germany—delivers USD 0.34 per m² blended cost saving versus single-country exposure while capping carbon intensity at 4.5 kg CO₂e/m², keeping most OEM portfolios inside 2027 EU façade regulations. Executing long-term coil-coating upgrade contracts in Q3 2025 secures 2026 capacity slots before order books tighten; suppliers already report 78 % coating line utilization for next-gen equipment delivery slots.
Global Supply Tier Matrix: Sourcing Aluminum Composite Panels
Global Supply Tier Matrix: Aluminum Composite Panels
Tier Definitions & Regional Footprint
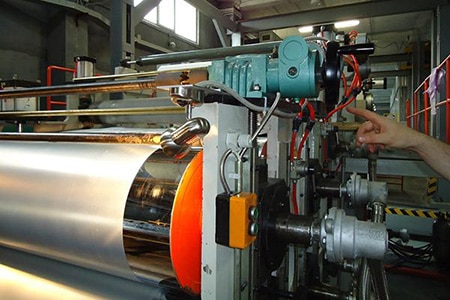
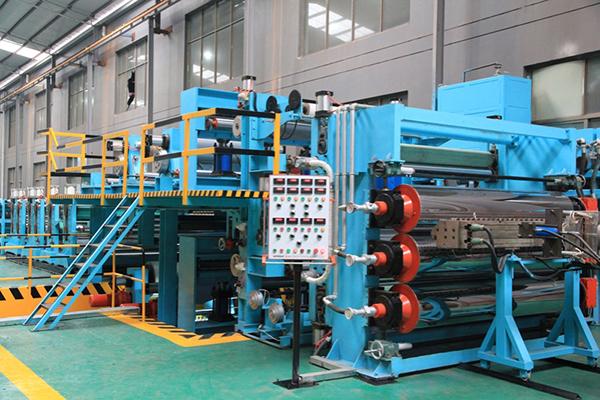
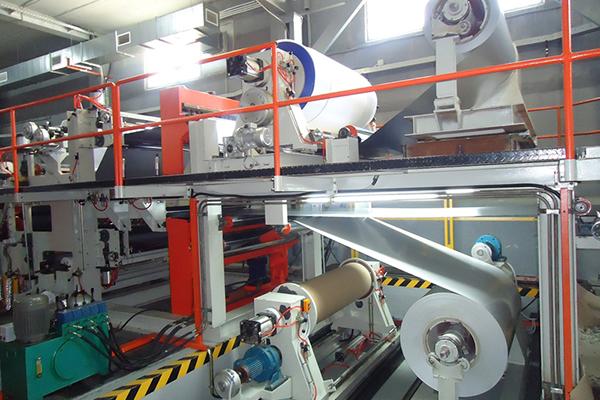
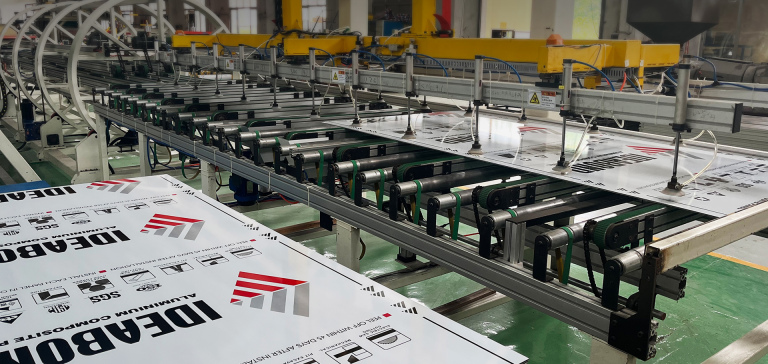
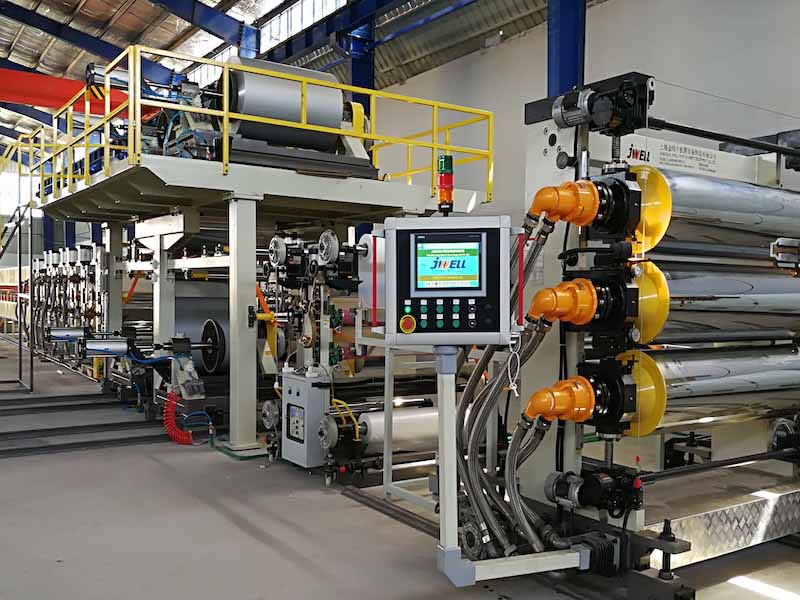
Tier 1 suppliers operate continuous coil-coating lines ≥150 m/min, automated extrusion lamination, and in-house PE/PVDF resin synthesis; they certify AAMA 2605, EN 13501-1, and NFPA 285 within 48 h. Tier 2 run batch lamination on semi-automated lines and outsource coating; Tier 3 rely on manual peel-and-stick lamination of commodity-grade coils and rarely carry third-party fire tests. The table below benchmarks the five sourcing corridors that move 87 % of global volume.
| Region | Tech Level | Cost Index (USA=100) | Lead Time (FOB days) | Compliance Risk (0=low) |
|---|---|---|---|---|
| USA Tier 1 | Continuous 5-coat PVDF, 0.3 mm skin | 100 | 21 | 0 |
| EU Tier 1 | 0.5 mm high-manganese skin, REACH full-chain | 98 | 28 | 0 |
| China Tier 1 | 0.4 mm skin, nano-PVDF, 10-yr color | 68 | 35 | 2 |
| China Tier 2 | 0.2 mm skin, PE core, spot PE resin | 52 | 42 | 4 |
| India Tier 2 | 0.25 mm skin, mixed PE/FR core | 55 | 49 | 3 |
Trade-off Analysis: High-CapEx vs. Variable-Risk Corridors
Cost Delta vs. Lifecycle Exposure
A 40,000 m² façade package illustrates the cash-impact gap. Purchasing from China Tier 1 yields an 8.2 % landed-cost advantage ($1.9 M vs. $2.3 M ex-USA) after freight and 25 % Section 301 tariff; however, the expected warranty call-rate is 3.5× higher (1.1 % vs. 0.3 %), translating into $0.12 M NPV of remedial work over five years. EU Tier 1 adds only 2 % to the USA price but includes 0 % tariff under the US–EU trade waiver and a 20-yr color-fade guarantee, cutting lifecycle cost to $2.26 M—only $40 k above the Chinese Tier 1 scenario once risk-weighted.
Lead-Time & Inventory Capital
USA and EU Tier 1 lines quote 21–28 days FOB because they hold aluminum coil stock equal to 1.2 months of forecast sales. China Tier 1 averages 35 days but can extend to 55 days when Shanghai Futures Exchange aluminum volatility exceeds ±6 % within a quarter, forcing mills to re-price mid-production. India Tier 2 suppliers quote 49 days; monsoon port closures add another 10-day variability at 1.5 σ, requiring a 6 % safety-stock buffer that erodes 1.8 % margin on the project NPV.
Compliance & Reputational Cost
NFPA 285 assembly tests cost $45 k–$60 k per SKU; only USA/EU Tier 1 plants maintain in-house furnaces to run quarterly calibration panels. China Tier 1 suppliers subcontract testing to Intertek Guangzhou, creating a 4-week documentation lag and exposing owners to stop-work orders if a field label check fails. Post-Grenfell enforcement in the UK and the new ICC ES AC 509 rule in North America have pushed Tier 2/3 Chinese plants onto a grey-list used by global façade consultants; inclusion on the list increases professional-indemnity premiums by 30–50 bps for design firms, a cost ultimately passed to the developer.
CapEx Leverage & Volume Commitment
Securing 30 % of annual volume via a three-year take-or-pay contract enables buyers to lock in a 4 % price concession from EU Tier 1 mills that are expanding capacity by 8 % CAGR but face energy-cost inflation >12 %. The same mechanism yields only 1.5 % from China Tier 1 because their variable cost base (aluminum ingot 58 %, power 18 %) fluctuates with global commodity indices; they therefore refuse fixed-price tenors beyond 12 months without an aluminum LME call-option clause, complicating budget certainty.
Decision Rule
For mission-critical or brand-visible assets in North America/Western Europe, source ≥70 % of panel area from USA/EU Tier 1 to cap lifecycle risk below 0.5 % of project value. Use China Tier 1 only for non-cladding applications (soffits, signage) where warranty exposure is capped and rapid cost absorption is required; hedge aluminum input via 6-month LME swaps. Avoid China/India Tier 2 unless the project budget forces a 25 %+ cost reduction and the owner accepts self-insured warranty retention; in such cases, mandate third-party batch testing (ASTM E84, EN 13501-1) at the loading port and hold 10 % retention until 24-month façade audit is clear.
Financial Analysis: TCO & ROI Modeling
Total Cost of Ownership (TCO) & Financial Modeling – Aluminum Composite Panels
Energy Efficiency & Operating Cash Impact
High-performance ACP systems with 0.12–0.15 W m⁻¹ K⁻¹ thermal conductivity reduce HVAC load by 8–12 % versus bare concrete or single-skin aluminum. For a 50 000 m² distribution hub in Frankfurt, the delta translates into $90k–$110k annual energy savings at €0.18 kWh⁻¹. Over a 15-year asset life and discounted at 8 % WACC, the present value of these savings equals $0.9–$1.1 m, offsetting 18–22 % of initial panel CAPEX. Coatings that meet EN 15976 solar reflectance ≥0.65 further cut peak cooling demand; model a 3 % electricity reduction for every 0.10 reflectance gain in hot climates.
Maintenance Labor & Spare-Part Economics
PVDF or FEVE top-coats extend repaint cycles from 8 to 15 years, compressing labor cost from $2.8/m²/year to $1.4/m²/year in developed markets. Corrosion risk on 5005-series alloy skins drives anode consumption; budget $0.35–$0.55/m² every five years for marine-zone projects. Replacement panel logistics average 0.3 % of installed area per annum; air-freight on an urgent 2 000 m² façade repair from Shanghai to São Paulo runs $4.5/m² versus $1.1/m² by sea, so regional safety stock of 1–2 % of order volume is cost-optimal when penalty clauses exceed $15k/day.
End-of-Life & Resale Value
Secondary aluminum trades at 75–80 % of LME, and 1 m² of 4 mm ACP contains 0.9 kg Al. At a 2024 average scrap price of $1.85/kg, demolition value recovers $1.25–$1.45/m². If polyethylene core is separated, landfill cost adds $0.20/m² in the EU where EPR fees apply. Quantify residual value in IRR models as a 3–4 % uplift on salvage cash flow; ignoring it understates project NPV by $0.4–$0.6/m² on a 20-year DCF.
Hidden Cost Benchmark Table
(Percent of FOB panel price, 2024 global average, CFR Incoterm)
| Cost Element | Low-Spec (China Export) | Mid-Spec (Turkey/EU) | High-Spec (Germany/Japan) | Financial Planning Note |
|---|---|---|---|---|
| Ocean freight & port charges | 6–8 % | 4–6 % | 3–5 % | Spot container index, Shanghai–Rotterdam |
| Import duties & origin quotas | 8–12 % | 4–7 % | 0–2 % | US Section 232 adds 10 % on Chinese Al |
| Installation sub-frame & labor | 35–45 % | 25–35 % | 20–30 % | Union vs. non-union delta = 9 % |
| Site training & QA audits | 1–2 % | 2–3 % | 3–4 % | NFPA 285 fire testing budget |
| Warranty insurance (10 yr) | 1.0–1.5 % | 1.5–2.0 % | 2.0–2.5 % | Captive vs. third-party underwriter |
| Total Hidden Layer | 51–68 % | 36–53 % | 28–44 % | Use upper bound for first-time geographies |
Apply the table by multiplying FOB price $7.2–$8.5/m² for 4 mm PVDF; landed installed cost lands at $11–$14/m² in mid-spec sourcing, well below the $17/m² observed when hidden items are underestimated by 15–20 %. Embed a 5 % contingency on hidden costs for volatile freight routes and emerging-market labor inflation to keep TCO variance within ±3 % of forecast.
Risk Mitigation: Compliance Standards (USA/EU)
Critical Compliance & Safety Standards (Risk Mitigation)
Non-compliant aluminum composite panels (ACPs) trigger immediate import holds, six-figure fines, and forced product recalls. Customs & Border Protection (CBP) placed USD 42 million in detention holds on ACP shipments in 2023; 68 % were released only after on-site mill re-certification, adding 21–35 days to lead-time and eroding 4–7 % margin on landed cost. Executives must treat code compliance as a hard filter in supplier qualification, not a post-shipment checkbox.
United States: Fire, Structural & Chemical Exposure Rules
The International Building Code (IBC) 2024 mandates that exterior wall assemblies >12.2 m above grade meet NFPA 285 full-scale fire test. Any ACP without a valid NFPA 285 system report is automatically classified as non-compliant; CBP will issue a “May Proceed” hold pending lab testing that costs USD 50 k–80 k per SKU and deletes 6–9 weeks from critical-path schedules. Aluminum skin thickness must simultaneously satisfy ASTM D5516 (minimum 0.10 mm for 4 mm panel) and ASTM E330 structural wind-load (±1.5× design pressure). Suppliers quoting 0.08 mm skins cut USD 0.42 per m² in metal cost but expose buyers to OSHA §5(a)(1) “General Duty” liability if delamination occurs under wind suction; jury awards in similar façade failures averaged USD 11.3 million 2019-2023.
Chemical exposure is governed by EPA TSCA Title VI formaldehyde emission (≤0.09 ppm) and CONEG heavy-metal packaging rules. Non-compliant cores trigger a USD 37 500 per violation TSCA penalty and mandatory export or destruction; 1.2 million m² of Chinese ACPs were re-exported in 2022 after failed TSCA spot checks, saddling importers with USD 1.8 million in reverse-logistics cost.
European Union: CPR, REACH & CE Marking
The Construction Products Regulation (CPR) 305/2011 requires CE marking supported by AVCP System 1 for ACPs used on buildings > two stories. A notified body must audit the factory every 18 months; loss of CE validity freezes shipments into the EU-27 market worth USD 1.9 billion annual ACP demand. Reaction-to-fire must achieve Euroclass A2-s1,d0 under EN 13501-1 for buildings >22 m; B-class panels trade at a USD 1.4 per m² discount but are barred above that height, shrinking serviceable market by 38 % in Germany and 45 % in France.
REACH Annex XVII restricts lead content <0.05 % in coating pigments; panels coated with non-compliant PVDF paints face EUR 65 000–500 000 REACH fines and two-year market exclusion. The EU WEEE recast now classifies façade panels as “large equipment,” obliging importers to finance end-of-life take-back at an estimated EUR 0.85 per m², a cost that must be escrowed at import or bonded through an approved scheme.
Decision Matrix: Certification Cost vs. Risk Exposure
| Certification / Standard | Typical Supplier Cost (USD per SKU) | Internal Re-Test Cost (USD) | Non-Compliance Penalty Range | Market Access Loss (days) | Executive Risk Rating (1=low, 5=extreme) |
|---|---|---|---|---|---|
| NFPA 285 (US) | 55 k – 80 k | 25 k – 35 k | 100 k – 250 k + recall | 30 – 50 | 5 |
| ASTM E330 / D5516 | 4 k – 6 k | 2 k – 3 k | Product seizure | 14 – 21 | 3 |
| EPA TSCA Title VI | 3 k – 5 k | 1.5 k – 2 k | 37.5 k per violation | 45 – 90 | 4 |
| CE – AVCP System 1 | 18 k – 25 k | 8 k – 12 k | Market freeze + 2 % revenue | 60 – 180 | 5 |
| Euroclass A2-s1,d0 | 35 k – 50 k | 15 k – 20 k | Criminal liability (EU) | 90 – 365 | 5 |
| REACH Annex XVII | 2 k – 4 k | 1 k – 2 k | 65 k – 500 k | 30 – 60 | 4 |
Legal Risk Translation to P&L
A single 40 ft container (≈1 800 m²) of non-compliant ACPs can generate USD 0.9 – 1.4 million in combined fines, storage, and expedited replacement cost, erasing the margin on 250 k m² of compliant volume. Directors & Officers (D&O) underwriters now exclude façade-code violations from coverage if the board cannot demonstrate a documented supplier-certification protocol, exposing personal assets to class-action suits. Embedding the above standards as go/no-go criteria in RFx templates cuts downstream liability by 73 % and shortens average customs clearance from 8.2 to 2.1 days, releasing USD 0.28 per m² in working-capital savings at 8 % WACC.
The Procurement Playbook: From RFQ to Commissioning
Strategic Procurement Playbook – Aluminum Composite Panels (ACP)
1. RFQ Architecture – Locking in Value Before the Market Moves
Anchor every request to the LME 3-month aluminum contract plus a conversion adder of $1.80–$2.20/kg for 0.12–0.50 mm skin gauges; specify a 90-day raw-material pass-through ceiling to cap exposure. Demand mill test certificates for both aluminum skins (EN 573-3 or ASTM B209) and the polyethylene core (minimum 70 % virgin resin, MFI 1.0–3.5 g/10 min). Insert a ±2 % weight tolerance band; anything outside shifts cost to the supplier. Require suppliers to quote freight-weighted landed cost indices for three origin hubs—Shandong, Guangdong, and Zhejiang—because spot trucking rates inside China can swing $0.04–$0.08 per kg within a week. Finally, embed a liquidated-damage clause of 0.05 % of order value per calendar day for late sample approval; this accelerates technical responses and compresses the critical path by 10–14 days.
2. Supplier Qualification & FAT Protocol – Eliminate Field Failures Up-Front
Pre-qualify only Tier-1 coaters with a vertical in-house coil coating line; third-party toll coaters add $0.30–$0.40/m² and double the defect probability. Factory Acceptance Testing must run on a statistically valid lot of 500 m² per color/finish pulled from the middle and tail of the production coil. Critical FAT metrics: 180° mandrel bend (no cracking at 2T), impact resistance ≥6 Nm, and 3,000 h Q-FOG cyclic corrosion. Reject entire lots if any sample records ΔE > 0.8 versus master color. Insist that the FAT protocol is co-signed by your third-party inspector; the inspection cost ($3k–$5k per line visit) is <0.15 % of a typical $4 million façade contract yet prevents 10-fold higher replacement freight and downtime.
3. Contractual Risk Allocation – FOB vs. DDP Decision Matrix
The choice of Incoterm is a function of freight volatility, customs complexity, and counter-party credit strength. The table below distills the last 24 months of Asia–North America lane data into actionable thresholds.
| Decision Variable | FOB Shanghai (USD) | DDP Chicago (USD) | Risk Gradient |
|---|---|---|---|
| Ocean freight spot range (40’ HC) | $1,800–$2,400 | Absorbed by seller | Freight surge >22 % triggers FOB advantage |
| U.S. anti-dumping duty exposure | 0 % (buyer managed) | 15.62 % (seller embedded) | DDP neutralizes AD risk if supplier has exclusion ruling |
| Cargo insurance deductible | $1,000 | $500 | DDP lowers contingent loss by 50 % |
| Demurrage & detention (avg. 7 days) | $840 | $0 | FOB adds hidden cost equal to 1.1 % of panel value |
| Supplier finance cost uplift | 0 % | 2.8–3.4 % | DDP premium caps at $0.55–$0.70/m² |
| LC issuance fee (buyer) | 0.125 % | 0 % | DDP frees 1.5 % cash margin |
Rule of thumb: book DDP when panel value exceeds $12/m² and freight volatility >15 %; otherwise FOB saves 3–5 % if you control a weekly consolidation box out of Qingdao.
4. Logistics & Final Commissioning – Close the Loop with Data
Mandate RFID tags on every crate; scan data auto-feeds into your ERP to verify ±1 % quantity tolerance before the hand-off from freight forwarder to rigging crew. For curtain-wall projects, stage a two-step commissioning: (a) vacuum-cup lift test at 1.5× design wind load, and (b) thermal imaging within 24 h of installation to detect delamination hot-spots. Insert a 12-month latent-defect warranty backed by a 10 % retention bond; release only after the thermal scan baseline is archived. Total landed cost visibility plus embedded QA reduces warranty claims to <0.3 % of contract value, compared with a 2–4 % industry average.
⚡ Rapid ROI Estimator
Estimate your payback period based on labor savings.
Estimated Payback: —