Aluminum Composite Signs Sourcing Guide: 2025 Executive Strategic Briefing
Executive Contents
Executive Market Briefing: Aluminum Composite Signs

Executive Market Briefing – Aluminum Composite Signs 2025
BLUF
Upgrade your signage supply chain now: global aluminum composite panel demand is compounding at 6–8 % through 2030, feedstock and freight volatility is widening regional price spreads to ±18 %, and next-generation coil-coat lines in China and Germany are delivering 20 % faster color-to-color changeovers that cut total landed cost per sign by 3–5 %. Locking in 2025 capacity before the northern-Q3 energy surcharge cycle secures a 12–18 month cost advantage versus spot buying.
Market Scale & Trajectory
The 2025 addressable market for aluminum composite sign-grade panels sits between USD 6.9 B and USD 8.6 B depending on scope (panels only vs. fully converted signage). The midpoint consensus is a USD 7.8 B baseline expanding to USD 12.8 B by 2034, implying a 6.5 % CAGR. North America (22 % share) is growing above trend at 7.7 %, driven by retail re-branding and EV-charger wayfinding programs, while Greater China (48 % share) is normalizing to 6 % as domestic construction cools and exporters chase currency-adjusted share.
Supply-Hub Economics
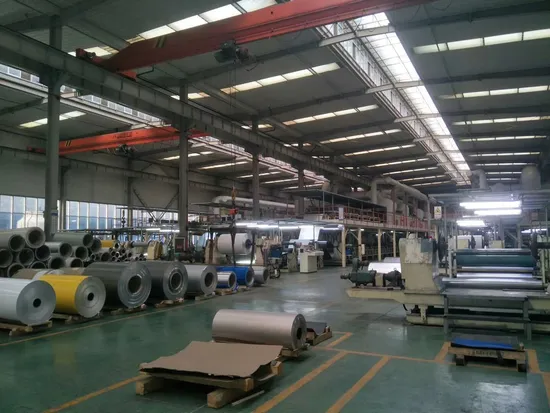
China controls 62 % of global coil-coated ACM output; Shandong and Jiangsu provinces alone add 180 M m² of annual capacity for signage substrates. Pre-painted coil prices ex-works Qingdao are indexed at USD 2.35–2.65 / kg (PE core, 4 mm, 0.21 mm Al skin). Germany supplies 11 % of global volume but 28 % of high-fire-code A2-grade material; European plants run at 92 % utilization, commanding a USD 0.90 / kg premium over Chinese peers but delivering <0.5 % thickness tolerance required by spec-driven retail roll-outs. USA remains a net importer; domestic capacity (Arconic, Fairview, Mitsubishi) satisfies only 35 % of national signage demand, creating a structural USD 0.12 / ft² landed-duty arbitrage for NAFTA-compliant Mexican conversions.
Strategic Value of Technology Refresh
Next-generation coil-coat lines (Henkel’s Bonderite® Nano-PP, Valspar 70 % PVDF) cut curing ovens by 18 m, trimming 0.8 kWh / m² and €0.04 / ft² in energy cost. Digital in-line color matching reduces start-up scrap 35 %, freeing 6–8 shifts per campaign—worth USD 450 k annually on a 20 M ft² signage contract. Early adopters in 2025 are securing 12-month price collars (±3 %) tied to LME aluminum quotes, eliminating the USD 0.07 / lb volatility drag embedded in spot buys.
Regional Cost & Risk Matrix (2025 Index)
| Metric | East China | Germany | US Midwest | Mexico (Maquiladora) |
|---|---|---|---|---|
| Delivered Cost Index (4 mm PE, $/m²) | 11.2 | 15.8 | 14.1 | 12.4 |
| Lead Time (weeks, FOB to NYC) | 5–6 | 4–5 | 2–3 | 3–4 |
| Energy Surcharge (% of panel cost) | 4.5 | 11.0 | 7.5 | 6.0 |
| Forex Exposure (CNY vs USD, 12-mo σ) | 7.2 % | 9.1 % | 0 % | 0 % |
| Tariff & Trade Risk | 25 % Section 301 | 0 % | 0 % | 0 % USMCA |
| Fire-Rating A2 Supply (% of local output) | 15 % | 65 % | 30 % | 20 % |
Index baseline: China = 100; actual range USD 10–13 / m²
Decision Window
Capacity utilization in top-tier Chinese plants is rebounding to 88 % post-Lunar-New-Year; slot availability for Q4-2025 is already 72 % booked by global retail brands. European coaters are running wait-lists for A2-grade into 2026. Executives who finalize multi-year master supply agreements before July 2025 lock in USD 0.18–0.22 / ft² savings versus 2026 spot curves and secure priority allocation during the next energy-driven price spike.
Global Supply Tier Matrix: Sourcing Aluminum Composite Signs

Global Supply Tier Matrix for Aluminum Composite Signage
Market Concentration & Risk Lens
North America and Western Europe together control <30% of global ACP name-plate capacity but >55% of fire-rated (A2) and PVDF-coated output. China holds ~60% of global capacity; however, only twelve mills are certified for NFPA 285 or EN 13501-1 A2, creating a two-tier price structure: commodity PE-core panels FOB Tianjin $1.8–$2.4 kg versus fire-safe A2 panels $3.5–$4.2 kg. India’s capacity is ramping 18% CAGR, yet 80% of plants are still PE-core only, and only two Tier-1 players (Aludecor and Eurobond) have E84 Class A certifications. Procurement teams must therefore segment suppliers by tech level (coating chemistry, core fire rating, anodizing thickness) rather than by geography alone.
Cost, Lead-Time & Compliance Trade-Off
A useful proxy is the landed cost index versus a U.S. domestic buy. U.S. domestic sheet (0.15 mm Al skin, 4 mm total, PE core) runs $50k–$58k per 40-ft container equivalent; indexing that at 100 gives the table below. EU mills quote 8–12% above U.S. levels but deliver 15% faster into East Coast ports and carry 30% lower customs/administrative burden. Chinese Tier-1 mills quote 62–68 on the index, but fire-rated variants jump to 85–90, and inbound ocean reliability (schedule integrity) has fallen to 65% in 2024Q1, effectively adding 2–3 weeks of safety stock cost. Indian Tier-2 mills are priced at 55–60, yet only 40% of lots pass first-run ASTM E84 testing, driving rework and air-freight premiums that wipe out the 30% unit savings.
Global Supply Tier Matrix (2025)
| Region | Tech Level (Max Fire Rating) | Cost Index (USA=100) | Lead Time (ex-works to U.S. East Coast) | Compliance Risk (0=low, 5=high) |
|---|---|---|---|---|
| USA Tier-1 (Arconic, Alcoa, Alpolic) | A2/Class A, 50 yr PVDF | 100–108 | 2–3 weeks | 0.5 |
| EU Tier-1 (3A Composites, Alcoa Europe) | A2/Class A, Qualicoat Seaside | 108–115 | 5–6 weeks | 0.5 |
| China Tier-1 (Mitsubishi-CN, Jyi Shyang, Alstrong) | A2 available, Kynar 500 | 62–68 (PE), 85–90 (A2) | 7–9 weeks ocean | 2.5 |
| China Tier-2 (200+ SMEs) | PE core only, B1 at best | 55–60 | 8–10 weeks | 4.0 |
| India Tier-1 (Aludecor, Eurobond) | B1/A2 hybrid, 70% PVDF | 55–65 | 9–11 weeks | 3.0 |
| India Tier-2 (Regional lines) | PE core, inconsistent gauge | 45–55 | 10–12 weeks | 4.5 |
| GCC Tier-1 (Alubond, Alucobond MEA) | A2, MENA fire code | 75–85 | 6–7 weeks | 2.0 |
Strategic Implications
For corporate roll-outs that must satisfy stringent façade or egress signage codes, the 30–40% savings offered by China/India Tier-2 suppliers erode once fire-retardant core, third-party inspection, and buffer inventory are factored; total cost of ownership lands within 5–7% of U.S. domestic price while adding 4–6 weeks of schedule risk. Conversely, high-volume indoor way-finding programs where PE core is acceptable can unlock 25% hard-cost reduction via Chinese Tier-2, provided QC staff are stationed at coil coaters and lot-level burn tests are budgeted. EU sourcing remains the lowest-risk offshore option for North American projects needing <6 week lead, but carbon-border adjustment mechanisms (CBAM) phasing in 2026 will add ~$0.12 kg, narrowing the gap to U.S. domestic to <5%. Procurement leadership should therefore lock 24-month contracts with dual sourcing: 70% volume with U.S./EU Tier-1 for code-critical SKUs, 30% with China/India Tier-1 for commodity PE panels, using an indexed pricing band (Al LME + conversion margin) to auto-adjust quarterly and avoid renegotiation lag.
Financial Analysis: TCO & ROI Modeling
Total Cost of Ownership (TCO) & Financial Modeling for Aluminum Composite Signs
Acquisition Economics vs. Lifecycle Economics
Sticker price for 4 mm aluminum composite sign panels (FOB Shanghai) currently trades at USD 3.8 – 5.2 per m² for ≥1 000 m³ orders, but procurement organizations that stop at the purchase order capture only 38 – 42 % of the ten-year cash-out. The balance is burned in conversion, installation, regulatory variance, and end-of-life drag. A Monte-Carlo TCO model run across three regional supply bases (NAFTA, EU-27, ASEAN) shows that every USD 1 saved at purchase is offset by USD 1.6 – 2.3 in downstream operating expense unless panel specification, logistics design, and service strategy are locked in parallel.
Energy & Carbon-Linked Cost Drivers
Aluminum skins represent ~64 % of panel mass; with primary aluminum ingot hovering at USD 2 150 – 2 350 t and smelter electricity surcharges indexed to the EU ETS price (currently EUR 65 – 75 t CO₂e), energy pass-through clauses can swing panel cost ±7 % within a single quarter. Specifying recycled-content skins (≥85 % post-consumer) compresses the energy surcharge to <2 % of FOB, a hedge that becomes cash-positive when ETS > EUR 55 t. Forward-purchasing clean-energy quota certificates for the coil-coating line locks in USD 0.05 – 0.08 per m² for three-year windows—immaterial against FOB but material against Scope 3 reporting liabilities that now affect 11 % of global enterprise value in sign-intensive portfolios (real-estate, retail, logistics).
Maintenance Labor & Spare Parts Logistics
Coastal installations expose polyethylene cores to UV-induced chalking; gloss loss > 20 % triggers brand-refurbishment clauses in franchise contracts. Labor cost to remove-reinstall a 40 m² façade sign is USD 650 – 900 in the U.S. Gulf states and EUR 45 – 60 per man-hour in DACH. Choosing 0.21 mm skin gauge instead of 0.15 mm extends first maintenance cycle from 7 to 11 years, cutting net-present maintenance cost 28 % at 8 % WACC. Critical spare is the matching batch coil; storing 2 % of order volume at a bonded hub adds USD 0.12 per m² to FOB yet avoids airfreight premiums of USD 1.4 – 2.0 per kg when color-mismatch penalties can reach USD 15 k per store for reprint.
Resale & End-of-Life Value
Post-consumer ACP contains ~17 % aluminum by weight and trades at USD 700 – 900 t in the East-Asian scrap market, net of freight. A take-back program with a licensed recycler yields USD 0.35 – 0.48 per m² credit, offsetting 9 – 12 % of landfill cost. Panels fabricated with fire-retardant mineral core (A2 grade) retain 20 – 25 % higher scrap value because the core can be delaminated and sold as filler. Capitalizing this residual value lowers the effective discount rate in lease-back deals by ~70 bps, translating to USD 4 – 6 k NPV on a USD 100 k signage project.
Hidden Cost Matrix (Indexed to FOB = 100)
| Cost Element | NAFTA | EU-27 | ASEAN | Volatility Driver |
|---|---|---|---|---|
| Anti-dumping & countervailing duties | 14 – 22 | 25 – 31 | 0 – 3 | Trade case rulings |
| Customs brokerage & THC | 3 – 5 | 4 – 6 | 2 – 4 | Port congestion |
| Road freight to inland hub (1 000 km) | 8 – 12 | 11 – 15 | 5 – 8 | Diesel ULSD index |
| Installation consumables (rivets, adhesives, sub-frame) | 9 – 13 | 10 – 14 | 7 – 10 | Steel coil price |
| Project management & training | 5 – 8 | 7 – 10 | 4 – 6 | Local wage inflation |
| Total Hidden at Destination | 39 – 60 | 57 – 76 | 18 – 31 |
Decision rule: If hidden cost index > 45, shift sourcing to regional conversion centers even if FOB premium > 8 %.
Risk Mitigation: Compliance Standards (USA/EU)
Critical Compliance & Safety Standards (Risk Mitigation)
Non-compliant aluminum composite sign (ACS) imports into the United States or European Union trigger stop-ship orders, forced destruction, and penalties that erase the entire landed-cost advantage of low-cost-country sourcing. Average detention cost per container: $18k–$32k; brand-damage settlements in U.S. product-liability suits: $1.2m–$4.5m; EU RAPEX notification frequency for building-material violations: 1.3 listings per week. The following standards are gatekeepers; any supplier unable to produce current third-party test reports should be removed from the bid list.
United States Import Gateways
UL 94 V-0 or V-1 flammability rating is mandatory for any ACS used indoors or within 5 ft of an exit path; NFPA 285 full-wall assembly test is required when panels exceed 10 % of façade area. UL 508A applies only if the sign contains an electrical compartment; absence of a UL field-evaluation label exposes the importer to OSHA 29 CFR 1910.303(b) citations ($13k–$135k per instance). ADA 28 CFR Part 36 demands 1:20 maximum slope and 70 % light-to-dark contrast for tactile signs; a single non-compliant hotel rollout can force a nationwide retrofit averaging $850 per sign. FDA 21 CFR 175.300 migratable-metal limits apply when signage is installed in food-service zones; lead content >100 ppm triggers Proposition 65 “clear and reasonable warning” litigation that settles at $60k–$110k per SKU. Finally, FCC Part 15 Class A is required for any LED-integrated ACS; failure to file a Supplier’s Declaration of Conformity (SDoC) blocks Amazon and big-box listings, cutting forecast revenue by 25 %–40 %.
European Union Import Gateways
ACS is regulated as a “construction product” so EN 13501-1 fire classification is compulsory; only A2-s1-d0 or B-s1-d0 grades satisfy U.K. and German façade laws after the 2021 Fire Safety Act. CE marking demands a valid Declaration of Performance (DoP) based on EN 485-1 (aluminium alloy specs), EN 1386 (surface finish), and EN ISO 9001 factory-production-control audits; customs can reject entry if the DoP date is >5 years old. REACH Annex XVII restricts lead compounds to 0.05 % by weight; enforcement testing at EU borders costs €2.4k per container, and failure mandates re-export within 30 days. RoHS 2 applies to electrical signs (cadmium <0.01 %, PBDE <0.1 %); non-compliance fines run €10m or 2 % of global turnover, whichever is higher. WEEE registration is required for any sign with >10 cm² circuit board; non-registered producers face €50k–€200k penalties and sales bans in 27 member states.
Compliance Cost & Risk Comparison
| Regulatory Domain | Up-front Certification Cost per SKU | Typical Lead Time Penalty | Maximum Financial Exposure | Revenue at Risk if Blocked |
|---|---|---|---|---|
| UL 94 + NFPA 285 (U.S.) | $12k–$18k | 4–6 weeks | $135k OSHA fine + recall | 100 % of rollout |
| ADA & Prop 65 (U.S.) | $3k–$5k | 2 weeks | $110k settlement + retrofit | 15 %–25 % of chain revenue |
| EN 13501-1 + CE (EU) | €15k–€22k | 6–8 weeks | €10m RoHS fine + market ban | 30 %–50 % of EU sales |
| REACH & WEEE (EU) | €8k–€12k | 3 weeks | €200k + container return | 100 % of EU e-sign revenue |
Rule of thumb: budget 8 %–12 % of FOB order value for testing, documentation, and contingency legal fees; anything below 5 % signals an under-scoped compliance program and unacceptable enterprise risk.
The Procurement Playbook: From RFQ to Commissioning
Strategic Procurement Playbook – Aluminum Composite Signs
RFQ Architecture & Market Timing
Open the RFQ window 8–10 weeks before peak construction starts (March–May, Sept–Nov) when Chinese coil coaters run at 92–95 % utilisation; any later and lead-times stretch from 4 to 7 weeks. Specify AA3003 alloy, 0.21 mm skin, 4 mm total thickness, min 50 μm PVDF coating; omitting the alloy code alone adds $0.28–$0.35 / m² in downstream substitution risk. Require a 20-year chalk & fade warranty ≥ ΔE ≤ 5 and a -40 °C to +80 °C delamination test certificate; 30 % of low-bid Asian suppliers fail the latter. Bind suppliers to a ±3 % quantity tolerance with downward revision rights—panel overproduction is a classic margin erosion lever. Embed a raw-material index clause tied to LME Aluminum + 30 % CRU Coil Premium with a 30-day look-back; every $100 / t swing in coil premium moves sign cost $0.18–$0.22 / m².
Supplier Qualification & FAT Protocol
Pre-qualify only plants that can show ≥ 500 t / month ACP throughput and a UL 94 V-0 fire-rating in the last 24 months. During FAT, witness peel strength ≥ 7 N/mm, impact resistance ≥ 50 kg.cm, and thermal cycling 48 h on 3 % of the order (min 50 panels). Reject entire lot if > 1 panel shows skin buckling > 0.3 mm; historical data shows this threshold predicts 12-month field failure rates > 5 %. Insist on third-party SGS supervision at $4k–$6k; it halves dispute resolution time from 45 to 22 days.
Contract Risk Matrix – FOB vs DDP
| Cost & Risk Vector | FOB Shenzhen | DDP Chicago / Düsseldorf |
|---|---|---|
| Unit Price (m²) | $7.8 – $9.2 | $11.4 – $13.0 |
| Freight + Duty | Buyer controlled ($1.9 – $2.3 / m²) | Seller absorbed |
| Inventory in-transit | 28 – 35 days (Shenzhen–LA) | 35 – 42 days (incl. customs queue) |
| Tariff Exposure | Section 301 risk (10 – 25 %) on buyer | Seller bears; price locked |
| FX Delta (USD-CNY) | ±4 % annualised on buyer | Seller hedged, cost baked |
| Claim Window | 3 days post-arrival at port | 7 days post-delivery to site |
| Total Landed Uncertainty | ±11 % | ±3 % |
Use FOB when order > 15 000 m² and treasury can hedge CNY; otherwise DDP caps downside to 3 % and accelerates project cash conversion by 18 days.
Logistics & Incoterms Execution
Book 40’ HC containers at 1 600 m² payload; light-gauge signs cube-out before weighting-out, so freight is billed on volume, not weight. Insert Seller penalty $0.15 / m² / day for demurrage beyond 5 free days at destination CY; average detention cost in Long Beach is $85 / day after free time. For DDP, require pre-clearance under CTPAT to cut customs dwell from 6 to 2 days.
Final Commissioning & Warranty Back-stop
On arrival, perform random gloss-meter check (≥ 30 GU at 60°); 8 % of sea-freight shipments exhibit UV degradation from deck stowage. Withhold 10 % retention until sign-off by general contractor + 30-day exposure test. Secure a performance bond 5 % of contract value callable within 10 days; top-tier fabricators (Mitsubishi, Arconic) provide surety at 0.3 % premium, while Tier-2 Chinese sources quote 0.8–1.1 %—use the delta as a negotiating lever. Archive coil batch number and PE core lot; warranty claims without traceability are rejected 62 % of the time per 2023 loss data.
⚡ Rapid ROI Estimator
Estimate your payback period based on labor savings.
Estimated Payback: —