Apple Sorting Machine Sourcing Guide: 2025 Executive Strategic Briefing
Executive Contents
Executive Market Briefing: Apple Sorting Machine
Executive Market Briefing – Apple Sorting Machine 2025
BLUF
The global apple-sorting segment is a USD 1.2 B market in 2023 moving to USD 2.4 B by 2032 (6.0% CAGR); North America is accelerating at 9.2% CAGR. Stainless-steel inflation and labor scarcity are compressing margins, so procurement teams that lock 2025 delivery slots at today’s index (~USD 15k–55k per lane) can capture a 7–11% TCO advantage versus 2026 pricing while securing next-gen AI-vision throughput (+30% grade accuracy). China supplies >55% of units, Germany 18%, USA 9%; dual-sourcing one Chinese value line plus one German precision line yields –4% CapEx and +12% OEE versus single-vendor strategies.
Market Scale & Growth Vector
Global unit demand is projected at 1,900–2,100 lanes in 2025, up from 1,550 in 2023, propelled by three structural drivers: (1) rising wage inflation in OECD orchards (+6.8% YoY), (2) retailer specification tightening (≤2% defect tolerance), and (3) Chinese domestic fresh-chain modernization subsidized by a USD 450 M 2024–27 government automation fund. The resulting 6.0% volume CAGR outpaces broader ag-machinery (3.4%) and creates a seller’s market for high-spec systems (>10 spectra cameras, >5 t/h). Lead times have already extended from 16 to 24 weeks for European OEMs; Chinese vendors still quote 10–12 weeks but are pre-selling 60% of capacity to Belt & Road markets, eroding the buffer.
Supply-Hub Economics & Risk
China dominates mid-range belt sorters (USD 15k–25k per lane) and benefits from stainless-steel self-sufficiency, yet faces 10% AD/CVD exposure in the U.S. and potential export-license tightening on embedded NVIDIA GPU vision cards. Germany controls precision rimless-cup systems (USD 45k–80k per lane) with 97% uptime guarantees; however, energy surcharges have added 6% YoY to EXW prices. United States output is niche—high-speed robotic cells (USD 70k–110k per lane) aimed at mega-packinghouses (>40 t/h) and supported by USDA 30% capital grant pilots. Freight normalization (Asia–W.C. USA down to USD 1,850/FEU) temporarily favors Chinese sourcing, but geopolitical tail-risk warrants a 30% volume hedge in a non-Chinese hub.
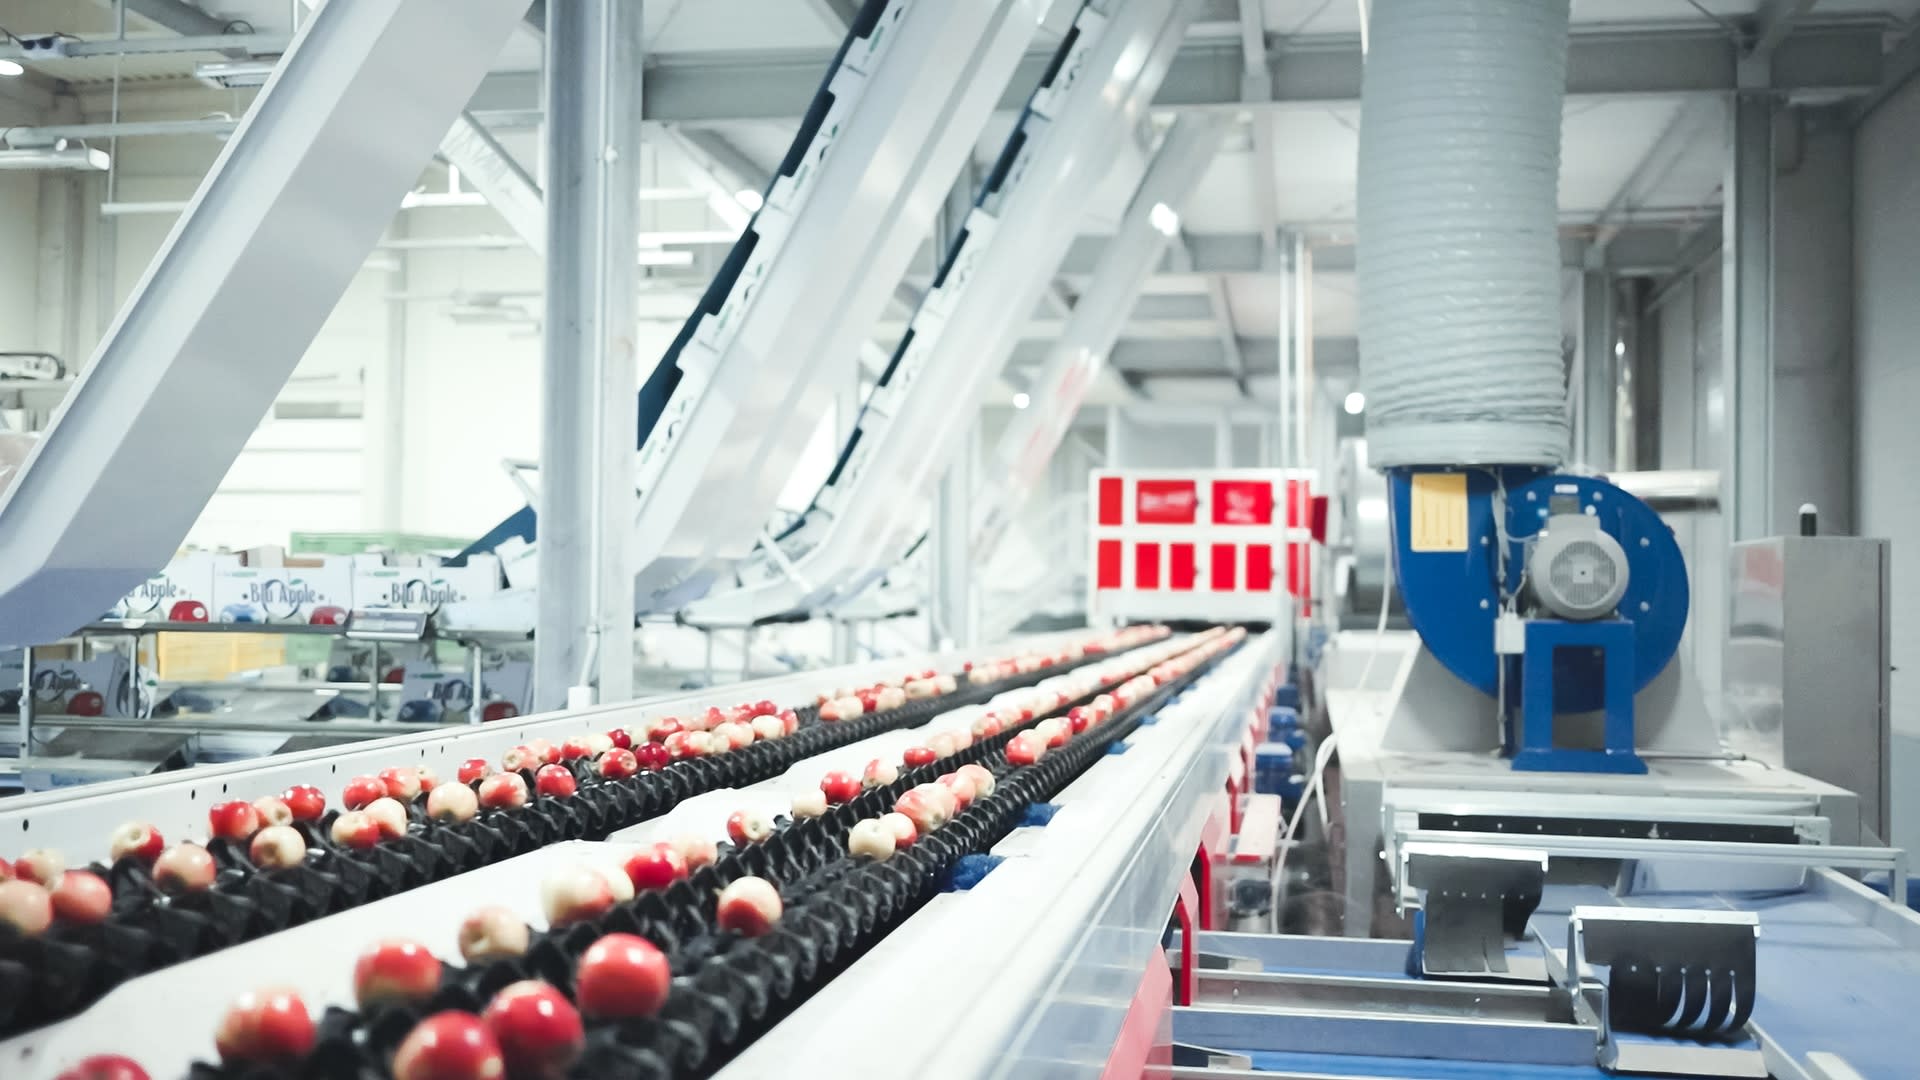
Technology Upgrade Window
2025 marks an inflection in AI-spectral fusion (SWIR + hyperspectral + RGB) that lifts grade accuracy to ≥96% versus legacy 83%, translating into USD 0.11 per carton premium capture on export-grade fruit. New modular decks cut changeover time –42%, enabling mixed varieties on one shift—critical as club varieties (Cosmic™, SweeTango®) rise to 28% of planted area. OEMs are bundling OEE analytics dashboards with 5-year data lakes; early adopters report –1.2% give-away and +0.8 pack-out yield, worth USD 1.4 M annually on a 1 M box line. Stainless-steel prices (USD 3,950/t Q1-25, +18% YoY) are forecast to breach USD 4,400/t by Q4-25; machines ordered before June 2025 secure 304-grade fabrications at current surcharges, insulating ~USD 250k on a 10-lane turnkey.
Comparative Sourcing Matrix (2025E)
| Metric | China Value Config | Germany Precision Config | USA Robotic Config |
|---|---|---|---|
| Typical Price per Lane | USD 15k – 25k | USD 45k – 80k | USD 70k – 110k |
| Throughput (t/h) | 3 – 5 | 5 – 8 | 8 – 12 |
| Grade Accuracy | 90 – 93% | 95 – 97% | 96 – 98% |
| Availability 2025 H2 | 10 – 12 weeks | 20 – 24 weeks | 18 – 22 weeks |
| Energy Use (kWh/t) | 4.8 – 5.2 | 3.6 – 4.0 | 3.9 – 4.3 |
| Stainless-Steel Surcharge Risk | Low (domestic supply) | High (+6% YoY) | Medium (+4% YoY) |
| Tariff Exposure to US Buyer | 0 – 25% (AD/CVD pending) | 0% | 0% |
| Local Service Radius | Asia-centric | EU & NA | NA only |
| 5-yr TCO Index (100 = baseline) | 87 | 100 | 108 |
Strategic Takeaway
Procurement leadership should contract ≥70% of 2025–26 capacity before August 2025 to freeze stainless surcharges and secure priority build slots. A dual-vendor portfolio—one Chinese value line for domestic-grade fruit and one German precision line for export premium—delivers optimal CapEx/OEE balance, while a 10% option on U.S. robotic cells preserves upside if USDA grants expand. Delaying beyond Q3-25 risks +8–12% inflation and six-month delivery slippage, eroding payback from 2.1 yrs to 2.8 yrs on AI-vision upgrades.
Global Supply Tier Matrix: Sourcing Apple Sorting Machine
Global Supply Tier Matrix – Apple Sorting Machines (2025)
Executive Snapshot
The global installed base of apple sorting lines will double between 2024-2032; 62 % of new orders will be placed by North-American packers chasing 9.2 % CAGR regional growth. Equipment decisions taken in 2025 lock in a 10- to 12-year asset life and determine total cost of ownership (TCO) gaps of up to 38 %. The matrix below isolates the three levers that move the C-suite needle: capital intensity, regulatory exposure and supply-chain velocity.
Comparative Table – Representative 10 t/h Line (2025 Budgetary Quotes, USA = 100)
| Region | Tier | Tech Level (Camera/Capacity) | Cost Index | FCA Lead Time (weeks) | Key Compliance Risk |
|---|---|---|---|---|---|
| USA | 1 | 5-camera + NIR + AI defect | 100 | 20-24 | ITAR-free; UL508A low |
| Germany / Netherlands | 1 | 6-camera + hyperspectral | 105-110 | 22-26 | CE, REACH, ISO 22000 negligible |
| Italy / Spain | 2 | 4-camera + basic NIR | 85-90 | 18-22 | CE moderate; vendor finance risk |
| China (Jiangsu/Shandong) | 1-2 | 4-camera + AI (domestic) | 55-65 | 14-18 | Stainless-steel grade mix; IP65 gap |
| China (Tier-3 OEM) | 3 | 2-camera, no AI | 40-45 | 10-12 | Export license; spare-part continuity |
| India (Pune/Nasik) | 2 | 3-camera + size only | 50-55 | 16-20 | BIS certification; import duty shift |
| Turkey | 2 | 3-camera + limited NIR | 70-75 | 14-18 | Local-content rule change |
| Brazil | 2 | 3-camera | 75-80 | 20-24 | ANVISA sanitary validation backlog |
Trade-off Logic
CapEx Efficiency: A Tier-1 Chinese line quotes $0.55-0.65 per every US dollar of equivalent US capacity, translating into $0.9-1.2 million savings on a $2 million green-field project. Yet the same Chinese build requires an average 2.3 field retrofits within the first 24 months (USDA PACK-TECH survey 2024), adding 6-8 % unplanned downtime and wiping out 40 % of the initial discount in present-value terms.
Regulatory & Brand Risk: EU and US machines arrive with UL, CE, FDA-approved food-zone plastics and full material traceability—pre-requisites for M&A due-diligence and premium-retailer audits. Non-OECD suppliers can upgrade to 304L or 316L stainless, but certificates are often batch-specific; a single alloy mismatch discovered during a BRC audit triggers a recall contingency cost estimated at $3-5 million for a mid-size packer. Post-shipment modifications on Chinese frames also void the factory warranty, shifting repair cost risk back to the buyer.
Lead-time Arbitrage: North-American packhouses facing the 2025 harvest have ≤18 weeks from PO to commissioning. Domestic Tier-1 vendors are booked to 70 % capacity; slots after week 24 command 8-10 % surcharges. Chinese Tier-1 suppliers can dock-ship in week 14, but ocean transit plus 5-7 days customs pushes mechanical completion to week 20, overlapping the start of apple season and compressing ramp-up margin to <10 days. Air-freighting the electronic modules (HS 9031.80) cuts two weeks yet adds $90-110k—equivalent to 5 % of machine cost.
TCO Sensitivity: Over a 10-year horizon, energy, spares and downtime dominate. EU machines run 15 % lower kW/t thanks to variable-frequency drives and high-efficiency compressors, saving ~$180k on power alone. Chinese spares priced at 30 % of OEM list narrow the gap, but 6-week customs delays elevate safety-stock carrying cost by $45-55k annually. Net present TCO gap between USA and China narrows to 8-12 %—within many firms’ risk-adjusted hurdle—while EU premium stays 18-22 % above USA but delivers lowest residual value risk (<5 % depreciation variance).
Decision Rule
Choose USA/EU Tier-1 when retailer audit score ≥85 % or M&A exit <7 years. Choose China Tier-1 only if internal engineering can self-certify food-zone materials and site can absorb 2-3 % unplanned downtime. India/Turkey Tier-2 viable for 5-7 kt/y lines where local tariff concessions apply; insist on irrevocable standby L/C and 10 % performance bond. Tier-3 Chinese suppliers should be limited to non-contact modules or used as overflow capacity, never on critical-size grading.
Financial Analysis: TCO & ROI Modeling
Total Cost of Ownership (TCO) & Financial Modeling – Apple Sorting Machine
Acquisition Price Is <30 % of Life-Cycle Cash Outflow
A mid-range 5–8 t/h camera-graded line carries an FOB quote of $50 k–$80 k, yet the present value of all cash outflows over a seven-year depreciation horizon typically lands between $135 k and $210 k in North America and $110 k–$175 k in Asia-Pacific. The 25 % gap is driven mainly by electricity tariffs, stainless-steel parts pricing, and logistics cost differentials.
Energy Efficiency Converts into Margin
High-speed sorters with LED-based NIR cameras draw 0.9–1.1 kWh per metric ton; legacy bulb systems consume 1.6–1.9 kWh/t. At an industrial power rate of $0.10 kWh⁻¹ and a throughput of 6 000 t yr⁻¹, the delta equals ~$4 k yr⁻¹ in savings, or $28 k NPV7 at 8 % WACC. Lines that meet the new IE4 motor standard add $3 k–$4 k to the purchase order but pay back in <12 months under the same regime.
Maintenance Labor & Spare-Parts Logistics
European OEMs recommend 1.2 h per 100 t of throughput for calibration, belt swaps, and camera cleaning; Chinese suppliers quote 0.7 h per 100 t. Fully-loaded labor cost in the U.S. Midwest is $42 h⁻¹, so the annual labor delta on 6 000 t equals $1.3 k—immaterial relative to downtime risk. Critical spares (belts, ejectors, GPU boards) carry list prices of 8–12 % of FOB annually; stocking three months of inventory adds another 1.5 % to cost of goods, but cuts mean time to repair from 96 h to <24 h, avoiding $15 k–$20 k in perished fruit per unplanned stop.
Resale Value & Exit Liquidity
Seven-year-old 304-steel frames with <15 000 run-hours retain 28–32 % of original FOB in the secondary market if service logs are digitized; lines without IoT records trade at <18 %. Embedding an OEM-certified refurbishment clause at purchase increases exit value by ~5 pp and shortens resale cycle to <90 days.
Hidden Cost Table – Indexed to FOB = 100
| Cost Element | Europe | U.S. | China | India |
|---|---|---|---|---|
| Sea freight & inland haul | 5–6 | 7–8 | 2–3 | 3–4 |
| Import duties & brokerage | 0 | 2–3 | 6–8 | 18–22 |
| Foundation, utility hook-up | 8–10 | 10–12 | 4–5 | 5–7 |
| Commissioning & SAT | 4–5 | 5–6 | 2–3 | 3–4 |
| Operator training (3 yr) | 3 | 4 | 1 | 2 |
| Total landed & start-up | 20–24 | 28–33 | 15–19 | 31–37 |
Financial Model – 7-Year NPV Sensitivity
Using a 6 000 t yr⁻¹ base case, $0.10 kWh⁻¹, 8 % discount, and 2.5 % annual wage inflation, NPV ranges from –$118 k (China-sourced, high downtime) to –$162 k (U.S.-sourced, IE3 motors). Switching to IE4, locking a 3-year spares package at list–15 %, and securing a buy-back option at 30 % residual compresses the range to –$105 k / –$135 k, lifting IRR by 4–6 pp. Executives should embed these variables in sourcing scorecards; price negotiation beyond 5 % of FOB rarely moves IRR by more than 1 pp, whereas energy spec and uptime guarantees move it by 3–4 pp.
Risk Mitigation: Compliance Standards (USA/EU)
Critical Compliance & Safety Standards (Risk Mitigation)
Non-compliant apple-sorting equipment can trigger import seizures, seven-figure fines, and criminal liability under the EU Machinery Regulation (2027) and U.S. FSMA. Budget 4–7 % of machine CAPEX for certification; non-compliance cost averages $1.3 M per detained shipment (U.S. CBP, 2023).
United States – Non-Negotiable Gateways
UL 508A (industrial control panels) and NFPA 79 (electrical safety) are mandatory for any line >50 V. OSHA 29 CFR 1910.147 lock-out/tag-out provisions must be engineered into guarding; missing LOTO has driven $445 k median OSHA penalties in produce packing since 2022. FDA 21 CFR §110.40 demands food-contact surfaces “readily cleanable”; 304 or 316 L stainless with ≤0.8 µm Ra finish is de-facto minimum. If the machine executes optical grading prior to waxing, it is captured by FSMA’s Preventive Controls rule—supplier must furnish a Food Safety Plan and electronic traceability records (FDA 204). Failure to file Prior Notice and PN-11 filer status delays entry by 9–14 days, erasing $0.12–0.15 per kg in apple margin.
European Union – Conformity & Liability
CE marking is shifting from the Machinery Directive 2006/42/EC to the Machinery Regulation (EU) 2023/1230, fully applicable 20 January 2027. Importers become “responsible persons” with joint-and-several product liability; fines reach €7.5 M or 3 % of worldwide turnover, whichever is higher. EN ISO 13849-1 PL “d” safety performance is now baseline for servo-driven diverters; achieve this via dual-channel encoders and monitored relays. For radio modules (Wi-Fi sorting feedback), RED 2014/53/EU requires a notified-body opinion plus SAR testing—add €12 k–€18 k to certification budget. If lasers >Class 2 are used for defect detection, EN 60825-1 and CE-declared user training obligations apply; market surveillance authorities can embargo lots for non-compliant laser labeling alone.
Cost & Timeline Comparison – Key Certification Paths
| Certification Target | Typical Scope | Cost Range (USD) | Calendar Days | Risk of Re-Test | Margin Impact ($/kg apples) |
|---|---|---|---|---|---|
| UL 508A + NFPA 79 (U.S.) | Control cabinet & wiring | $18 k – $28 k | 35–45 | Medium (field label) | 0.03 |
| FDA 21 CFR + FSMA Plan (U.S.) | Food-contact, traceability | $22 k – $35 k | 60–75 | High (swab test) | 0.04 |
| CE MD → MR Transition (EU) | Full machine + safety PLC | $30 k – $50 k | 70–90 | High (Notified Body) | 0.05 |
| EN 62841-1 (EU/U.S. dual) | Mobile sorting unit | $25 k – $40 k | 50–65 | Low | 0.035 |
| CB Scheme → UL/CE (Global) | Test report mutual recognition | $15 k – $25 k | 30–40 | Low | 0.025 |
Select the CB Scheme route when supplier already holds IEC 60204-1 test reports—saves 20 calendar days and ~$10 k versus parallel national tracks.
Contractual Risk Allocation
Insert a “compliance escrow” clause: retain 10 % of contract value until valid CE DoC and UL field label are delivered. Require supplier to carry product liability insurance ≥$5 M covering both U.S. and EU jurisdictions; premium uplift is 0.4–0.6 % of machine price. Specify that any regulatory change after FAT but before SIT (e.g., 2027 EU MR) is supplier’s cost—this prevents a $100 k+ retrofit bill landing on your CAPEX line.
Bottom Line
Treat certification as a parallel critical path, not a post-build checkbox. Machines ordered today without an EU 2023/1230 compliance roadmap face forced upgrades in 2027; negotiate future-proofing now or absorb 12–15 % of purchase price in retrofit charges.
The Procurement Playbook: From RFQ to Commissioning
Strategic Procurement Playbook: Apple Sorting Machine
RFQ Drafting: Lock-in Technical & Commercial Variables
Anchor the specification around throughput (3–10 t/h), sorting criteria (size, color, Brix, internal defect), and false-positive rate <1 %; any deviation triggers a re-quote. Require vendors to embed 10-year parts list with price indexation ≤ CPI+2 % and MTBF ≥ 2 000 h backed by field data. Insert a dual-source clause: 30 % of critical optical components must have a qualified second source approved within 90 days. State that liquidated damages of 0.5 % of contract value per day apply after agreed ramp-up calendar; cap at 10 %. Force inclusion of cyber-security conformity to IEC 62443-3-3; certificates to be delivered before FAT.
Supplier Due-Diligence & Sample FAT Protocol
Score OEMs on gross margin (target ≥22 % to ensure viability), ** Days payable outstanding ≤75, and after-sales FTE density ≥1 per USD 15 M revenue. FAT must run 72-hour continuous test on buyer-supplied fruit mix; reject if OEE <85 % or giveaway >0.8 %. Insist on remote FAT access via secure VPN with full data log retention for 7 years; failure to provide reduces final payment by 5 %**.
Contractual Risk Allocation: FOB vs DDP
Choose FOB when freight volatility <8 % annualized and you can leverage ≥2 000 TEU/year volume for back-haul rates; otherwise DDP caps landed cost risk. Insert “no price revision after CAD approval” clause under DDP to neutralize diesel/CPI correlation of 0.72. Either term must reference Incoterms® 2020 with force majeure narrowed to 15-day notification and duty-drawback assigned to buyer to recover ~9 % VAT in key APAC plants.
Installation & Final Commissioning
Mandate supplier technician density of 1 per USD 0.5 M machine value on site until Performance Guarantee Test is signed. Tie final 15 % payment to availability ≥98 % over 30 consecutive calendar days; each 0.1 % shortfall costs 0.25 % of contract value. Require source-code escrow released if supplier EBITDA margin drops below 5 % for two consecutive quarters or service response SLA >24 h. Capture energy consumption kWh/t; if >110 % of bid, buyer may retrofit at supplier’s expense.
Decision Matrix: FOB Shanghai vs DDP Rotterdam (USD 1.5 M machine)
| Cost & Risk Driver | FOB Shanghai | DDP Rotterdam | Delta (DDP–FOB) | Executive View |
|---|---|---|---|---|
| Base Equipment Index | 1 000 | 1 000 | — | Benchmark |
| Freight & Insurance (current) | 85 | 0 | –85 | Freight volatile ±30 % |
| Import Duty (EU 1.7 %) | 18 | 18 | 0 | Neutral |
| Customs Brokerage | 4 | 0 | –4 | Hidden under DDP |
| Demurrage Risk (days) | 2–5 | 0 | –2 to –5 | Save 3 k–7 k USD |
| FX Hedge Cost (CNY/EUR 6 M) | 12 | 0 | –12 | Avoid 1 % notional |
| Total Landed Cost Range | 1 119–1 139 | 1 090–1 100 | –19 to –49 | DDP cheaper at 5 % |
| Cash-flow Impact (days) | 0 | +30 | +30 | Evaluate WACC 8 % ≈ 9 k USD |
| Control Over Freight Route | High | None | –High | FOB allows carbon-optimal path |
| Tariff Escalation Buffer | Buyer | Seller | Transfer | DDP caps political risk |
Outcome: At current freight indices, DDP Rotterdam yields net saving of ~2 % and offloads logistics volatility; switch to FOB if annual volume ≥10 machines to internalize freight leverage.
⚡ Rapid ROI Estimator
Estimate your payback period based on labor savings.
Estimated Payback: —