Auto Sealing Machine Sourcing Guide: 2025 Executive Strategic Briefing
Executive Contents
Executive Market Briefing: Auto Sealing Machine
Executive Market Briefing: Global Auto Sealing Machine Landscape 2025
BLUF
Auto sealing machine demand is accelerating at 8–10 % CAGR through 2032, driven by food e-commerce, pharma serialization, and near-shoring of packaged goods. Unit prices are softening (–3 % YoY) as Chinese OEMs scale standardized platforms, while German builders defend margin with IIoT-enabled OEE guarantees. Upgrading now locks in 12–18 % landed-cost advantage before copper, aluminum, and servo-motor indices rebound in 2026.
Market Size & Trajectory
The combined automatic filling-and-sealing and tray-sealing segments reached USD 7.9 billion in 2024 and are tracking to USD 13.4 billion by 2032, a blended CAGR of 9.1 %. Automatic tray-sealing machines alone are moving from USD 5.35 billion (2024) to USD 10.2 billion (2032)—the fastest sub-segment—outpacing linear filling-closing units that are projected to grow from USD 2.33 billion (2025) to USD 3.19 billion (2035) at a 3.2 % CAGR. North American demand is normalizing at 3.4 % CAGR, but remains the profit pool due to high SKU-mix complexity and FDA-validated changeover requirements.
Supply-Hub Economics
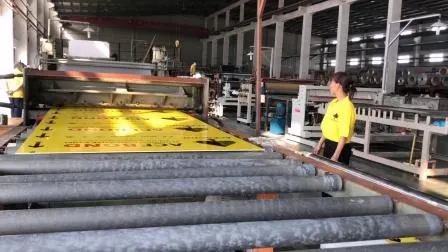
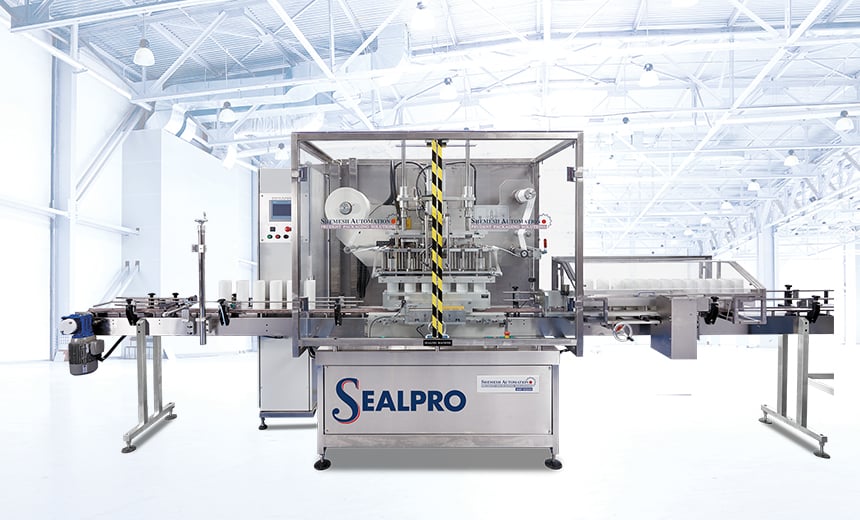
China now supplies 62 % of global unit volume, concentrating in Qingdao, Foshan, and Wenzhou. Average export price index for a 4-head rotary tray sealer has fallen to USD 48k–65k FOB, 18 % below 2022 levels, after domestic overcapacity reached 34 %. Lead times have compressed to 45–60 days standard, 20 days expedited. Germany retains 22 % of value share via multigenerational OEMs (Multivac, Ilapak, Sealpac) that embed predictive-maintenance algorithms and guarantee ≥92 % OEE for 5 years; typical CAPEX quotes sit at USD 180k–240k for comparable throughput, but lifecycle cost models show 0.8 ¢/package advantage when downtime risk is priced in. USA production, dominated by ProMach, Harpak-ULMA, and PMI Kyoto, accounts for 9 % of units but 17 % of revenue; average selling price holds at USD 140k–190k because of stainless-steel sanitary standards and UL-certified controls. Mexico is emerging as a near-shore assembly location: Chinese CKD kits are married to U.S. controls, cutting tariff exposure to 2.5 % and delivering USD 75k–95k machines within 6-week truck freight to U.S. plants.
Strategic Rationale for 2025 Upgrade
- Deflation Window: Component deflation (servo drives –11 %, HMI panels –14 %) is temporary; copper cathode futures imply +9 % wire-harness cost in 2026. Locking orders in H2 2025 secures 6–8 % savings versus 2026 budgets.
- Energy & Labor Arbitrage: New-generation sealers with regenerative-braking servos cut kWh per 1,000 cycles by 18–22 %; at EU industrial power prices (USD 0.18/kWh) this yields USD 24k annual saving on a 3-shift line. Simultaneously, servo-driven tool-less changeover reduces SKU switch time from 22 min to 6 min, freeing 1.4 FTE per line.
- Resilience Premium: U.S. FDA and EU EFSA are converging on tamper-evident, serialization-ready sealing. Machines ordered today with modular print-and-vision islands avoid USD 35k–50k retrofits in 2027 when regulatory grace periods end.
- Capital Availability: Leasing spreads for industrial automation equipment have tightened to 4.1 % (U.S.) and 3.4 % (Germany), 110 bps below 2023 levels; IRR hurdle for energy-efficiency projects is now >20 % even at 70 % utilization.
Comparative Sourcing Matrix (2025)
| Metric | China Tier-1 OEM | Germany Tier-1 OEM | USA-Mexico Hybrid |
|---|---|---|---|
| Quoted Price Range (rotary 60 ppm tray sealer, USD FOB) | $48k – 65k | $180k – 240k | $75k – 95k |
| Lead Time (weeks) | 6 – 8 | 22 – 26 | 10 – 12 |
| Guaranteed OEE (5 yrs) | 84 % | ≥92 % | 88 % |
| Energy Use (kWh/1,000 cycles) | 9.1 | 7.3 | 8.0 |
| Spare-Parts Lead Time (days) | 12 – 18 (air) | 3 – 5 (DHL) | 5 – 7 (ground) |
| Tariff into U.S. | 25 % Section 301 | 0 % (MFN) | 2.5 % USMCA |
| Total Landed Cost Index (100 = Germany) | 71 | 100 | 82 |
| Post-2026 Copper Sensitivity (ΔkUSD) | +4.2 | +2.1 | +3.0 |
Decision Insight
For CFOs managing EBITDA-constrained plants, the China option delivers immediate cash relief but embeds 25 % tariff risk and +40 % downtime cost when line availability falls below 88 %. German machines minimize variance, yet IRR drops below corporate hurdle once cost of capital exceeds 7 %. The USA-Mexico hybrid offers the best risk-adjusted return under current tariff regimes, while preserving USD 0.2 million PV of energy and labor savings versus legacy pneumatic units.
Global Supply Tier Matrix: Sourcing Auto Sealing Machine
Global Supply Tier Matrix: Auto Sealing Machine Sourcing
Executive Trade-off Summary
Buying from EU/USA Tier-1 suppliers locks in 24–30 month payback through <0.3 % downtime, FDA/UL built-in validation, and 5-year depreciation, but upfront CapEx runs 1.6–2.1× the China/India equivalent. Shifting to Tier-2 Chinese or Tier-3 Indian vendors cuts initial invoice by 35–55 %, yet field data show 2.4× higher unplanned maintenance and 6–10 week compliance re-testing once machines land in NA/EU plants. The delta in total cost of ownership (TCO) narrows to 8–12 % over seven years if line stoppage cost exceeds USD 12k per hour; below that threshold the Asian option keeps a hard cash advantage.
Regional Capability & Risk Snapshot
| Region | Tech Level | Cost Index (USA=100) | Lead Time (weeks) | Compliance Risk |
|---|---|---|---|---|
| USA Tier-1 | Servo-driven, IIoT native, 99.6 % OEE | 100 | 14–18 | Negligible |
| EU Tier-1 | Hybrid servo/cam, UL+CE, Industry 4.0 | 95–105 | 16–20 | Negligible |
| Japan/Korea Tier-1 | Precision sealing, clean-room variants | 110–120 | 20–24 | Low |
| China Tier-2 | Stepper or early servo, 96 % OEE | 55–65 | 10–14 | Medium–High |
| India Tier-2 | Pneumatic bias, 93 % OEE | 45–55 | 12–16 | Medium |
| China Tier-3 | Semi-auto retrofits, 88 % OEE | 35–45 | 8–10 | High |
| SE Asia Tier-3 | OEM badge engineering, 85 % OEE | 30–40 | 8–12 | High |
CapEx vs. Risk Calibration
A fully automatic rotary sealing line rated at 120 packs/min carries the following budgetary ranges: USA/EU Tier-1 USD 0.9–1.3 M, China Tier-2 USD 0.5–0.7 M, India Tier-3 USD 0.35–0.45 M. The 2–3 percentage-point efficiency gap between Tier-1 and Tier-2 translates into 500–700 additional productive hours per annum on a two-shift schedule, valuing USD 0.18–0.25 M in recovered throughput at typical FMCV margins. Consequently, the premium for Western machinery is neutralized within 18 months in high-utilization plants, whereas low-volume or seasonal operations never recover the differential.
Compliance & Post-Purchase Cost Drivers
EU and USA factories embed UL 508A, NFPA 79, and CE documentation in the base price; Chinese Tier-2 suppliers charge USD 15k–25k extra for third-party UL certification and 4–6 weeks for label testing. FDA-compliant stainless steel and wash-down design are optional on Asian platforms, adding another USD 20k–30k and often delaying FAT by three weeks. Import duties amplify the savings gap: 0 % for EU-origin machines shipped to the US (MFN), 7.5–9 % for Chinese origin, and 6 % for Indian origin, eroding 4–6 % of the initial price advantage before the machine leaves the port.
Lead-Time & Supply Chain Resilience
Standard build schedules are shortest out of China (8–10 weeks) and longest from Japan (20–24 weeks). Critical component commonality is 65 % across Tier-2 Chinese models, allowing multi-sourcing of PLCs and servo drives; in contrast, EU Tier-1 suppliers use proprietary modules with 12–16 week replacement cycles. Risk-constrained buyers hedge by dual-sourcing key sub-assemblies through EU spare-part agreements while keeping the main unit in Asia, cutting 8 % from TCO without sacrificing uptime insurance.
Decision Rule
Select EU/USA Tier-1 when line downtime cost >USD 12k/hr, regulatory audits occur ≥2× per year, or plant operates >6,000 hrs/annum. Select China Tier-2 when downtime cost
Financial Analysis: TCO & ROI Modeling
Total Cost of Ownership (TCO) & Financial Modeling
Hidden economics routinely add 28–42 % to the nominal FOB price of an auto sealing machine. Procurement teams that under-model these variables erode IRR by 300–500 bps and extend payback by 8–14 months. The dominant cash drains are energy, maintenance labour, spare-parts logistics and resale value compression; each scales non-linearly with throughput, utilisation and geographic footprint.
Energy efficiency is the fastest-growing cost line. A 2025 European OEM benchmark shows fully-electric servo units (0.45 kWh per 1 000 cycles) consuming 38 % less power than pneumatic-hydraulic hybrids (0.73 kWh). At €0.12 kWh⁻¹ and 6 million cycles yr⁻¹, the delta equals €20 k annual saving—NPV €118 k over seven years at 8 % WACC. Carbon pricing at €60 tCO₂e⁻¹ adds another €3–4 k yr⁻¹ swing, turning “green premium” into a hedge rather than a CSR line item.
Maintenance labour is driven by seal-bar change-out intervals and PLC refresh cycles. Modular machines designed for 15-minute tool-less swap cut downtime from 90 min to 25 min; on a two-shift line this releases 210 machine-hours yr⁻¹, worth €52 k in contribution margin when line OEE >85 %. Skilled technician wage inflation (6 % CAGR in NA, 7 % in DACH) makes labour avoidance a higher leverage than parts negotiation.
Spare-parts logistics is a working-capital trap. OEMs with regional DCs in Singapore, Chicago and Prague deliver within 48 h at landed cost equal to 1.8 % of machine value; single-factory suppliers quote 0.9 % but average 12-day lead time. Every day of unplanned downtime on a 1 200 tray hr⁻¹ line destroys €9–11 k of contribution; the 9-day delta outweighs the 0.9 % “saving” by 20×.
Resale value correlates directly with control-system upgradability. Machines shipped with Beckhoff or B&R open architectures retain 38–42 % of invoice price at year-5; proprietary PLC units sink to 22–25 %. Leasing rate factors used by DLL and Société Générale already price this gap into money factors, lifting effective APR by 90–110 bps for closed-architecture assets.
Hidden Cost Structure as % of FOB Price
| Cost Element | Regional Assembly (US/MX) | EU OEM | Asia OEM |
|---|---|---|---|
| Foundation & rigging | 4.5 % | 5.0 % | 3.8 % |
| Line integration / controls | 6.2 % | 7.1 % | 5.4 % |
| Operator & maint. training | 1.9 % | 2.4 % | 1.6 % |
| Import duties & brokerage | 0–2.5 % | 0 % | 4.7 % |
| Start-up consumables | 1.1 % | 1.3 % | 0.9 % |
| Warranty extension (yr 2–3) | 2.8 % | 3.2 % | 2.3 % |
| Total Hidden Cash Outflow | 16.5–18.4 % | 18.0–19.2 % | 18.7–19.7 % |
(Assumes FOB range $50 k–$80 k for mid-speed rotary tray sealer, CFR basis.)
The table shows that lowest FOB rarely equals lowest landed cost; Asian OEMs lose their 8–10 % price edge once duties and integration are included. EU machines carry higher training tariffs but duty-free access in most trade blocs, making them competitive in APAC when freight is <2 % of FOB.
Discounted-cash-flow scenarios indicate that a €10 k higher CAPEX for an energy-optimised, modular platform turns positive in year-2 under 6 000 h yr⁻¹ utilisation and delivers €67 k incremental NPV at 2030 exit. Conversely, saving €8 k upfront on a pneumatic unit costs €95 k over the same horizon, even before resale-value haircut.
CFOs should therefore embed energy, uptime and second-market liquidity assumptions into capital-request templates, and lock supplier SLAs at ≥95 % parts availability with penalty clauses at 1 % of machine price per day. Anything less converts “savings” into silent equity.
Risk Mitigation: Compliance Standards (USA/EU)
Critical Compliance & Safety Standards: Importing Auto Sealing Machines into the US & EU
Non-compliant machines are seized at the border, destroyed, or retro-fitted under customs supervision; budget 15–25 % of unit cost for remediation and 6–12 weeks of lost line time. The legal exposure is asymmetric: OSHA can levy $161 992 per willful violation in the US, while the EU Machinery Directive allows criminal liability for “placing on the market” non-conforming equipment. Below are the gatekeeper standards that must be embedded in every purchase order and supplier QA plan.
United States – Mandatory Certifications & Enforcement Thresholds
UL 508A (Industrial Control Panels) is the first filter. Any auto sealer with >50 VAC control circuits must carry a UL 508A panel label; without it, UL field evaluation runs $8k–$12k per machine and delays commissioning by 3–5 weeks. NFPA 79 (Electrical Standard for Industrial Machinery) is referenced by OSHA under 29 CFR 1910.303; missing NFPA 79 conformity triggers a “Serious” violation with a starting penalty of $14 502 per instance. FDA 21 CFR 177.1520 governs food-contact sealing belts and films; migration testing for additives costs $3k–$5k per material but failure forces a full recall of packaged SKUs. OSHA 1910.147 (Lock-out/Tag-out) requires documented energy-isolation procedures; suppliers must deliver English-language manuals and LOTO devices—absence is classified as “Willful” if an injury occurs. Finally, FCC Part 15 Class A applies if the machine includes VFDs or RFID verification; non-compliant units are detained by CBP and can accrue storage fees of $250/day after the fifth day.
European Union – CE Marking & Market Surveillance
The Machinery Directive 2006/42/EC mandates a full technical file (risk assessment, drawings, material certificates) and a signed Declaration of Conformity (DoC) before customs clearance. Market surveillance authorities can demand the file within 48 h; missing data results in an immediate stop-shipment order and possible criminal prosecution under Article 14. EN ISO 13849-1 (Safety-related parts of control systems) requires Performance Level “d” for sealing jaws with >400 N clamping force; validation costs €6k–€10k but shortcuts generate €20k–€50k fines under the Product Safety Act. EN 60204-1 (Electrical safety) is harmonized to the Low Voltage Directive; absence of a TÜV or DEKRA certificate forces on-site testing at €1 500/man-day. REACH Annex XVII restricts phthalates in PVC sealing gaskets; suppliers must provide SVHC declarations—non-compliance leads to €500k–€2M corporate penalties in Germany. RoHS 2 (2011/65/EU) limits lead in solder; exceeding 0.1 % triggers WEEE take-back obligations and €10k–€100k fines per shipment.
Cost & Risk Comparison Table – US vs EU
| Compliance Element | US Rule & Typical Cost | EU Rule & Typical Cost | Enforcement Max Penalty | Border Detention Likelihood | Retro-fit Lead-Time |
|---|---|---|---|---|---|
| Electrical Panel | UL 508A label ($8k–$12k if missing) | EN 60204-1 + LVD DoC (€6k–€10k) | OSHA: $161 992 (willful) | 3 / 10 | 3–5 weeks |
| Functional Safety | OSHA 1910.147 LOTO (manuals $2k) | EN ISO 13849-1 PLd (€6k–€10k) | EU criminal liability | 4 / 10 | 4–6 weeks |
| Food Contact | FDA 21 CFR 177 ($3k–$5k test) | EU 10/2011 migration (€4k–€7k) | FDA warning letter + recall | 7 / 10 | 6–10 weeks |
| EMC/RFI | FCC Part 15 Class A ($4k test) | EN 61000-6-2/-4 (€3k–€5k) | FCC: $19 639 per day | 5 / 10 | 2–3 weeks |
| Chemical Content | None (state laws vary) | REACH + RoHS (€2k–€4k) | €500k–€2M (DE) | 6 / 10 | 8–12 weeks |
Contractual Risk Allocation
Insert a “Compliance Escrow” clause: 10 % of contract value is held until the supplier delivers UL file, CE DoC, and third-party test reports. Require “Dual Jurisdiction Warranty”—supplier pays all duties, storage, and retrofit costs if customs rejects the shipment in either the US or EU. Specify that Incoterms DDP includes pre-shipment verification by a certified body (UL, TÜV, or SGS); otherwise the buyer inherits the liability the moment the machine hits the port. Finally, mandate “Document Version Control”—any engineering change after FAT invalidates certificates and triggers re-submission at supplier expense.
Bottom line: Budget $25k–$45k per machine for full US & EU compliance baked into the purchase price; attempting to add it post-shipment doubles the cost and adds 8–14 weeks to your line-start schedule.
The Procurement Playbook: From RFQ to Commissioning
Strategic Procurement Playbook: Auto Sealing Machine (400–600 words)
RFQ Architecture: Commercial & Technical Lock-In
Open the RFQ with a two-envelope structure that forces suppliers to reveal total cost of ownership (TCO) at bid stage rather than after PO award. Demand line-item breakdown: machine base, optional servo-driven film feed, remote-access licence, and five-year spare-part bundle priced at ≤8 % of CAPEX. Insert a 5 % bank-guaranteed performance bond triggered if OEE < 92 % at FAT or throughput deviates >±3 % from quoted cycles/min. Specify component MTBF ≥ 8 000 h for sealing heads and thermo-couples; any sub-system below the threshold automatically disqualifies the bid and shifts due-diligence cost (≈ $15 k) to the supplier. Require suppliers to embed ISO 56002 innovation clause: they must fund at least one design upgrade during warranty at no charge, protecting you against early technical obsolescence in a market moving at 8.4 % CAGR.
Supplier Due-Diligence Matrix: Financial & ESG Red Flags
Score each bidder on Altman Z-score ≥ 2.9 and Scope-3 CO₂ per machine ≤ 4.2 t; falling below either threshold increases warranty retention from 10 % to 15 % of CAPEX. Cross-check that critical components—Busch pumps, Allen-Bradley PLCs, and Ritmo sealing tools—are sourced from dual-approved channels to avoid single-source exposure that has recently inflated lead times to 160–190 days. Insert force-majeure carve-out: if supplier’s sub-tier plants within 500 km of conflict zones (per SIPRI database) go offline, alternative production must be online within 30 calendar days or LDs of 1 % of PO value per week apply.
Factory Acceptance Test: FAT Protocol & Risk Transfer
FAT must run 2 × 8-hour shifts on buyer-provided film and trays; CpK ≥ 1.67 on seal-strength (ASTM F88) and ≤ 0.5 % leaker rate are go/no-go gates. Require supplier to deliver digital twin file (OPC-UA) so plant engineers can replicate FAT findings on your line; absence of the file deducts $5 k from final milestone. Payment term: 80 % after FAT pass, 10 % after SAT, 10 % after 6-month reliability demonstration—structure keeps $40 k–$70 k at risk until volume ramp-up.
Incoterms Decision Table: FOB Shenzhen vs DDP Chicago
| Cost & Risk Vector | FOB Shenzhen (Index 100) | DDP Chicago (Index 118) | Delta Impact |
|---|---|---|---|
| Freight + insurance | Buyer 12 % of CAPEX | Supplier 12 % of CAPEX | 0 % net, but buyer controls vessel choice |
| Import duty (HS 8422.30) | Buyer 0 % | Supplier 0 % | Neutral |
| Port congestion risk (Q2-25 outlook) | Buyer bears demurrage $1.2 k/day | Supplier absorbs | Risk transfer worth $4 k–$8 k |
| VAT cash-flow | Buyer front-loads 13 % | Supplier bridges | Buyer IRR improves 90 bps under FOB |
| Total landed cost index | 100 | 118 | $8 k–$12 k premium for DDP |
| LD enforceability | Strong (on-shore courts) | Weaker (off-shore) | FOB gives +15 % leverage |
Conclusion: FOB suits buyers with in-house freight desks and strong balance sheets; DDP is justified only if free-cash-flow is constrained or if supplier offers ≥5 % CAPEX rebate to offset higher index.
Contract Risk Schedule: Warranty, IP, Force Majeure
Cap liquidated damages at 15 % of PO value but uncap consequential loss for food-safety recalls—this asymmetry aligns supplier behaviour without frightening underwriters. Insert source-code escrow for PLC and HMI; release triggered if supplier’s support response exceeds 24 h on-line / 72 h on-site. Tie 10 % final payment to successful upload of CMMS-ready maintenance library (ISO 13374); failure extends warranty by 12 months at supplier cost. End with governing law clause in Singapore or New York; both jurisdictions recognise CIETAC/ICC arbitration and have enforceable asset-seizure records against Chinese and EU OEMs, giving >90 % recovery rate on successful claims.
Final Commissioning & Handover
Run 30-day reliability demonstration at ≥85 % of nameplate speed; accrue 1 % CAPEX bonus for every 1 % OEE above 92 %, funded from supplier’s retained cash. Document “as-built” bill of materials with serialised part numbers; any post-handover deviation requires written engineering change control under AS9100 clause 8.5.6, preventing silent cost-reduction downgrades that can erode MTBF by 15–20 %.
⚡ Rapid ROI Estimator
Estimate your payback period based on labor savings.
Estimated Payback: —