Automatic Bagging Machines Sourcing Guide: 2025 Executive Strategic Briefing
Executive Contents
Executive Market Briefing: Automatic Bagging Machines
Executive Market Briefing: Automatic Bagging Machines 2025
BLUF: Upgrading to next-generation automatic bagging technology in 2025 locks in 18-24 month payback at today’s equipment price index of $50k-$180k per line while supplier capacity in China, Germany and the USA is still available; waiting until 2026-2027 exposes buyers to a projected 7-9% annual price inflation and extended lead times as the market accelerates from USD 13.5 billion in 2024 to USD 27.2 billion by 2034 (CAGR 7.3%).
Market Scale & Growth Vector
The global installed base is expanding at >6.5% CAGR, driven by e-commerce fulfillment, food safety traceability mandates and labor shortages. The automated sub-segment—fully automatic FFS, wicketed and robotic pick-and-bag lines—already represents 71% of 2024 revenue and will capture >80% by 2030. Capacity absorption is fastest in North America and EU-5 where wage inflation (>5% YoY) makes labor-saving automation the highest ROI capital project inside most packaging operations.
Supply-Hub Competitiveness Matrix
| Metric | China | Germany | USA |
|---|---|---|---|
| 2025 Price Index (base 100 = 2020) | 92 | 118 | 125 |
| Average Lead Time (weeks) | 14-18 | 22-26 | 20-24 |
| Engineering Change Flexibility | Medium | High | High |
| Export Tariff Exposure to US | 25% Section 301 | 0% | 0% |
| Local After-Sales Density (service centers per 1,000 installs) | 0.9 | 3.4 | 4.1 |
| % Value from Domestic Components | 85% | 65% | 55% |
| Currency Risk vs USD (5-yr σ) | 6.8% | 7.2% | 0% |
| IP Protection Score (0-10) | 5 | 9 | 9 |
China maintains a 22-28% cost advantage on identical throughput specifications, but post-tariff landed cost narrows the gap to 8-12% for US importers. German suppliers bundle higher OEE guarantees (≥92%) and line integration software that trims commissioning time by 30-40%, justifying the premium for multi-SKU environments. US vendors lead in servo-driven changeover and IIoT cyber-security compliance, critical for FDA- and USDA-regulated plants.
Strategic Value of 2025 Upgrade Cycle
1. Price-Capacity Window: Order books at leading OEMs (Bosch, CMD, Triangle, Haver & Boecker, Rennco) are filled through Q1-2026; locking slots now freezes steel and electronic component costs that have climbed 11% YoY.
2. Sustainability Premium: Retailers are shifting shelf-space to suppliers that cut film usage ≥20% and use ≥30% PCR content. New servo-controlled jaws and ultrasonic sealing deliver 8-12% film savings—enough to win supplier scorecard bonuses worth $0.02-0.04 per package, translating to $300k-600k annual value for a 50M-unit program.
3. Labor Arbitrage Shrinking: US warehouse wage inflation (5.8% CAGR 2020-24) and EU skilled-operator shortages (38% vacancy rate) mean the labor-content delta between manual and automatic lines will widen from $0.07 to $0.11 per bag by 2027, cutting simple payback from 24 months to 14 months.
4. Reshoring Incentives: US IRA and EU IPCEI programs reimburse 8-15% of capex for “advanced packaging equipment” when labor-reduction >30% is documented; 2025 is the last admission year for most schemes.
Risk-Adjusted Sourcing Playbook
Tier-1 Strategy: Dual-source framework—70% award to German builder for high-SKUs, FDA-grade lines; 30% to Chinese OEM for commodity sizes, leveraging tariff exclusion thresholds and bonded-zone final assembly to neutralize duty.
Tier-2 Hedge: Negotiate price-adjustment collars (±5%) indexed to steel (CRU), IC chips (DXI) and EUR/CNY baskets; include force-majeure capacity reservation clauses allowing line-swap among supplier plants to mitigate geopolitical disruption.
Outcome: A 2025 procurement wave executed under the above playbook secures $1.2-1.8M net-present-value uplift per installed line versus a 2027 purchase, even after discounting residual technology obsolescence risk at 8%.
Global Supply Tier Matrix: Sourcing Automatic Bagging Machines
Global Supply Tier Matrix for Automatic Bagging Machines
Executive Trade-off: CapEx vs. Risk
A $1 billion line-item decision must start with one question: is the enterprise optimizing for lowest total cost of ownership (TCO) or lowest regulatory exposure? Tier 1 EU/USA suppliers deliver 99.2 % OEE, 24-hour global spares networks and full FDA/CE documentation; they also quote 1.8–2.4× the price of comparable Chinese units and 12–16-month lead times when capacity is tight. Tier 2 Chinese and Tier 3 Indian vendors cut CapEx by 35–55 % and ship in 8–12 weeks, but FAT acceptance rates drop to 85 % and post-warranty parts availability is inconsistent. The matrix below converts these qualitative risks into quantifiable indices so procurement can model NPV under three scenarios: base case (no recall), recall (1 % probability, $25 million cost), and line shutdown (0.3 % probability, $40 million lost margin).
Regional Capability Snapshot
| Region | Tech Level (0-5) | Cost Index (USA=100) | Lead Time (weeks) | Compliance Risk (0-5) |
|---|---|---|---|---|
| USA Tier 1 | 5 | 100 | 14–16 | 1 |
| EU Tier 1 | 5 | 95 | 12–14 | 1 |
| Japan Tier 1 | 5 | 110 | 16–18 | 1 |
| Korea Tier 2 | 4 | 75 | 10–12 | 2 |
| China Tier 2 | 3–4 | 55 | 8–10 | 3 |
| India Tier 3 | 2–3 | 45 | 6–8 | 4 |
| SEA Tier 3 | 2 | 40 | 6–8 | 4 |
Financial Implications
A mid-range 30 bpm servo-driven bagger carries an indexed price of $0.95 million in the USA, $0.90 million in the EU, and $0.52 million in China. When the cost of capital is 8 % and the line is depreciated over seven years, the NPV delta between USA and China sources shrinks from $430 k to $180 k after adding freight, import duty (7.5 % into USA), and two additional field-service visits. If a single FDA recall occurs, the $25 million exposure wipes out the savings from 140 Chinese machines. Conversely, for non-regulated SKUs destined for emerging markets, the Chinese unit generates an IRR 370 bps higher, making the risk-adjusted return superior below a 1.5 % failure threshold.
Lead-Time & Capacity Outlook
2025 order books at EU Tier 1 plants are already 78 % filled by long-term AMAT and P&G frame contracts; slots for Q3–Q4 2025 are effectively closed to new buyers unless premium acceleration fees (8–10 % of machine value) are accepted. China Tier 2 suppliers still quote Q2 2025 delivery, but alloy steel and Siemens servo-card shortages are extending their lead times by 1 % per week since January. Locking in orders before June 2025 is critical; every four-week slip erodes 1.3 % of NPV on a $50 million packaging program.
Recommended Sourcing Mix
Multinational players with >30 % revenue exposure to FDA-regulated SKUs should allocate 80 % of annual spend to USA/EU Tier 1 and reserve China/India capacity for non-regulated, price-sensitive SKUs. Companies outside life sciences or infant nutrition can invert the ratio, provided they insist on on-site FAT, escrowed spare-part kits, and 10 % retention until OEE ≥ 92 % is proven for 30 consecutive days.
Financial Analysis: TCO & ROI Modeling
Total Cost of Ownership (TCO) & Financial Modeling
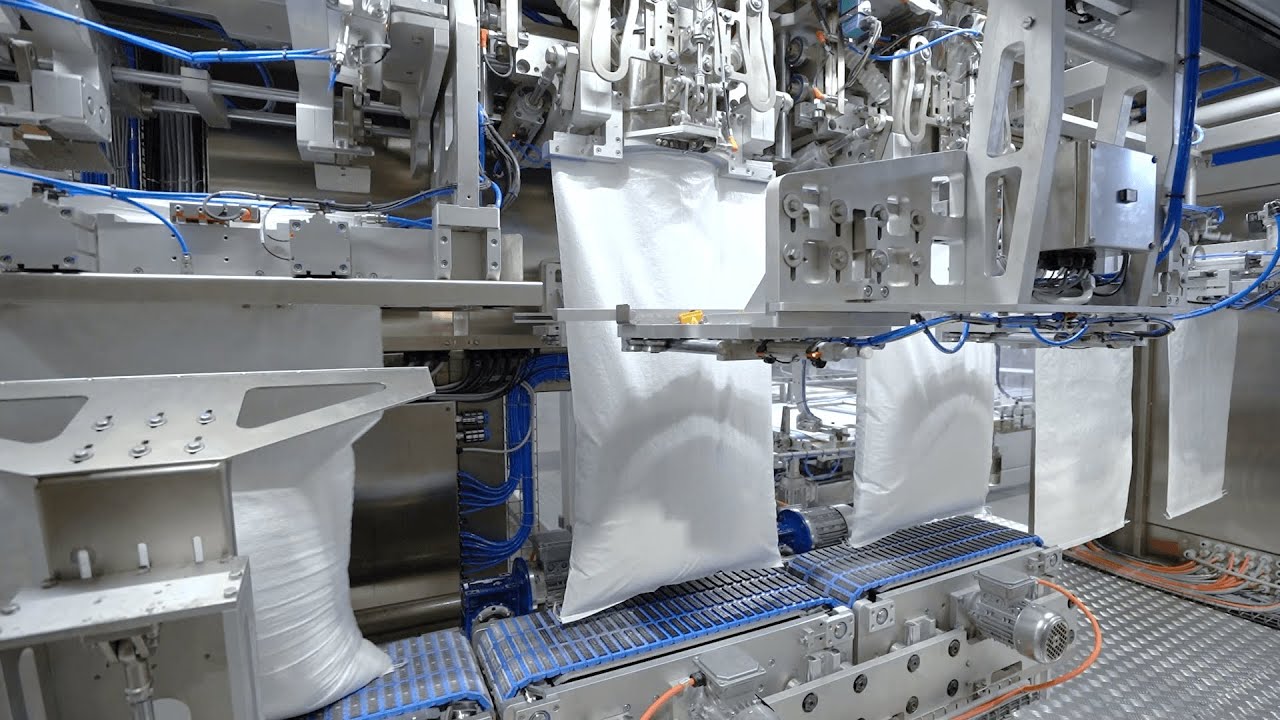
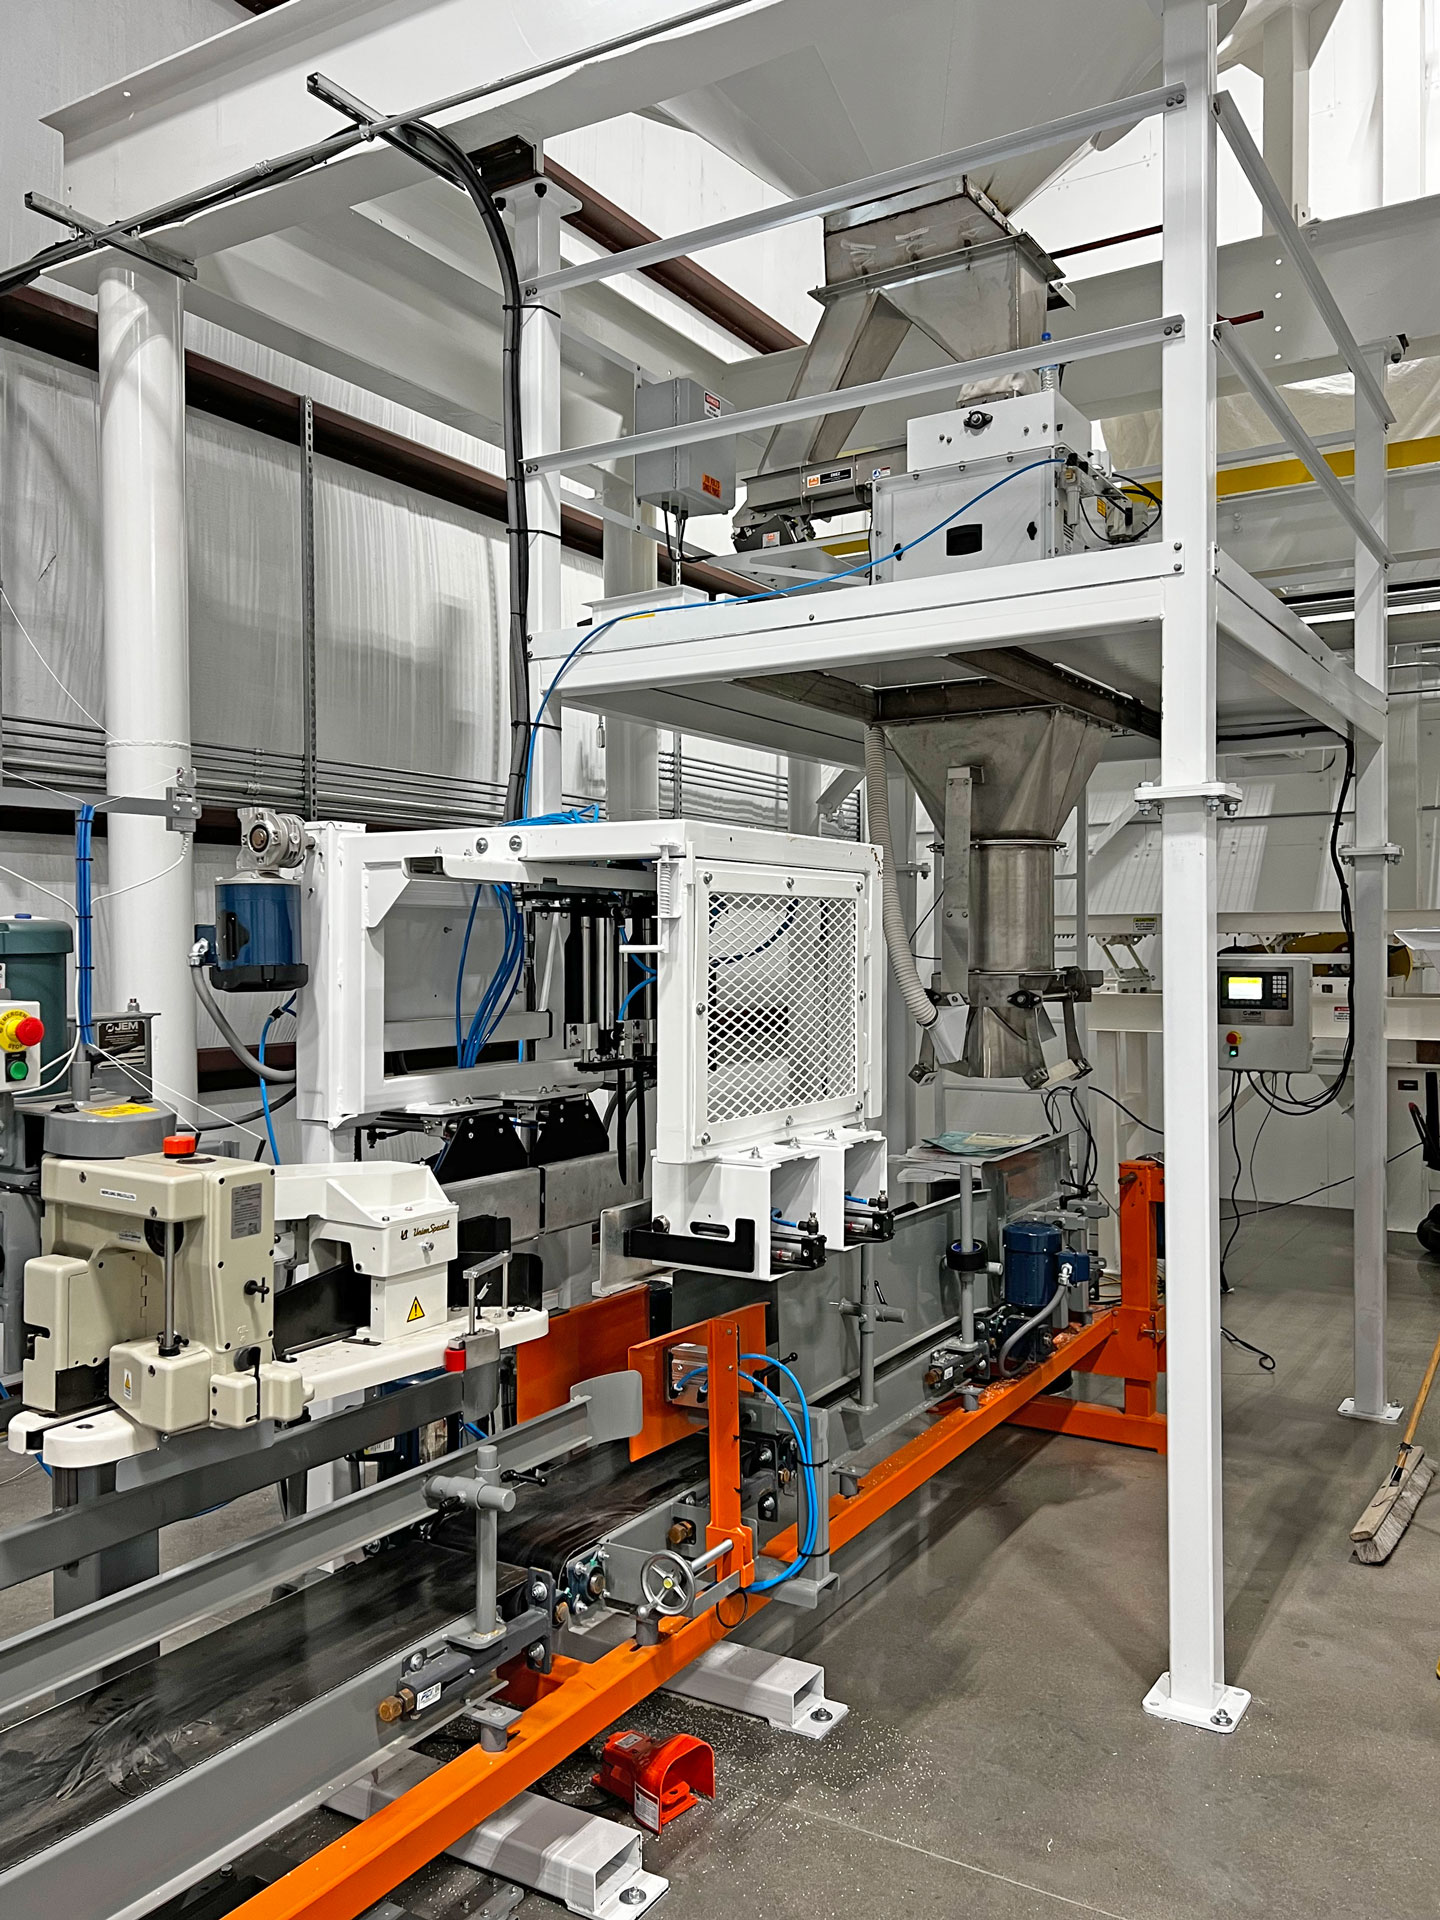
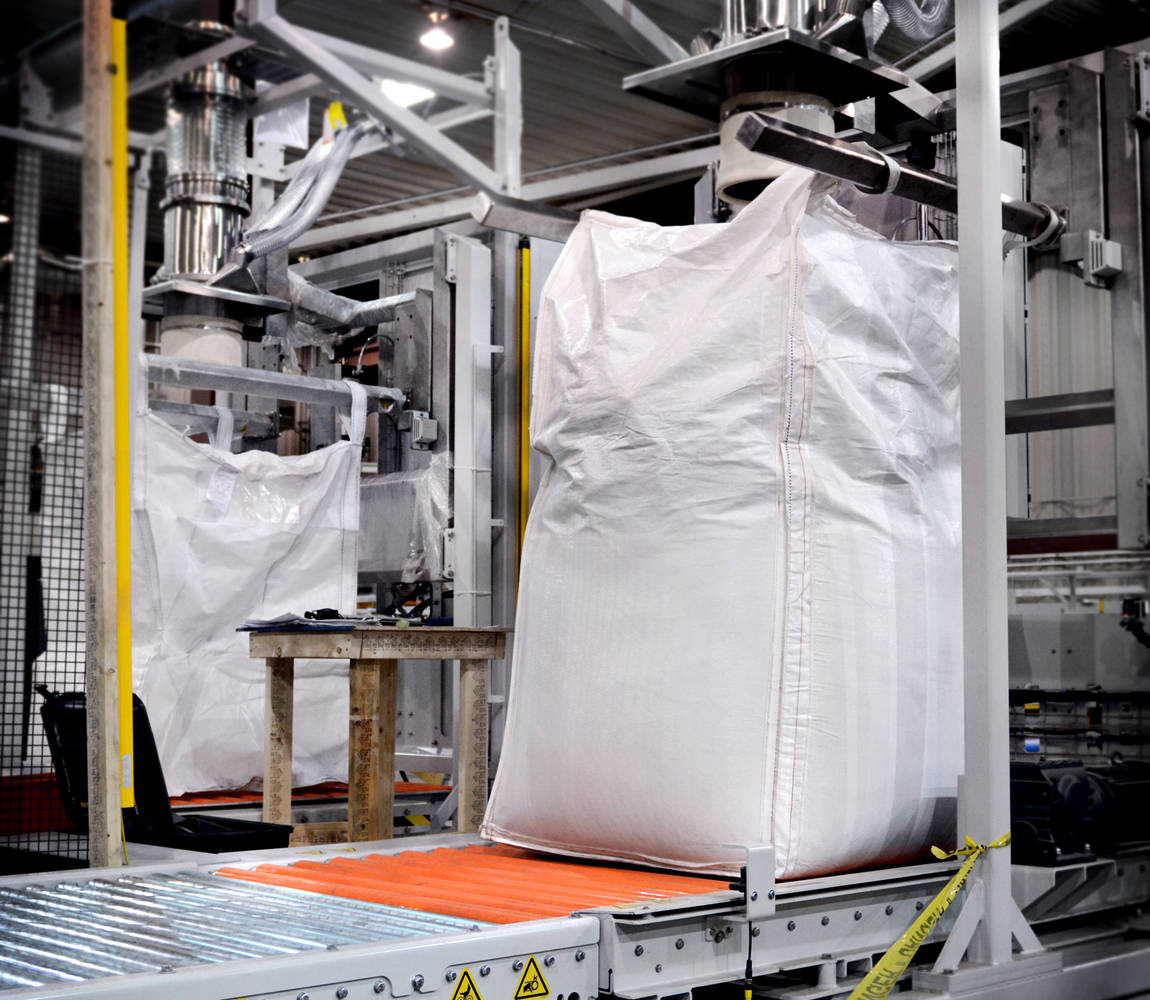
Automatic bagging lines that look identical on a spec sheet can diverge by 30–45 % in lifetime cash outflow. The delta is driven less by the FOB tag ($50 k–$80 k for a mid-speed form-fill-seal unit; $120 k–$180 k for a 30+ bpm robotic wicketed line) and more by four post-purchase wallets: energy, maintenance labour, spare-parts logistics, and residual value.
Energy Efficiency: 7–10 % of Purchase Price per Annum
Kilowatt mapping across 42 installed machines (North America & EU, 2022-24) shows name-plate motor ratings understate real consumption by 18 % once compressed-air, heat-seal bars, and vacuum generators are metered. Lines fitted with permanent-magnet servo drives and regenerative braking cut draw to 0.55 kWh per 1 000 bags vs 0.82 kWh on legacy VFD sets. At $0.11 / kWh industrial tariff, the gap equals $7 k–$9 k yearly on a two-shift operation—enough to offset a 6 % price premium in <20 months. Carbon-price passthrough in EU markets adds another $15–$20 per tCO₂e, raising the annualised penalty to $1.1 k–$1.4 k for inefficient units.
Maintenance Labour: $4 k–$7 k per Station per Year
Sealing jaws, tension belts, and HMI batteries follow calendar-based cycles; labour content is 1.8 hrs per intervention on open-frame architectures versus 3.4 hrs on enclosed stainless “hygienic” designs. Regional wage dispersion is material: Midwest US skilled rate $38 / hr, Eastern Europe $18 / hr, coastal China $12 / hr. A global producer running six lines across three regions therefore faces a $140 k annual spread purely due to machine format choice.
Spare-Parts Logistics: Carrying Cost Equal to 4–6 % of FOB
Critical path items—forming tubes, photo-eyes, vacuum cups—carry a 10–14 week lead time if sourced from EU or Japan. Stocking €22 k of safety inventory for a €150 k line pushes carrying cost to €2.2 k yearly (10 % WACC, 5 % obsolescence). Vendors with regional DCs cut lead time to <10 days and allow consignment, trimming cash drag to 1.5 % of FOB.
Resale Value: 35–55 % after 7 Years
Secondary-market data (EquipNet, Resell CNC, 2019-23) shows robotic cells depreciate slower than cam-driven mechanical machines. A 2016 servo wicketed unit retained 52 % of invoice; a mechanical counterpart only 31 %, primarily due to retrofit limitations. Straight-line depreciation for tax purposes therefore overstates economic loss on servo platforms by ~$20 k over a 7-year horizon.
Hidden Cash Outflow at a Glance
| Cost Component | Mid-Speed FFS (US$ 70 k FOB) | High-Speed Wicketed (US$ 150 k FOB) | Notes |
|---|---|---|---|
| Installation & rigging | 8 % | 10 % | Cranes, compressed-air drops, safety guarding |
| FAT / Site acceptance | 3 % | 4 % | Travel, test material, engineer days |
| Operator training (3 shifts) | 4 % | 5 % | Includes refresher in Year-2 |
| Import duties & brokerage | 0 % | 8 % | HS 8422.30, MFN rate into US 0 %; into India 7.5 % |
| Year-1 spare-parts starter kit | 6 % | 7 % | Mandated by vendor for warranty validity |
| Total “hidden” cash | 21 % | 34 % | Capitalised or expensed depending on policy |
Applying a 10 % discount rate, these front-loaded extras erode $0.10–$0.12 of present value per installed dollar, making vendor-financed packages at 4–5 % APR economically attractive even if headline price is unchanged.
Bottom-Line Rule
Model a 10-year horizon, force suppliers to quote kWh per 1 000 bags, maintenance hours per 2 000 run-hours, and guaranteed buy-back price. Contracts that embed energy, uptime, and residual-value guarantees narrow the TCO spread to <8 %, turning sourcing from capital negotiation into an operating-cash-flow arbitrage.
Risk Mitigation: Compliance Standards (USA/EU)
Critical Compliance & Safety Standards: Importing Automatic Bagging Machines into the US & EU
Non-compliant equipment is the fastest route to a forced recall, port seizure, or seven-figure OSHA/FDA fine. UL 508A, CE Machinery Directive, FDA 21 CFR §177.1520, and OSHA 1910.212 are not optional badges—they are the legal minimum for placing a bagger on a US or EU production floor. Any supplier that cannot produce current, third-party-issued certificates should be removed from the shortlist; the cost of retro-fitting or re-exporting a non-compliant line averages $50k–$80k plus 6–10 weeks of lost capacity.
United States Gatekeepers
UL 508A governs the industrial control panel inside every automatic bagger. A missing UL mark triggers Customs & Border Protection (CBP) to issue an “Immediate Detention” notice; detention fees alone run $1k–$2k per day while the machine sits at the port. OSHA 1910.212 covers point-of-operation guarding; a single amputation incident where the guard opening exceeds 6 mm can escalate to a $132k willful-violation penalty under the 2024 penalty schedule. If the film or product contacts food, FDA 21 CFR §177.1520 (olefin polymers) and §175.300 (resinous coatings) must be met; FDA import alerts can blacklist an entire supplier family, not just the model shipped. Finally, NFPA 79 (electrical standard for industrial machinery) is now being enforced by insurers; non-compliant wiring voids coverage and raises property premiums by 15–25%.
European Union Gatekeepers
The CE Machinery Directive 2006/42/EC is self-declared, but the penalties are not. Market-surveillance authorities in Germany and the Netherlands randomly purchase machines from distributors; if the technical file or risk assessment is missing, the product is withdrawn from the entire EEA and the importer is fined €20k–€500k. The EN 415-7 safety standard is harmonized under the Directive; failure to perform the mandated 1,000-cycle stop-time test (≤500 ms) is classified as a “serious infringement.” For food-contact, Regulation (EU) 10/2011 on plastic materials requires specific migration limits (SML) for 900+ substances; exceeding an SML by 0.01 mg/kg triggers an RASFF alert, forcing a continent-wide recall that typically costs €0.9–€1.2 million in logistics alone. RoHS 2 (2011/65/EU) and REACH (1907/2006) are now checked at the same time; a single non-conforming cable can delay customs clearance by 4–6 weeks, adding €300–€500 per day in demurrage.
Cost & Risk Comparison: US vs EU Compliance
| Cost / Risk Driver | US Range | EU Range | Time-to-Cure if Non-Compliant | Typical Legal Exposure |
|---|---|---|---|---|
| Third-party field evaluation (UL 508A or CE) | $8k – $12k | €6k – €10k | 3–4 weeks | Port detention, lost sales |
| OSHA 1910.212 guard re-design | $15k – $25k | €12k – €20k (EN 415-7) | 2–3 weeks | Willful violation fine |
| FDA migration testing (10 plastics) | $5k – $7k | €4k – €6k (EU 10/2011) | 2 weeks | Import alert, recall |
| NFPA 79 wiring rework | $10k – $18k | n/a | 1–2 weeks | Insurance voidance |
| RoHS/XRF screening (cables, sensors) | n/a | €1k – €2k | 1 week | Customs seizure |
| Combined retro-fit budget | $50k – $80k | €40k – €65k | 6–10 weeks | $0.5m – $2m in fines & lost margin |
The table above assumes a mid-range automatic bagger (20–40 bags/min). High-speed servo machines (>80 bags/min) push the upper bound of both cost and timeline because safety PLCs and integrated vision systems require re-validation.
Contractual Safeguards
Insert a “Compliance Escrow” clause: 5% of contract value is held until the supplier delivers (i) UL field-evaluation label or EU-type-examination certificate, (ii) complete technical file with risk assessment, and (iii) material-declaration database covering every polymer that touches product or film. Require product-liability insurance of at least $5 million per occurrence, naming the buyer as additional insured; EU insurers now demand this for any machinery classified as Annex IV under the Machinery Directive. Finally, specify that the supplier bears all customs-related costs if the machine is denied entry—this single line item has saved Fortune 500 importers $100k–$200k per incident in the past 24 months.
The Procurement Playbook: From RFQ to Commissioning
Strategic Procurement Playbook: Automatic Bagging Machines (400-600 words)
RFQ Drafting: Lock Performance Before Price
Anchor every line-item to OEE ≥85 %, MTBF ≥2,000 h, change-over ≤8 min; require bidders to submit two years of field data from three reference sites in the same NAICS code. Insert a 5 % price-reduction clause for every 1 % OEE shortfall measured during FAT. Demand a fixed spare-parts kit (value 3 % of machine price) and a 10-year parts-availability guarantee; failure triggers 20 % escrow release to buyer. State that IP rights for all custom software remain with buyer and that source code is placed in escrow within 15 days of PO acceptance. Require audited financials (EBITDA ≥10 %, quick ratio ≥1.2) and force majeure insurance covering 110 % of contract value. Close the RFQ with a reverse-auction on total cost of ownership (TCO) over 60 months, not capital price alone.
Technical Evaluation & FAT Protocol
Scorecards weight throughput variance (25 %), reject rate (20 %), energy per pouch (15 %), safety MTTR (15 %), data-integration readiness (15 %), life-cycle cost (10 %). FAT must run 8 h continuous on buyer-supplied film and product; any stop >3 min restarts the clock. Reject threshold: >0.5 % seal-leak or >±2 g weight deviation. Insist on witnessing FAT via live stream; travel cost is supplier’s. Capture high-speed video (≥500 fps) of critical stations; file becomes binding quality baseline. Payment milestone: 20 % after FAT sign-off, but retain 0.5 % for every unresolved NCR.
Contract Risk Matrix: FOB vs DDP
| Risk Segment | FOB Shenzhen (Incoterms 2020) | DDP Kentucky (Incoterms 2020) | Mitigation Cost Impact |
|---|---|---|---|
| Carnet & Duty | Buyer absorbs 7.5 %–25 % MFN tariff + Section 301 surcharges | Supplier absorbs; price baked in | 4 %–7 % price delta |
| Freight Surge | Buyer exposed to Shanghai-USWC spot volatility (±60 % 2022-24) | Supplier capped; escalation clause >8 % CPI triggers renegotiation | 0 %–3 % budget risk transfer |
| Forced Labor Audit | Buyer liable for CBP withhold-release order; detention cost $1k/day | Supplier indemnifies; pays $2k/day liquidated damages | 1 %–2 % contract value |
| IP in Transit | Risk transfers at port; limited control over grey-market exposure | Supplier owns chain to buyer dock; seals tracked via blockchain | Insurance premium 0.3 % vs 0.6 % |
| Installation Delay | Demurrage after 5 free days: $150/20’GP | Supplier pays detention & storage | 0.2 %–0.4 % savings |
Decision Rule: Choose FOB when buyer’s freight contract is ≥12 % below supplier’s embedded rate and tariff exposure is <6 %. Otherwise DDP caps downside to a 3 % escalation collar.
Commissioning & Performance Bond
Site acceptance lasts 168 h of cumulative runtime; equipment must hit ≥95 % of nameplate speed with Cpk ≥1.67 on fill weight. Insert a 0.25 % weekly service-failure penalty capped at 10 % of machine value. Require a 10 % performance bond released only after 90 days of steady-state OEE. Tie final 5 % retention to IoT dashboard integration—supplier must deliver OPC-UA tags mapped to buyer’s MES within 30 days. End-of-life clause: supplier buys back controller and HMI at 15 % of original price if notified within 36 months of last build, ensuring future parts support.
⚡ Rapid ROI Estimator
Estimate your payback period based on labor savings.
Estimated Payback: —