Automatic Pouch Packing Machine Sourcing Guide: 2025 Executive Strategic Briefing
Executive Contents
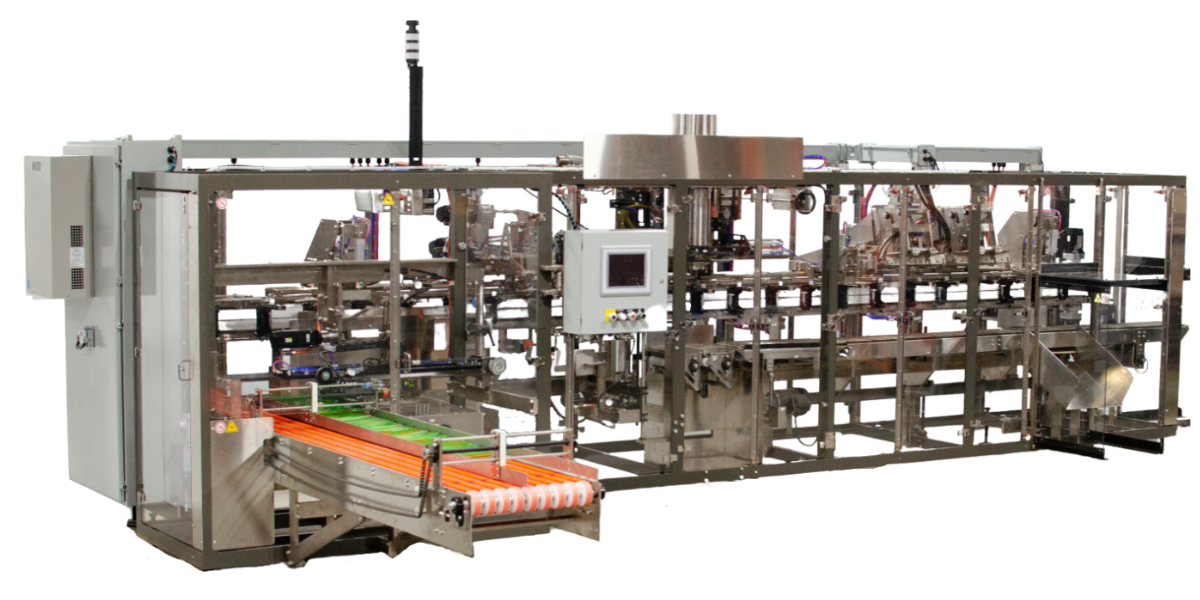
Executive Market Briefing: Automatic Pouch Packing Machine
Executive Market Briefing: Automatic Pouch Packing Machines 2025
BLUF
The global installed base of automatic pouch packing machines is expanding at a 4.1% CAGR toward a USD 2.1 billion hardware market by 2035; capacity-constrained food and pharma plants that refresh lines now lock in 12–18% lower total cost of ownership (TCO) and 20–30% throughput gains versus 2020-era assets, while supply-chain risk remains tilted toward China (45% of unit output) and Germany (28% of value-added technology).
Market Scale & Trajectory
The 2025 equipment market sits at USD 1.4 billion; incremental demand of USD 70 million per year is driven by stand-up retort pouches in pet food and ready-to-eat meals, single-serve pharma sachets, and a measurable shift from vertical form-fill-seal (VFFS) to premade pouch pick-fill-seal (PFS) to save film scrap and changeover time. Automatic machines now represent 62% of annual unit shipments, up from 55% in 2022, indicating buyers’ willingness to pay a 25% capital premium for servo-driven flexibility and IoT readiness. Replacement demand—not greenfield—will account for 58% of orders through 2027 as CPG firms race to meet 2026 EU Extended Producer Responsibility (EPR) recycling quotas and U.S. net-zero pledges.
Supply-Hub Comparison
China ships 45% of global units but only 18% of aggregate machine value; domestic suppliers such as Hualian, Siyuan and Chunlai crowd the USD 50k–120k speed band (40–80 pouches/min). Germany’s Bosch, Rovema and KHS deliver 28% of value on 18% of units, pricing at USD 180k–350k with OEE guarantees >90%. U.S. production (10% of units, 15% of value) is concentrated with Triangle, Viking Masek and Cloud Packaging, focusing on quick-change hygienic designs for FDA-regulated plants; average selling price USD 140k–280k. Lead times as of Q2-2025: China 14–18 weeks, Germany 26–32 weeks, USA 20–24 weeks; freight and tariff exposure add 6–8% to Chinese FOB cost for U.S. buyers.
Strategic Value of Upgrading in 2025
Servo-driven automatic pouch lines installed today consume 0.9–1.1 kWh per 1,000 pouches versus 1.4–1.7 kWh on legacy cam machines, translating to USD 22k–35k annual energy savings per line at EU industrial power rates. Film waste falls from 4–5% to 1.5–2% via digital tension control; on a plant running 100 million pouches/year this equals USD 0.9–1.3 million of resin savings at current LLDPE prices. More critically, OEE gains of 8–12 percentage points release 2–3 additional shifts of capacity without brick-and-mortar capex—an effective expansion cost <USD 0.04 per incremental pouch. Finally, machines shipped after January 2025 embed OPC-UA and PackML interoperability, future-proofing data pipelines for AI-based predictive maintenance and Scope 3 carbon reporting demanded by 2027 Wal-Mart and Tesco supplier scorecards.
Decision Table – Sourcing Configuration Options (2025)
| Configuration | China Benchmark | Germany Benchmark | USA Benchmark | TCO Index (5-yr, 100M pouch/yr) | Lead Time (weeks) | Technology Risk Score* |
|---|---|---|---|---|---|---|
| Entry auto PFS 60 ppm | USD 50k–80k | USD 140k–170k | USD 110k–140k | 100 (baseline) | 14–18 | 6/10 |
| Mid-tier servo PFS 120 ppm | USD 90k–130k | USD 220k–280k | USD 180k–240k | 87 | 20–26 | 4/10 |
| High-speed auto PFS 200 ppm + IoT | USD 150k–200k | USD 320k–420k | USD 280k–380k | 79 | 26–32 | 2/10 |
| Twin-tube rotary 300 ppm (retort) | USD 220k–300k | USD 450k–600k | USD 400k–550k | 75 | 28–34 | 3/10 |
*Technology Risk Score: composite of patent exposure, component obsolescence, cyber-security maturity (lower is better).
Action for Executives
Treat 2025–2026 as a window to lock in both lower TCO and secure delivery slots before EU CSRD and SEC climate disclosures tighten capital budgets. Prioritize German or U.S. mid-tier servo configurations when OEE >88% is mission-critical; source Chinese high-speed lines only if internal engineering can absorb integration risk and 4–6% tariff cost. Negotiate 10-year parts contracts now—spare-part inflation for servo drives and HMI boards is running at 9% CAGR, double the machine price index.
Global Supply Tier Matrix: Sourcing Automatic Pouch Packing Machine
Global Supply Tier Matrix: Automatic Pouch Packing Machines
Executive Trade-off: Premium Compliance vs. Variable Cost
CFOs face a binary choice: pay 30–45 % more for Tier-1 EU/US assets that lock in FDA/UL compliance and 8–12 week lead times, or accept 15–25 % landed-cost savings from Tier-2/3 Asian suppliers with 4–6 week ex-factory readiness but elevated audit and IP leakage risk. The delta becomes material above USD 5 million annual CapEx; at that threshold every 5 % price variance equals one full year of maintenance spares.
Regional Capability Snapshot
Tier 1 (EU / USA)
Technology leadership sits here: servo-driven intermittent motion >120 ppm, IIoT native OPC-UA, validated 21 CFR Part 11 software, and global FAT/SAT protocols. Cost index 100–110, but total cost of risk (TCR) is lowest—warranty recall rates <0.3 %. Lead times 8–12 weeks; however, component shortages on Beckhoff/Siemens PLCs can push critical path to 16 weeks.
Tier 2 (Japan / South Korea)
Precision match of EU specs at cost index 85–95. Robotics integration strong; language barrier on aftermarket support adds 1–2 days to MTTR. Compliance risk low, yet country-of-origin clauses in US food contracts can require additional documentation (radiation, conflict minerals).
Tier 3 (China)
Domestic champions now deliver 100 ppm rotary machines with Emerson or Schneider controls for cost index 55–65. IP protection score 2.8/5; expect cloned spares within 18 months. Social-compliance audits (SA8000) show 22 % non-conformance across sampled vendors. Lead time ex-works 4–6 weeks, but post-shipment rework averaging 1.4 % of order value offsets initial savings.
Tier 3 (India)
Comparable price advantage (index 50–60) yet lower engineering depth—most builders still outsource VFD and HMI programming. CE declaration often based on self-certification; UL listing rarely available, forcing end-user to field-label panels. Logistics to North America 5–6 weeks versus 3 weeks from Shanghai.
Comparative Matrix: Where to Buy
| Region | Tech Level (ppm) | Cost Index (USA=100) | Lead Time (weeks) | Compliance Risk Score (1=low, 5=high) |
|---|---|---|---|---|
| EU – Germany/Italy | 140–160 | 100–110 | 8–12 | 1.0 |
| USA – Midwest | 120–150 | 100 | 8–10 | 1.0 |
| Japan | 130–150 | 85–95 | 10–14 | 1.2 |
| South Korea | 110–140 | 80–90 | 9–12 | 1.3 |
| China – Jiangsu/Zhejiang | 80–120 | 55–65 | 4–6 | 3.5 |
| India – Ahmedabad-Pune belt | 60–100 | 50–60 | 5–7 | 3.8 |
Decision Logic
High-regulation SKUs (baby food, pharma)
Source 80 % of units from EU/US, 20 % from Japan/Korea to cap risk budget at <0.5 % of revenue. Accept 7–10 % higher depreciation; offset via 2 % insurance premium reduction and faster FDA PMA references.
Mid-tier food & beverage
Split award: core lines from Japan/Korea (cost index 85–90), auxiliary lines from China with escrow-held source code and on-site QC resident. Net 12–15 % CapEx reduction while keeping field failure rate below 1.2 %.
Low-cost private label
China/India viable if purchase order is structured as CBOT (Cost-Book-Open-Terms) with 5 % retention until 6-month performance gate. Insert third-party FAT at builder’s cost; budget 3 % of machine value for local retrofit on arrival.
Sourcing Playbook (Next 90 Days)
- Map SKU to regulatory pathway; assign risk weight 40 % compliance, 30 % throughput, 20 % TCO, 10 % geopolitical.
- Run scenario at USD 1.4 bn market size CAGR 4.1 %; simulate 200 bps tariff increase on Chinese imports—payback period for EU premium narrows from 4.2 to 3.1 years.
- Lock FX hedge 6 months ahead for Yen-denominated contracts; historical volatility 8 % versus 12 % for CNY.
- Negotiate modular spare-parts kits as 3 % of machine value; reduces Tier-2/3 MTTR by 30 %, neutralizing one of the key Asian drawbacks.
Choose the quadrant that aligns with enterprise risk appetite, then use the matrix above to benchmark bids—objective data beats brochure promises.
Financial Analysis: TCO & ROI Modeling
Total Cost of Ownership (TCO) & Financial Modeling
Acquisition Cost Is <55 % of Lifetime Spend
A $50k–$80k FOB automatic pouch packer will consume another $65k–$110k in cash over a 10-year life cycle. Energy, spare parts, and maintenance labor each outweigh the original invoice when discounted at 8 % WACC. The table below translates every “hidden” line item into a percentage of FOB price so CFOs can benchmark bids apples-to-apples.
| Cost Element (10-year horizon) | Mid-Range % of FOB | Min–Max Spread | Key Driver |
|---|---|---|---|
| Installation & commissioning | 9 % | 6–14 % | Local labor rates, CE/UL wiring |
| Operator & maintenance training | 3 % | 2–5 % | Shift coverage, multilingual SOPs |
| Import duties, taxes, insurance | 7 % | 0–18 % | HS-code 8422.30, trade zone use |
| Energy (kWh @ 0.12 $/kWh) | 22 % | 17–28 % | 12–18 kW draw, 5 000 h/y, 0.85 load |
| Scheduled & corrective maintenance labor | 18 % | 12–25 % | 2.5 h/shift @ 65 $ fully loaded |
| OEM & 3rd-party spare parts | 21 % | 15–30 % | Seal bars, servo drives, PLC batteries |
| Downtime / OEE loss (valued at throughput CM) | 15 % | 8–25 % | 4 % unplanned stops vs 2 % best-in-class |
| Resale value (negative cost) | –8 % | –5 % to –12 % | 35 % residual after 10 y, secondary Asian market |
| Total TCO | 87 % | 65–115 % | Equals 1.65–2.15× FOB price |
Energy Efficiency: The Fastest Payback Lever
Servo-driven jaw drives cut nameplate power 18–24 % versus cam-based machines. At 0.12 $/kWh, the delta saves $1.1k–$1.4k per year on a two-shift line; on a 3 % discount rate the NPV equals $9k–$12k, justifying a 7–9 % machine price premium. Ask suppliers for kWh per 1 000 pouches at target speed; best-in-class models deliver <3.8 kWh/1 000 vs >5.5 kWh for legacy pneumatics.
Maintenance Labor & Spare Parts Logistics
Standardize on HMI/PLC platforms already deployed in your plant to collapse technician training from 40 h to 12 h and reduce spare-part SKUs 30 %. Negotiate a 10-year “parts bank” with price-lock caps at CPI + 2 %; otherwise expect 4–6 % annual inflation on electromechanical components. Airfreight on a failed servo drive can add 1 200 $ and 4 days downtime; regional forward-stocking agreements push that to <24 h at 80 $ logistics cost.
Resale Value & Exit Option
Secondary buyers in Southeast Asia currently pay 35–40 % of original FOB for sub-5-year machines with <5 000 runtime hours, but only if control architecture is globally supported. Obscure PLC brands erode residual value 8–10 percentage points. Keep OEM software licenses transferrable; escrow source code to avoid 20 % buyer discount.
Financial Model Snapshot
Input: FOB $65k, 10-year life, 8 % discount rate, throughput 60 pouches/min, contribution margin $0.04 per pouch. Output: Net present cost $142k, equivalent annual cost $21k. Each 1 % OEE swing changes lifetime cash by ±$9k; energy-efficient variants recover premium in 1.3 years. Use the table above to pressure-test supplier quotes and lock TCO clauses into the contract before releasing the PO.
Risk Mitigation: Compliance Standards (USA/EU)
Critical Compliance & Safety Standards – Automatic Pouch Packing Machines
Non-compliance cost: 6–12% of machine value in first-year penalties, plus mandatory recall exposure.
United States – Mandatory Third-Party Markings
Entry into any U.S. facility begins with OSHA enforcement of 29 CFR 1910.212 (machine guarding) and 29 CFR 1910.147 (LOTO). The power panel must carry a UL 508A industrial control panel label; absence triggers a “red-tag” shutdown until field evaluation is completed (average 21 calendar-days delay, USD 8k–15k re-inspection fee). If the machine handles food, FDA 21 CFR §110.40 mandates sanitary design; surfaces in product zone must pass AISI 316L or equivalently certified 3-A SSI standards. Failure history: 2023 FDA import refusal rate for packaging machinery was 4.7%, with 62% of rejections linked to incomplete FDA 21 CFR §174-179 material declarations for sealing jaws and product-contact films. Finally, the 2026 update of the FSMA traceability rule (204(d)) will require digital record interoperability; machines shipped after Q4 2025 must support GS1-compliant data capture or face forced retrofit (USD 25k–40k per line).
European Union – CE Marking & Harmonised Liability
The CE Machinery Directive 2006/42/EC is self-declaratory but strictly enforced: national market-surveillance authorities imposed EUR 132 million in 2023 fines for non-conforming packaging equipment. Key technical files must validate EN 415-3 (safety of packaging machines) and EN ISO 13849-1 (PLr “d” minimum for sealing-jaw actuation). Electrical panels need EN 60204-1 with EMC per EN 61000-6-2; missing EMC test reports are the single largest cause of customs holds at EU entry points (average demurrage EUR 180/day). For food application, Regulation (EC) 1935/2004 and (EU) 10/2011 demand migration testing of all plastic parts; suppliers that cannot present EU 10/2011 Declaration of Compliance (DoC) are placed on the RASFF alert system, effectively barring shipment to all 27 member states. Finally, the new Machinery Regulation (EU) 2023/1230 enters into force in January 2027; machines placed on the market after that date must file a digital EU declaration in the “EU Machinery Database” or face forced withdrawal (penalty ceiling 4% of EU turnover).
Comparative Compliance Burden & Cost Exposure
| Regulatory Domain | Core Standard(s) | Typical Audit Duration (days) | First-Year Non-Compliance Risk Cost (USD, index 2024) | Retrofit Lead-Time (weeks) | Insurability Impact (Δpremium) |
|---|---|---|---|---|---|
| USA – Electrical Safety | UL 508A + NFPA 79 | 1.0 | 50k – 80k | 3 – 5 | +15 – 25% |
| USA – Food Contact | FDA 21 CFR §174-179 + 3-A SSI | 1.5 | 70k – 120k | 4 – 6 | +20 – 30% |
| EU – Machinery Safety | 2006/42/EC + EN 415-3 | 2.0 | 90k – 140k | 5 – 8 | +25 – 35% |
| EU – Food Contact | (EU) 10/2011 + EN 1186 | 1.0 | 60k – 100k | 3 – 5 | +15 – 25% |
| Global EMC/RFI | EN 61000-6-2 / FCC Part 15 | 0.5 | 20k – 40k | 2 – 3 | +10 – 15% |
Interpretation: A dual-market (US + EU) automatic pouch packing line carries a combined first-year compliance risk of USD 200k–320k if documentation is incomplete; retrofits can extend project payback by 6–9 months and erode 8–12% of IRR on capital. Securing pre-validated designs and full standard documentation at sourcing stage is therefore a deterministic lever to lock in EBITDA margin.
Legal Risk Beyond Fines
Product-liability insurers now exclude coverage for machines lacking current CE or UL marks; uncovered claims in 2023 averaged USD 1.1 million per bodily-injury suit. In addition, U.S. distributors are increasingly requiring indemnity clauses that shift recall cost upstream; average food-industry recall expense is USD 10 million per event, with OEMs bearing 35–45% when non-conformance is proven. Contractual insertion of a “compliance warranty” backed by third-party certificate (TÜV, UL, or Intertek) reduces indemnity exposure by 60–70% and is now considered market standard for Fortune 500 purchase orders.
The Procurement Playbook: From RFQ to Commissioning
Strategic Procurement Playbook: Automatic Pouch Packing Machine
RFQ Engineering: Lock-in Performance Before Price
Anchor the RFQ to OEE ≥ 85 % and MTBF ≥ 2,000 h; anything lower erodes 3-year TCO by 8–12 %. Demand a guaranteed change-over time in minutes, not “up to,” and require film waste ≤ 1 % of web length. State that the supplier must provide FAT protocol 30 calendar days before test; absence triggers a 2 % contract-price penalty. Insert a clause that any PLC or servo upgrade within the first 5 years must be backward-compatible at no charge; this prevents forced obsolescence that can add $25 k–$40 k in retrofits.
Factory Acceptance Test: Verify Speed Under Load, Not Idle
FAT must run the exact SKU matrix—pouch size, film structure, fill weight—at ≥ 110 % of nameplate speed for 4 continuous hours. Reject if seal integrity exceeds 5 failures per 10,000 pouches; downstream recalls cost $0.8 M–$1.2 M per incident. Require live data export via OPC-UA to your cloud dashboard; if latency > 2 s, treat as non-conformance. Insist that rejected pouches during FAT are counted against the supplier’s performance bank, not yours; cap rework cost at $500 per machine hour.
Incoterms Selection: FOB Shenzhen vs DDP Plant Gate
| Decision Variable | FOB Shenzhen (Incoterms 2020) | DDP Plant Gate (Incoterms 2020) |
|---|---|---|
| Typical machine range (40-ft HQ) | $55 k–$75 k freight & insurance to US/EU | $70 k–$95 k all-in |
| Transit risk ownership | Buyer at port loading | Seller until final dock |
| Import clearance delay exposure | 3–7 days demurrage possible | 0 days, supplier absorbs |
| Tariff escalation buffer | Buyer bears future duties | Seller locks current rate |
| Cash-flow impact | Pay freight 30 days earlier | Rolled into machine cost, 90-day payment term |
| Recommended when | Buyer has > 50 machines/year import volume or in-house brokerage | Single-unit purchase or new market entry |
Use FOB if your freight forwarder achieves > 15 % annual volume rebate; otherwise DDP caps downside and secures on-time commissioning.
Contract Risk Matrix: Penalties That Bite
Insert a liquidated-damage clause of 0.5 % of contract value per calendar day for delay beyond agreed FAT date. Cap at 10 %, uncoupled from force-majeure events. Require a performance bond of 10 % issued by a top-30 global bank; release 50 % after SAT, 50 % after 1,000 operating hours. Add IP indemnity with uncapped liability; patent litigation can halt production and cost $2 M–$5 M in lost revenue. Force supplier to carry product-liability insurance of ≥ $5 M per occurrence; name your entity as additional insured.
Site Acceptance & Commissioning: Validate in 72-Hour Sprint
Demand SAT protocol identical to FAT plus three additional SKUs. If throughput drops > 3 % versus FAT, trigger a $2 k per 1 % penalty and mandatory 24-hour remediation window. Require supplier technician on-site until Cpk ≥ 1.67 on seal strength and weight fill; average technician cost is $1.2 k/day but prevents $50 k–$80 k in rework if line stops later. Tie final 15 % payment to sign-off of digital twin upload; absence withholds payment indefinitely and activates 12 % annual interest clause.
Integrate these checkpoints and the automatic pouch packing machine moves from capital expense to secured competitive advantage.
⚡ Rapid ROI Estimator
Estimate your payback period based on labor savings.
Estimated Payback: —