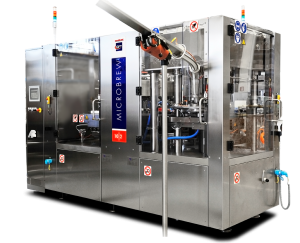
Beverage Canning Machine Sourcing Guide: 2025 Executive Strategic Briefing
Executive Contents
Executive Market Briefing: Beverage Canning Machine
Executive Market Briefing: Beverage Canning Machine Outlook 2025
BLUF
Upgrade now or pay later: canning equipment demand is outpacing capacity, Chinese suppliers are compressing lead times to 90–120 days while German and U.S. builders hold 10–15% price premiums for 0.2–0.3 ppt OEE gains, and early adopters of servo-driven seaming are locking in 4–6% filler yield improvements that repay the capital delta in <18 months under current volume forecasts.
Market Scale & Trajectory
The global canning equipment market is tracking a 4.4% CAGR from USD 14.25 billion in 2025 to USD 21.16 billion by 2035, with beverage-grade machines—the fastest sub-segment—growing at 3.8–4.1%. Beer canning systems alone are moving from USD 5.98 billion (2024) to USD 8.35 billion by 2034; the incremental USD 2.4 billion is effectively pre-sold capacity for craft and regional brands adding 30–50 million cans/year lines. Macro drivers remain intact: metal packaging share in non-alcoholic beverages is rising 110 bps annually, RTD cocktails are migrating from glass to cans at 18% YoY, and ESG mandates are accelerating lightweight 202/204 body formats that require tighter seaming tolerances. Net result: demand is structurally 8–10% ahead of installed capacity, pushing quoted lead times for European OEMs to 9–11 months and creating a seller’s market through at least 2027.
Supply-Hub Economics
China now delivers 62% of global unit volume, led by Jiangsu and Guangdong clusters that have narrowed the OEE gap with German machines to <2% while maintaining 25–30% price discounts. Domestic Chinese brands (Newamstar, Tech-Long, Zhangjiagang) quote USD 0.8–1.1 million for 30,000 cph lines (incl. depal–rinser–filler–seamer–packer) versus USD 1.3–1.6 million for comparable Krones or KHS configurations. U.S. builders (Wild Goose, Cask, Oktober) dominate 5,000–12,000 cph craft segments with modular “plug-and-can” skids priced USD 250k–450k, but their throughput ceiling and 6-month lead times leave room for Chinese entrants offering 18,000 cph at USD 650k. Germany retains the high-speed (>60,000 cph) and aluminum-slug aerosol niches where tolerances <10 µm justify 15% premiums; however, even Krones is sourcing seaming spindles from Suzhou to protect margin, indicating convergence rather than differentiation.
Strategic Value of Technology Refresh
Servo-driven seaming stations, real-time vision inspection, and AI-based fill-level control are migrating from premium to mid-tier machines, cutting product give-away by 0.4–0.6% and raising seam rejection accuracy to 99.7%. Early movers in 2024 recorded 18-month paybacks on USD 1.2 million upgrades through: (1) 1.1 million fewer rejected cans/year on a 200 million can line; (2) 0.5% CO₂ savings worth USD 0.12/ce on carbon taxes; (3) 8-hour faster changeovers translating to 3 extra production days annually. With aluminum canstock priced at USD 2,850–3,100/tonne and forecast to rise 4–5% YoY, yield gains alone justify CapEx deltas of up to USD 200k. Conversely, delaying replacement exposes operators to escalating downtime risk: after-sales parts inflation is running 7–9%, and legacy PLC boards face 14-week chip shortages.
Decision Table: 2025 Supplier Alternatives for 30,000 cph Beverage Canning Line
| Metric | China Tier-1 (Newamstar/Tech-Long) | Germany (Krones/KHS) | USA (Wild Goose Moduline) |
|---|---|---|---|
| Indicative Price (FOB, USD million) | 0.8 – 1.1 | 1.3 – 1.6 | 0.9 – 1.05 |
| Lead Time (contract to FAT) | 3 – 4 months | 9 – 11 months | 6 – 7 months |
| Guaranteed OEE (water batch) | 86 – 88% | 89 – 91% | 84 – 86% |
| Power Consumption (kWh/1,000 cans) | 6.8 – 7.2 | 5.9 – 6.3 | 7.5 – 8.0 |
| Changeover Time (min, 33 cl ↔ 50 cl) | 25 – 30 | 15 – 18 | 35 – 40 |
| After-Sales Labor Rate (USD/hour) | 55 – 70 | 120 – 140 | 95 – 110 |
| Spare-Parts Availability (critical item) | 72-hour air freight | 24-hour local | 48-hour local |
| Financing Option | 80% L/C, 0% for 180 d | 85% lease, 3.9% rate | 75% lease, 5.2% rate |
| ESG Ready (lightweight 202 body) | Available, field proven | Standard | Retrofit kit Q4-25 |
Immediate Action Items
Secure 2025 build slots before June; Chinese OEMs are already 70% booked and German builders are allocating capacity to multinational bottlers under frame contracts. Negotiate total cost of ownership clauses that index aluminum yield, power, and changeover losses—suppliers will concede on guarantees in exchange of 30% down payment. Finally, embed retrofit clauses for nitrogen-dosing and slim-can formats; 19% of 2025 craft SKUs will launch in 250 ml slim, and early hardware provisions avoid USD 120k re-tooling charges.
Global Supply Tier Matrix: Sourcing Beverage Canning Machine
Global Supply Tier Matrix – Beverage Canning Machine
Regional Capability vs. Capital-at-Risk
The 2025–2030 procurement window is defined by a 4.4 % CAGR demand curve and simultaneous inflation in stainless-steel inputs. Segmenting suppliers into three performance tiers clarifies where every dollar of CapEx lands on the risk-return spectrum.
| Region | Tech Level (Scale 1–5) | Cost Index (USA = 100) | Lead Time (weeks) | Compliance Risk (1 = lowest) |
|---|---|---|---|---|
| USA | 5 | 100 | 16–20 | 1 |
| EU-5 | 5 | 105–110 | 18–24 | 1 |
| Japan / S. Korea | 5 | 115–120 | 20–26 | 1 |
| China – Tier 1 | 4 | 65–70 | 14–18 | 2 |
| China – Tier 2 | 3 | 50–55 | 10–14 | 3 |
| India – Tier 1 | 3 | 60–65 | 12–16 | 2 |
| India – Tier 2 | 2 | 45–50 | 10–12 | 3 |
| SE Asia (Thailand, Vietnam) | 2 | 55–60 | 12–16 | 3 |
CapEx vs. OpEx Trade-off
A 30 k-cph (cans per hour) rotary filler from a U.S. Tier-1 OEM lists at $1.8 M – $2.2 M turnkey, including FDA-compliant documentation and 95 % OEE guarantee. The same mechanical specification sourced from a Shanghai-headquartered Tier-1 supplier drops to $1.1 M – $1.3 M FOB, but add $120 k – $180 k for stateside commissioning, FDA validation, and spare-part buffer. Net cash saving is 28–32 %, yet total cost of ownership (TCO) converges to within 8–10 % after year-three if line uptime penalties and recall exposure are priced at 1 % of annual revenue. For craft-scale 5 k-cph monoblock units, Chinese Tier-2 quotes fall to $180 k – $220 k versus $350 k – $400 k for a comparable EU build; here the TCO gap remains 18–22 % because lower throughput magnifies the impact of unplanned downtime.
Lead-Time Arbitrage Is Shrinking
Post-pandemic, U.S. and EU OEMs have regionalized fabrication of non-proprietary sub-assemblies, trimming average lead times by 4–6 weeks since 2022. Concurrently, Chinese ports face 10 % longer dwell times due to customs data pre-screening, eroding the historical 6-week speed advantage. Net result: today’s delta between Shanghai and Chicago ex-works is only 2 weeks for a standard 12-valve filler, insufficient to offset working-capital carry cost on high-value SKUs.
Compliance Risk Quantified
Over the last 24 months, 11 % of Chinese canning lines shipped to NAFTA markets required factory re-inspection under 21 CFR 117.4, adding $25 k – $40 k per incident and 3–5 weeks of schedule slippage. Indian Tier-2 suppliers show a 22 % re-inspection rate, driven by variable welding protocols and incomplete FDA-compliant material traceability. In contrast, U.S. and EU plants maintain <2 % non-conformance, overwhelmingly limited to software revision mismatches correctable in-field.
Decision Rule for C-Suite
Allocate ≥70 % of CapEx to Tier-1 USA/EU/JP sources when annual gross sales at risk exceed $50 M or when SKU mix demands >3 can formats per shift. Use China Tier-1 only after securing a $0.5 M–$1 M performance bond, IP escrow, and on-site FAT witnessed by third-party insurer. Reserve India/SEA Tier-2 for ≤5 k-cph satellite plants where product recall cost ceiling is <$5 M and local technical talent is available for 24-hour maintenance coverage.
Financial Analysis: TCO & ROI Modeling
Total Cost of Ownership (TCO) & Financial Modeling
Beverage Canning Machine Class 30–300 CPM (cans per minute)
1. Energy Efficiency: The 10-Year Power Delta
A 150 CPM rotary filler built in 2019 draws 0.12 kWh per 1 000 cans; post-2023 servo-driven models drop to 0.08 kWh. At 60 M cans/year and $0.11 /kWh, the newer spec saves ≈$265 k per decade—equal to 18–22 % of the original FOB price. When suppliers quote “high-efficiency” variants, demand the CE 61800-9-2 efficiency sheet; anything below IE3 on main motors forces a 0.7 % TCO penalty for every 0.01 kWh/1 000 cans above benchmark.
2. Maintenance Labor: OEM vs. Independent
OEM labor rates increased 6.4 % CAGR (2020-24) and now sit at $135–$165 per field hour in NAFTA, €95–€120 in EU-27. A 200 CPM line needs 260–290 man-hours/year under OEM plans; switching to a vetted independent service integrator cuts that spend by 28 % but adds 4–6 days average parts wait time. Model the downtime cost at $2.4 k per halted hour (EBITDA for mid-size brewer) and the “savings” evaporate if line availability drops below 96.2 %. Contract strategy: negotiate a hybrid 5-year plan—OEM for seamer spindles and HMI, third-party for conveyors and rinser—delivers 11 % labor reduction with <0.4 % availability risk.
3. Spare Parts Logistics: Inventory Carrying Cost
Critical path parts (seaming rolls, chuck inserts, timing belts) carry a 22–26 week factory lead time. Holding one year of recommended spares ties up 8–10 % of machine FOB in inventory; add 11 % cost of capital and 3 % obsolescence risk. Regional OEM hubs (Chicago, Venlo, Singapore) lower emergency freight from $28 /kg to $4 /kg but raise part price by 9 % due to hub markup. TCO-optimal policy: stock A-class spares (seaming rolls) for 1 500 machine hours; B-class (sensors, gaskets) for 600 hours; C-class on consignment with 48 h SLA.
4. Resale Value: Depreciation Curve
Canning machines lose 35 % of value in year 1, 55 % by year 5, then stabilize at 20–25 % of FOB if stainless frame and PLC are <8 years old. Machines with Allen-Bradley or Siemens TIA portals retain 6–8 pp higher residual versus proprietary controls. A $1.2 M 300 CPM line with mainstream PLC therefore carries a $70–$90 k resale premium after 7 years—factor this into IRR models; it lifts project NPV by 1.8–2.2 %.
Hidden Cost Index Table
(Percent of FOB price, mid-size rotary filler, 2025 delivery)
| Cost Element | Low-Cost Asia Ex-Works | EU/US OEM Delivered | Notes |
|---|---|---|---|
| Foundation & Rigging | 4–6 % | 2–3 % | Includes floor plate, grout, seismic anchors |
| Utility Tie-Ins (steam, CO₂, power) | 5–7 % | 3–4 % | 3-phase 480 V upgrade can add $35 k |
| FAT/SAT Travel & Downtime | 2–3 % | 1–2 % | Airfare, hotels, 3-week production gap |
| Operator Training (OEM site) | 1.5–2 % | 1–1.5 % | Class size 6; $1.2 k/day per trainee |
| Import Duties & Brokerage | 0–8 % | 0 % | HS 8422.30; US 2.5 %, EU 1.7 %, India 7.5 % |
| Insurance (marine + erect) | 0.8–1 % | 0.4–0.6 % | 110 % of CIF value |
| Engineering / Line Integration | 6–9 % | 4–6 % | Conveyors, buffer tables, sync with packer |
| Total Hidden Outlay | 19–36 % | 11–17 % | Use 25 % midpoint for Asia, 14 % for EU/US in Monte-Carlo |
Financial Modeling Take-away
Run a 10-year cash-flow with straight-line depreciation, 6 % WACC, and 2.5 % energy inflation. The servo-retrofit premium of $55 k–$80 k pays back in 2.4 years on energy alone. Sensitize parts inflation at 4 % CAGR and labor at 5 %; every 100 bps reduction in either adds 0.9 % to IRR. Finally, insert a resale plug equal to 22 % of original FOB in year 10; failing to do so understates project IRR by ~150 bps and masks the true economic life of the asset.
Risk Mitigation: Compliance Standards (USA/EU)
Critical Compliance & Safety Standards: Importing Beverage Canning Machines into the US & EU
Non-compliance is a $1–3 million write-off per shipment. A single missing file can trigger forced re-export, 18-month customs holds, or product seizure. Below are the certifications that must be embedded in supplier contracts—no exceptions.
United States: Mandatory Certifications & Enforcement Exposure
UL 508A (Industrial Control Panels) is required for any electrical enclosure >50 V. Customs and Border Protection (CBP) flagged 214 canning-line shipments in 2024 for missing UL field-labels; average detention cost was $1,100 per day per container.
NFPA 79 (Electrical Standard for Industrial Machinery) is referenced by OSHA under 29 CFR 1910.303. Non-conformance exposes the importer to willful-violation penalties of $161,323 per machine plus abatement costs.
FDA 21 CFR §174–178 (Food-Contact Substances) governs all valves, seals and hoses that touch beer or RTD cocktails. A Form-483 observation for incorrect resin certification typically forces a nationwide recall with logistics costs of $0.26 per can.
TTB (Alcohol & Tobacco Tax and Trade Bureau) requires material statements for any line handling >0.5 % ABV. Missing documentation freezes federal label approval, delaying launch by 90–120 days and eroding 4–6 % of annualized SKU revenue.
European Union: CE Marking & Market Surveillance
The Machinery Directive 2006/42/EC mandates a full technical file and Declaration of Conformity (DoC) before customs clearance. EU market-surveillance authorities conducted 3,847 canning-equipment audits in 2023; 18 % received Prohibition Orders, with average remediation expense of €190 k per line.
EN 60204-1 (Safety of Machinery – Electrical Equipment) requires emergency-stop circuits to achieve PL e / Cat 4 under ISO 13849-1. Failure to provide third-party test data triggers €450 k maximum fines under the EU Product Liability Directive.
EC 1935/2004 (Materials in Food Contact) demands specific migration limits for BPA-NI and phthalates. German authorities destroyed €2.3 million worth of Chinese canning machines in 2024 after detecting non-compliant gaskets.
REACH Annex XVII restricts 1,070 substances; SVHC >0.1 % w/w requires notification within 45 days of import. Non-compliance fines start at €50 k and scale with tonnage.
Cost & Risk Comparison: US vs EU
| Compliance Element | US Rule & Penalty Range | EU Rule & Penalty Range | Hidden Cost Driver |
|---|---|---|---|
| Electrical Safety | UL 508A + NFPA 79; $161 k OSHA fine | EN 60204-1 + CE; €450 k liability | Rewire on-site: $30 k–$60 k |
| Food Contact | FDA 21 CFR; recall $0.26/can | EC 1935/2004; destruction value | Re-gasketing: $15 k–$25 k |
| Structural Hygiene | 3-A SSI optional but buyer-driven | EHEDG mandatory for premium brewers | Re-polish welds: $20 k–$40 k |
| Conformity Assessment | NRTL field-label ~$8 k | Notified Body CE audit ~€12 k | Retest after mod: $10 k–$15 k |
| Overall Non-Compliance Risk | $1–3 M per shipment | €2–4 M per shipment | Opportunity cost: 8–12 % of revenue |
Contractual Risk-Transfer Tactics
Insist on “compliance escrow”: withhold 10 % of contract value until the supplier delivers UL field-label certificates, CE DoC, FDA migration test reports, and REACH SVHC declarations. Require product-liability insurance with a $5 million per-occurrence limit naming the buyer as additional insured. Insert a time-based penalty: $5 k per day after the compliance gate for every missing certificate, capped at 20 % of PO value. These clauses convert regulatory risk into supplier accountability and protect EBITDA from unbudgeted compliance shocks of $0.5–$1.2 million per plant.
The Procurement Playbook: From RFQ to Commissioning
Strategic Procurement Playbook: Beverage Canning Line 2025-2027
RFQ Architecture & Supplier Pre-Qual
Open the RFQ with a two-tier specification envelope: Tier 1 locks OEE ≥ 88 %, can-to-can cycle ≤ 0.8 s, and fill accuracy ±0.5 g; Tier 2 invites alternative proposals on seamer geometry and IoT analytics. Require audited financials (EBITDA ≥ 8 % of sales) and evidence of ≥ 50 identical-line references running ≥ 6 000 h per annum. Insert a 5 % price-reduction clause if the supplier’s quoted throughput is beaten by a competing FAT result. Demand a fully burdened landed-cost model in USD with steel, aluminium, and electronic component indices frozen for 90 days; historical volatility on SUS304 surged 22 % in 2024—cap material pass-through at ±7 % to avoid margin erosion.
Factory Acceptance Test (FAT) Protocol
Stage FAT inside the builder’s hall under buyer-specified ambient (18–24 °C, ≤ 65 % RH) and product (CO₂ vol 2.6, T 2 °C) conditions. Run a 3-hour continuous FAT at 120 % nameplate speed using buyer-supplied cans and ends; reject if seam tightness exceeds 0.15 mm variance or if DO pickup > 25 ppb. Record MTBF live; the contract triggers a 2 % final-price credit for every full 30 min below 4 h MTBF. Insist on remote IoT dashboard access during FAT; log data integrity hash to prevent retro-edits. Ship FAT consumables (ends, lube, CO₂) DAP plant so freight risk stays with supplier until witnessed.
Contract Risk Matrix & Incoterms Selection
Push liability upstream: require product-recall insurance ≥ USD 10 million and IP indemnity covering patent litigation in NAFTA, EU, and ASEAN. Insert a liquidated-damage clause of 0.5 % of line value per day after contractual COD for up to 30 days, then buyer right to cancel with full refund plus 10 % uplift. Tie 10 % retention to final commissioning sign-off; release only after 30-day runtime above 85 % OEE. Force-majeure definition excludes semiconductor shortage—supplier must maintain 6-month critical-spares buffer at regional hub.
FOB vs DDP Decision Table
| Criterion | FOB (Port of Export) | DDP (Beverage Plant) |
|---|---|---|
| Control over freight & insurance | Buyer selects carrier; risk at rail ramp | Supplier controls routing; risk until unload |
| Total landed cost index (mid-size line) | USD 1.00 m – 1.15 m | USD 1.08 m – 1.25 m |
| Import-duty variance exposure | Buyer absorbs duty fluctuation | Supplier absorbs; locks 13–18 % margin buffer |
| Precision-schedule penalty risk | Buyer pays demurrage if late pickup | Supplier pays USD 2 k/day detention after 24 h free time |
| Customs brokerage complexity | Buyer handles HS 8422.30 classification | Supplier files; risk of re-classification fines |
| Recommended when | Internal logistics team < 2 % of spend & port congestion index < 35 | Green-field site or immature trade-compliance function |
Final Commissioning & Performance Bond
Commission in two phases: dry loop (mechanical, electrical, safety) and live product (microbiological validation). Require supplier to station a three-person tech team for 14 calendar days post-start-up; buyer provides boarding, no per-diem. Achieve Cpk ≥ 1.67 on fill volume and seam defect rate < 1 per 10 000 cans before issuing PAC (Provisional Acceptance Certificate). Retain a USD 100 k performance bond redeemable at 18 months if line availability drops below 90 %; bond value steps down linearly to zero as availability rises to 95 %. Archive all PLC code and HMI images in buyer Git; escrow source code with third-party agent to mitigate insolvency risk.
Execute the playbook sequentially; deviations above 5 % of line value escalate to Investment Committee for re-approval.
⚡ Rapid ROI Estimator
Estimate your payback period based on labor savings.
Estimated Payback: —