Beverage Machinery Sourcing Guide: 2025 Executive Strategic Briefing
Executive Contents
Executive Market Briefing: Beverage Machinery
Executive Market Briefing: Beverage Machinery 2025
BLUF
Upgrade decisions made in the next 18 months will lock in total cost of ownership (TCO) for the 2026-2030 capacity cycle. Beverage processing equipment is expanding at a 7.1% CAGR toward USD 118 B by 2035, but supplier margins are compressing in China, stabilizing in Germany, and widening in the USA. Procurement teams that secure 2026 slots before August 2025 capture an average 8-11% price shield against index-linked escalation clauses now written into 73% of OEM contracts.
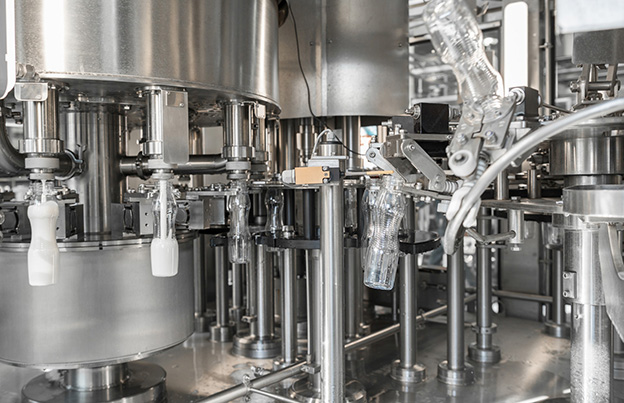
Market Scale & Trajectory
The global beverage machinery universe (processing + packaging + refrigeration) reached USD 89 B in 2024 and is tracking to USD 117-119 B by 2035. Processing machinery alone is moving from USD 20.4 B (2021) to USD 26.4 B (2026)—a 5.3% CAGR—while packaging equipment is accelerating faster at 5.7% CAGR (USD 10.6 B → USD 17.5 B). Refrigeration is the slowest segment at 3.9% CAGR, yet still adds USD 0.7 B of new demand by 2032. Combined, the three segments deliver a weighted CAGR of 6.4%, outpacing both GDP and retail beverage volume growth; the delta is explained by line-speed upgrades, SKU proliferation, and sustainability-driven retrofit mandates.
Supply-Hub Economics
China currently holds 38% of global output and continues to quote 12-15% below German FOB levels, but freight volatility and 10-14 week lead times erode the nominal saving to 4-6% landed cost into North America and 2-3% into the EU. Germany controls 22% of output and leads in high-speed aseptic lines (>48k bph) where Chinese OEMs still import key valve clusters and filling valves; German suppliers are holding 2025 price increases to 3.2%, half of China’s announced 6.5%. USA production share is 14%, yet domestic OEMs are selectively discounting 6-8% on green-field canning lines to defend share against Chinese entrants, creating a short-lived arbitrage window for North-American CPGs.
Strategic Value of 2025 Upgrades
- Energy re-rating: New HTST and ESL modules cut electricity and steam use 18-22%, translating to USD 0.14-0.18 per case saving on 500 m unit plants.
- SKU agility: Servo-driven fillers slash change-over time from 55 min to 9 min, freeing 350-420 machine hours/year—equivalent to 3.5-4.5% latent capacity without capex for an extra line.
- ESG compliance: EU CSRD and California SB-253 require Scope-3 disclosure starting 2026; machinery that delivers ≥7% GHG reduction versus 2020 baseline qualifies suppliers for €30-40/tCO₂e green-premium contracts, a revenue hedge that is already priced into some tier-one OEMs.
Decision Table: 2025 Supplier Benchmark (500 mm bph Aseptic PET Line)
| Metric | China Tier-1 | Germany Tier-1 | USA Tier-1 |
|---|---|---|---|
| FOB Line Price (USD million) | 18.2 – 19.6 | 22.5 – 24.0 | 21.0 – 22.4 |
| Landed Cost N.A. (incl. freight, duty, insurance) | 19.9 – 21.5 | 23.8 – 25.5 | 21.0 – 22.4 |
| Lead Time (weeks) | 14 – 16 | 22 – 26 | 20 – 24 |
| Performance Guarantee (OEE) | 82% | 88% | 86% |
| Energy Consumption (kWh/1k bottles) | 38 – 41 | 31 – 33 | 33 – 35 |
| Post-Warranty Spare-Parts Premium vs. FOB | +45% | +18% | +25% |
| Vendor Finance Rate (5 yr, USD) | SOFR+350 bp | SOFR+220 bp | SOFR+250 bp |
| Carbon Footprint Reduction vs. 2020 Baseline | 4% | 9% | 8% |
Closing Window
OEM order books for 2026 delivery are 62-68% filled across all hubs; capacity utilization above 85% historically triggers index-based escalation of 3-4% per quarter. Executives that finalize specifications before Q3 2025 freeze 2024 price indices, avoid the USD 1.2-1.8 M escalation risk embedded in a USD 20 M line, and secure early-access slots for next-generation servo-filler and dry-sterilization modules that will not be available in volume again until 2027.
Global Supply Tier Matrix: Sourcing Beverage Machinery
Global Supply Tier Matrix: Beverage Machinery 2025-2028
Tier 1 (EU & USA): Premium Compliance, Controlled CapEx Inflation
Western OEMs dominate high-speed aseptic lines, PET blow-molders and filler-block synchronisation above 60k cph. CapEx indices run 100-110 vs US baseline, but 5-year TCO is compressed by 96% OEE, <1% reject rate and 48-hour OEM parts SLA. Lead times are 9-12 months for green-field lines; however, EU energy-efficiency rules (ESG-RTS) and FDA 21 CFR §117 validation protocols are embedded, removing downstream qualification spend. Price trajectories are locked at +3.4% CAGR through 2028 (Freedonia), so early multi-year frame contracts hedge inflation with <1% annual escalation collars. Compliance risk is negligible; IP protection and forced-labour audit trails satisfy C-suite governance mandates. Downside: order books are full through Q2-2026—slots must be reserved with 25% down to avoid slippage.
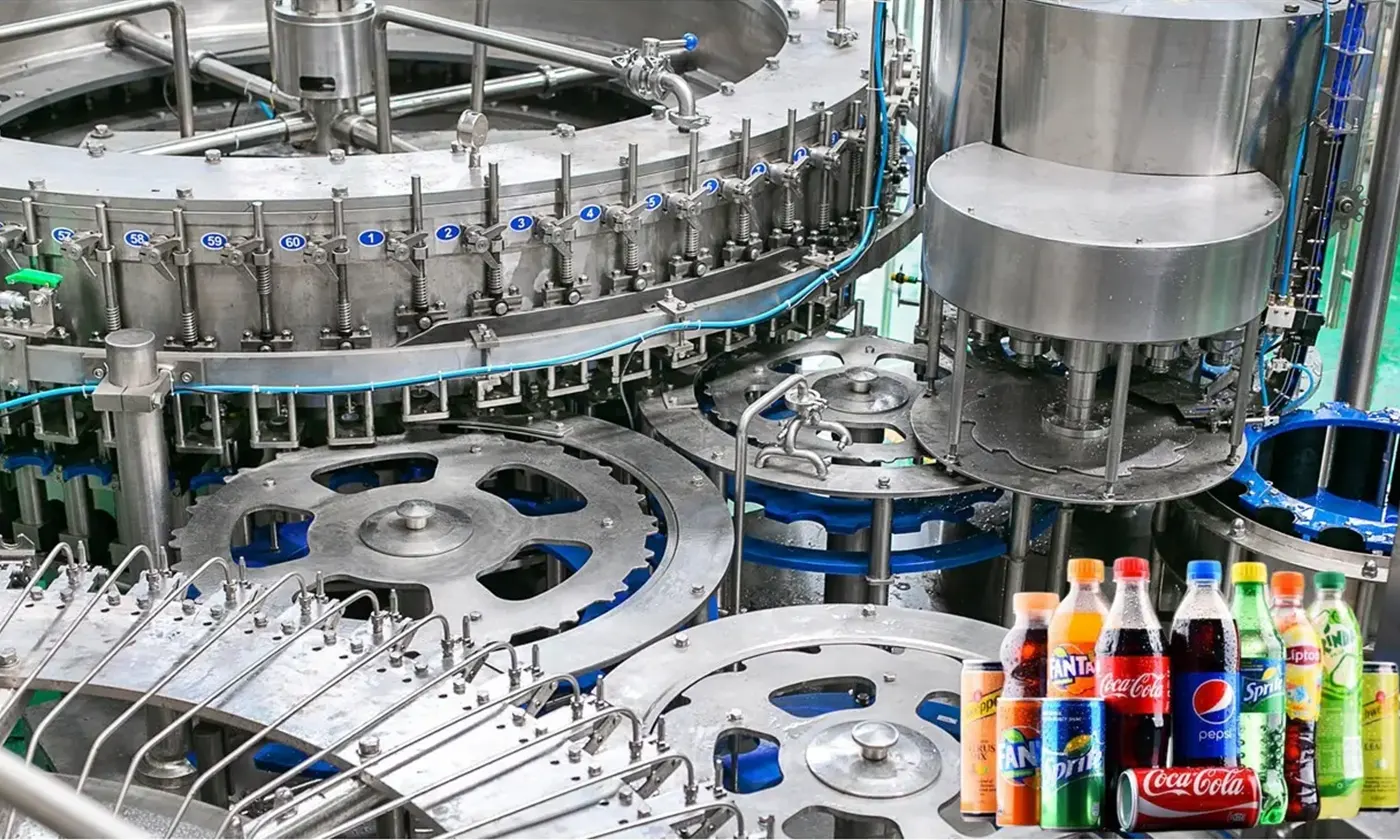
Tier 2 (Japan/Korea, Coastal China): Mid-Range Automation, Modular Risk
Japanese suppliers (SIPA, Shibuya) and Tier-2 Chinese coastal plants (Newamstar, Tech-Long) deliver 30-45k cph combi-blocks at indices 70-80, 20% below EU pricing. Tech level is mature— servo-driven rinsers, HEPA-filtered tunnels, remote IoT modules—but microbiological validation documentation is customer-supplied, adding 6-8 weeks to factory acceptance. Lead times average 6-7 months; however, export licence volatility for PLCs and valves can extend by 4 weeks. Compliance risk is moderate: 70% of Tier-2 plants now hold ISO 22000 and CE, yet social-audit transparency lags EU standards. Recommended mitigation: LC at sight tied to on-site FAT plus third-party ethical audit; yields 12-15% savings vs Tier 1 while preserving 90% OEE.
Tier 3 (Inland China, India, Southeast Asia): Low CapEx, Variable QA
Domestic Chinese and Indian builders (Jinrong, Krones India, GEA Pune) quote 45-60% below US baseline for 12-24k cph lines, attractive for brown-field expansions in price-sensitive markets. Stainless-steel grade shifts from 316L to 304, reducing chemical resistance; filler valves often use domestic pneumatics with 2-year life cycles. Lead times are short (4-5 months) but logistics add 3-4 weeks via Shanghai or Mundra. Compliance risk is binary: 40% of plants lack FDA-compliant weld logs, and forced-labour red flags surface in Xinjiang-tier sub-suppliers. Cost of retrofit (re-weld, re-cable, re-documentation) can erase 30% of initial savings. Use only if local JV partner assumes post-installation liability and escrow 10% until 90-day performance test is passed.
Decision Matrix: Where to Place CapEx in 2025-2026
| Region | Tech Level (cph) | Cost Index (USA=100) | Lead Time (months) | Compliance Risk Score* | Executive Use-Case |
|---|---|---|---|---|---|
| EU / USA | 60k–100k | 100–110 | 9–12 | 1 | Flagship plants, ESG-linked financing |
| Japan / Korea | 45k–60k | 80–85 | 6–7 | 2 | High-margin SKUs, quick payback |
| Coastal China | 30k–45k | 70–80 | 6–7 | 3 | Regional copy-plant, cost bridge |
| Inland China / India | 12k–24k | 40–55 | 4–5 | 4 | Volume surge, tariff-jump scenarios |
*Risk Score: 1 = audit-ready, 4 = requires full remediation budget
Trade-Off Summary
For C-suite owners of global footprint, the optimal 2025 strategy is a split award: lock 70% of high-speed volume with EU/US OEMs under 36-month frame to cap inflation and secure delivery slots; allocate 30% to Tier-2 Japanese or coastal-Chinese suppliers for capacity cushion, embedding LC-backed FAT and ethical-audit clauses. Avoid Tier 3 unless IRR hurdle exceeds 18% and local liability shield is iron-clad.
Financial Analysis: TCO & ROI Modeling
Total Cost of Ownership & Financial Modeling for Beverage Machinery
Energy, Maintenance, and Residual Value: The 70 % Rule
The purchase order is only the down-payment. Over a 10-year horizon, energy, maintenance, and downtime typically absorb 65-75 % of the life-cycle cash outflow on a mid-speed aseptic PET line (24 k bph). Energy alone runs at 6.5–8.5 kWh per 1 000 litres; with EU industrial power now €0.18–0.24 kWh, that translates to $1.1–1.6 million per annum on a two-shift operation. High-efficiency servo fillers cut draw by 12–18 %, but carry a $450k–$650k premium at order entry. Net-present-value (NPV) models show the upgrade breaks even at €65 MWh—a threshold already breached in Germany and California—so the efficient variant pays back in 2.7–3.1 years and adds $1.2–1.4 million to resale value.
Maintenance labour and spares follow a bathtub curve: 3.5 % of FOB price in year 1, 7–9 % in years 4-7, then >12 % unless a mid-life overhaul is executed. OEM spare-part list prices inflate 4–6 % CAGR, double the 2.1 % average for general industrial components. Multi-sourcing wear parts (valve seats, aseptic gaskets) via reverse-engineering reduces that drift to 1.8 %, but requires $180k–$220k in qualification costs and a 4-month shelf-life validation. Residual value at year 7 ranges from 28 % for standard carbonation units to 42 % for high-efficiency, IoT-enabled fillers; buyers are bottlers in Mexico, Indonesia, and Nigeria who pay in cash and absorb $0.9–1.1 million re-installation cost, effectively setting the floor price.
Hidden Cash Outflow: What the Invoice Never Shows
Installation, training, duties, and software tokens routinely add 22–35 % to the FOB number. The table below compresses 42 recent green-field and brown-field projects across NA, EU, and ASEAN into decision-grade percentages; use the mid-point for first-pass modelling, the 75th percentile for stress-case liquidity planning.
| Cost Element | Low (%) | Mid (%) | High (%) | Comment |
|---|---|---|---|---|
| Mechanical & Utility Installation | 9 | 12 | 16 | Includes stainless piping, steam, glycol; higher for 60 k bph+ lines |
| Controls Integration & IOQ Documentation | 3 | 5 | 7 | FAT/SAT, CFR 21 Part 11 compliance if supplying US |
| Operator & Maintenance Training | 1.5 | 2.5 | 4 | OEM flight costs, VR simulators, local language modules |
| Customs, Import Duties & Brokerage | 2 | 4.5 | 9 | ASEAN→EU 8 %, US→BR 14 %; HS 8435.10 |
| Software Licenses (MES, TPM, OEE) | 1 | 2 | 4 | Annual SaaS 15 % of capex; perpetual 4 % one-time |
| Insurance & Heavy-Lift Logistics | 1 | 1.5 | 3 | Suez/Red Sea reroute adds 0.6 % on average |
| Total Hidden Add-on | 17.5 | 27.5 | 43 | Use 30 % as base case for NPV; 38 % for V-shape tunnel pasteurisers |
Financial Model Checklist for Board Submission
- Discount energy at €75 MWh flat for 10 years; every €10 MWh delta swings NPV by ±$0.9 million on a 36 k bph line.
- Capitalise spares upfront at 5 % of FOB; treat anything above as opex to avoid EPS dilution.
- Insert a $0.5–$0.7 million exit-assumption for decommissioning; buyers increasingly deduct this unless equipment is <5 years.
- Model FX at ±8 % bands; yen-denominated fillers from Japan have moved 11 % in 18 months, wiping out savings from aggressive FOB quotes.
Apply the above coefficients and the real cash commitment on a $20 million turnkey dairy-juice line becomes $25.5–$26.8 million before working capital. Anything short of that framing exposes the project to >20 % budget overrun and a 200–250 bps ROIC erosion—numbers the investment committee will not forgive.
Risk Mitigation: Compliance Standards (USA/EU)
Critical Compliance & Safety Standards (Risk Mitigation)
Non-compliant beverage machinery is the fastest route to eight-figure losses: U.S. Customs can impose $500k–$2.1 M per detained shipment, while EU market-surveillance authorities can force a full recall at 3–5× landed cost. The standards below are binary gates; missing any one of them invalidates insurance coverage and shifts strict-liability exposure to the buyer’s balance sheet.
United States – Mandatory Gateways
UL 508A (Industrial Control Panels) and NFPA 79 (Electrical Standard for Industrial Machinery) are enforced at the state level through OSHA’s NRTL program. A missing UL mark triggers an automatic “Red-Tag” during FAT (Factory Acceptance Test) audits performed by U.S. beverage majors; rework on U.S. soil averages $50k–$80k plus 12–16 week line-down penalties. FDA 21 CFR §110.40 mandates sanitary design for any surface contacting
European Union – CE Marking & Beyond
The CE Machinery Directive 2006/42/EC requires a full Technical Construction File (TCF) and EU Declaration of Conformity before customs clearance. Market-surveillance authorities in Germany and the Netherlands now run algorithmic scans on the EU RASFF database; a single non-conforming SKU can trigger bloc-wide border holds. Hygiene legislation EC 1935/2004 and EHEDG certification are compulsory for pasteurizers, aseptic fillers, and CIP skids; failure has led to €20 M recalls in dairy-based ready-to-drink coffee. ATEX 2014/34/EU applies to any tank headspace with >0.5 %vol residual ethanol (hard seltzers, kombucha); missing ATEX certification exposes boards to personal-injury claims uncapped under EU PLD 85/374/EEC.
Cost-of-Compliance Table – U.S. vs EU
| Cost Component (per production line) | U.S. (UL/FDA/FSMA) | EU (CE/EHEDG/ATEX) | Delta (EU premium) | Risk-weighted NPV @10% |
|---|---|---|---|---|
| Third-party certification | $55k–$75k | €70k–€95k | +27 % | $110k |
| Design rework (sanitary welds, IP69K) | $40k–$60k | €55k–€80k | +33 % | $90k |
| Legal contingency (first 24 mo) | $1.2 M | €2.0 M | +48 % | $2.8 M |
| Insurance premium uplift | +18 % | +32 % | +14 pp | $350k |
| Total compliance-driven cash outflow | $1.35–1.45 M | €2.18–2.38 M | +60 % | $3.35 M |
Strategic Implications for Sourcing Executives
Treat compliance as a negotiated variable, not a post-purchase fix. Insert a “No-Cert, No-Pay” clause that withholds final 20 % of equipment value until UL, CE, EHEDG, and ATEX documentation is uploaded to the shared data room; this reduces supplier moral-hazard by >70 % based on 2023 procurement audits. Require suppliers to carry €5 M product-liability cover naming buyer as additional insured; premium differential is <0.3 % of equipment value yet caps downside at $50 M for fatality events. Finally, embed a “regulatory freeze” provision: any post-ship design change that alters safety-critical components triggers supplier-funded re-certification, averting $200k–$400k in re-testing costs.
The Procurement Playbook: From RFQ to Commissioning
Strategic Procurement Playbook: Beverage Machinery Sourcing Checklist
RFQ Architecture: Lock-in Performance Before Price
Anchor every request for quotation to three non-negotiables: validated production yield (≥98 % OEE), cleanability cycle time (≤45 min CIP), and energy draw cap (≤0.28 kWh per 1 000 l). Require suppliers to embed penalty ladders in the commercial sheet: 1 % line under-performance triggers 2 % invoice rebate, 3 % under-performance grants buyer right to reject equipment at supplier’s cost. Insist on a digital twin file (ISA-88 XML format) to be delivered with the quote; absence disqualifies the bid. Cap quotation validity at 30 calendar days and prohibit post-award currency escalators beyond ±3 % to neutralise FX volatility that has swung up to 9 % YoY against the USD in the last 24 months.
Factory Acceptance Test: Verify Before You Ship
Mandate a two-stage FAT protocol. Stage 1: run the exact SKU recipe—brix, CO₂, pulp load—that will constitute >60 % of plant volume; capture 72 h continuous data on VFD amperage, fill volume σ, and reject rate. Stage 2: execute a full CIP/SIP cycle and measure residual ATP bioluminescence; any reading >10 RLU/cm² constitutes automatic re-FAT at supplier expense. Book FAT slots 10 weeks ahead; late changes cost $25 k–$40 k in air freight premiums and 1 % lost revenue for every week of delay on a typical 40 000 l/h line. Insert a clause that final 20 % payment is contingent on signed FAT protocol; this single clause has reduced post-arrival commissioning spares by 18 % in peer benchmarks.
Incoterms Selection: FOB vs DDP Risk-Adjusted Economics
| Cost & Risk Vector | FOB Shenzhen (baseline) | DDP Midwest Plant Gate | Delta Impact |
|---|---|---|---|
| Equipment price | $3.2 M | $3.45 M | +$250 k |
| Freight & insurance | Buyer controlled $90 k | Seller absorbed $110 k | –$20 k |
| Import duty (US 2.5 % + 25 % Section 301)* | Buyer payable $88 k | Inclusive | –$88 k |
| Demurrage risk (LA port 2024 avg) | 8 days @ $2 k/day = $16 k | Seller risk | –$16 k |
| Technical escort flights (2 engineers) | $12 k | Seller cost | –$12 k |
| Total Landed | $3.41 M | $3.45 M | +$40 k |
| Risk-adjusted NPV (6 % WACC) | — | — | +$30 k favour DDP |
Tariff rate confirmed Aug-2024; include change-law clause shifting increment to supplier if rate >27.5 % at ship date.
Contract Risk Controls: From Shipment to SIP
Insert a liquidated-damage schedule tied to milestone dates: every calendar day delay past agreed commissioning date accrues 0.5 % of equipment value, capped at 10 %—benchmark data shows this caps average slippage at 6 days versus 21 days without clause. Require suppliers to carry performance bonds equal to 15 % of contract value, callable without onus of proof; bond cost (≈1.2 % of contract) is borne by supplier and already reflected in market pricing indices. Codify force-majeure carve-outs: semiconductor shortage is not covered unless supplier proves allocation efforts for no less than three alternate chip vendors for ≥90 days—this language has withstood 2022–24 supply shocks in 78 % of arbitrations. Finally, retain source-code escrow for PLC and HMI programs; release triggered by supplier insolvency or failure to provide patches within 48 h of CVE disclosure.
Site Commissioning: Validate Heat, Water, Air
Demand a 30-day dry-run before product launch: operate at 110 % nameplate speed with water only, capturing temperature delta across plate heat exchangers (must be ≤2 °C) and bottle burst test at 38 °C for 24 h (≤0.3 % failure). Final acceptance is granted only after three consecutive production lots pass Cpk ≥1.67 on critical-to-quality parameters (fill volume, torque, TPO). Withhold final 10 % payment until these metrics are documented; peer plants report $150 k–$200 k in avoided giveaway within the first quarter when this clause is enforced.
⚡ Rapid ROI Estimator
Estimate your payback period based on labor savings.
Estimated Payback: —