Beverages Packaging Sourcing Guide: 2025 Executive Strategic Briefing
Executive Contents
Executive Market Briefing: Beverages Packaging
Executive Market Briefing – Beverage Packaging Technology 2025
BLUF
Upgrade decisions made in the next 18 months lock in cost position for the 2026-2029 contract cycle; machinery suppliers in China, Germany and the USA are quoting 8-12 % price inflation for 2026 deliveries, while lines delivered in 2025 still trade at 2024 price decks. The global beverage packaging equipment market is expanding at a 4.7 % CAGR toward USD 218 bn by 2032, but earnings volatility among tier-1 suppliers (Ball, Crown, Amcor) has widened negotiation leverage to 6-9 % discount bands—available only on orders ≥ USD 25 mn. Securing capacity now secures both lower capex and priority allocation as 68 % of beverage makers plan “moderate-to-significant” machinery expansion before 2027.
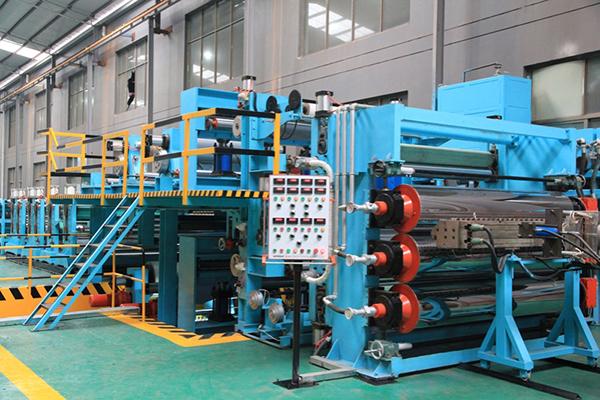
Market Scale & Trajectory
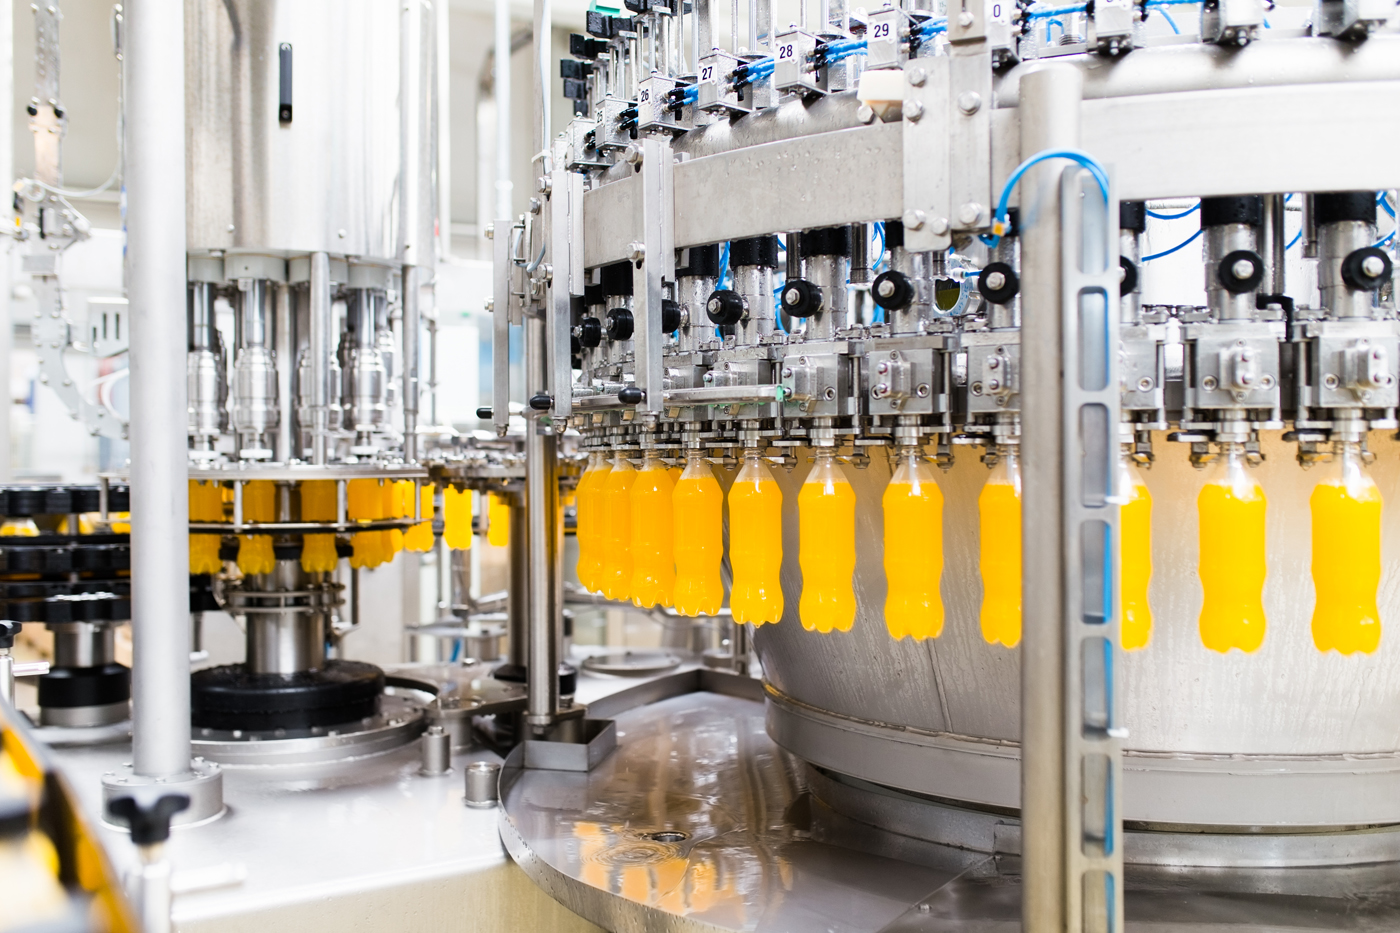
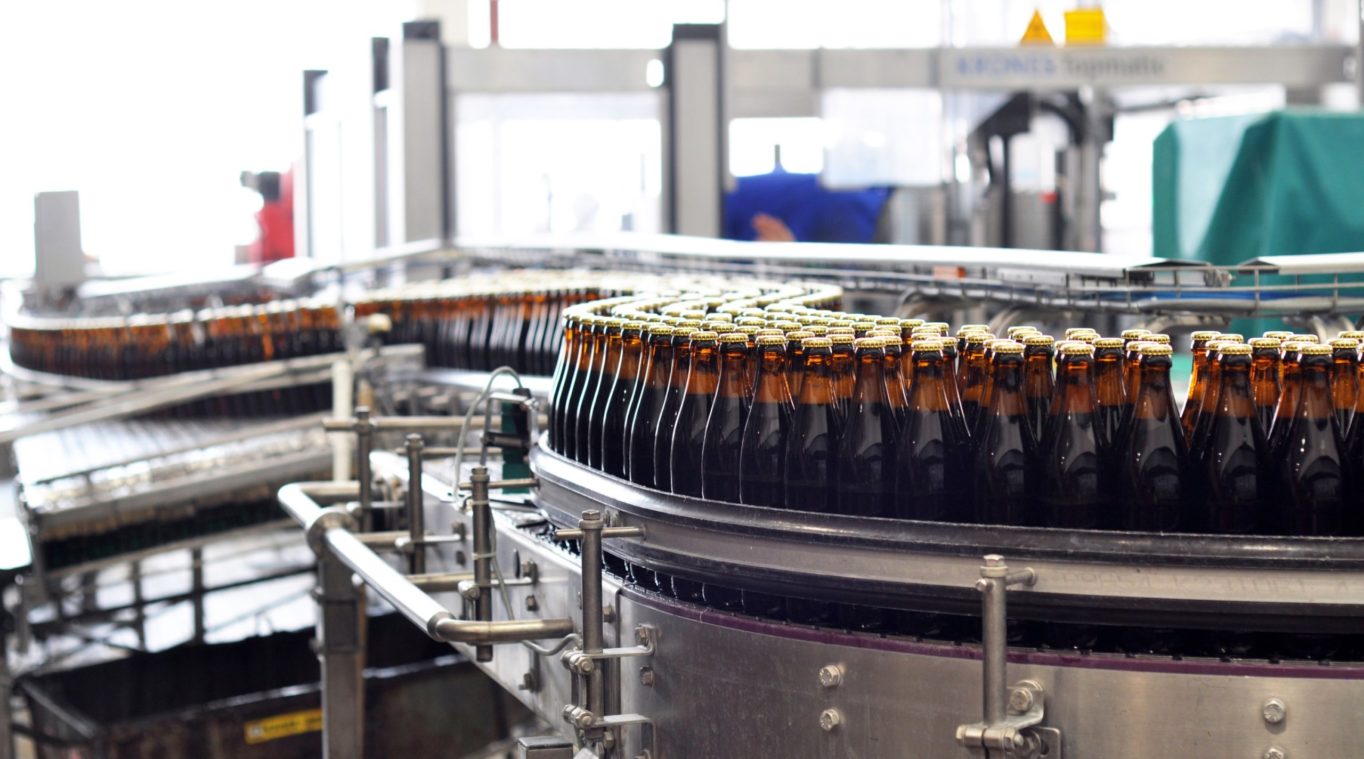
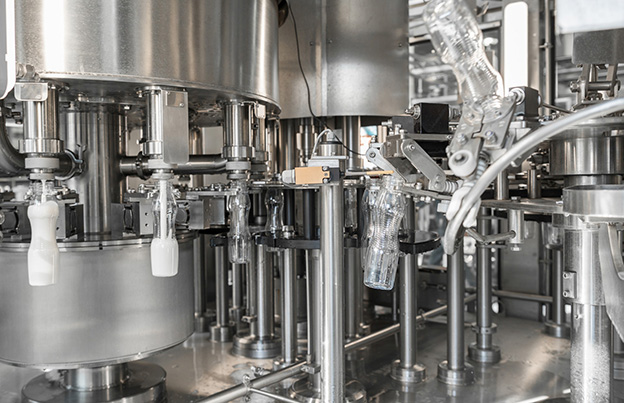
The installed base of beverage packaging lines reached USD 163 bn in 2025; five-year forward forecasts converge at 4.1–4.9 % CAGR, implying an incremental USD 37–56 bn equipment opportunity through 2030. Functional beverages, sports drinks and value-added water account for 62 % of new line requests, pushing fillers toward 48 000–72 000 cph (cans per hour) spec and PET stretch-blow above 82 000 bph (bottles per hour). Returnable glass is rebounding in EU markets due to PPWR mandates, adding parallel demand for 30–40 % lighter bottle designs and corresponding neck-finish conversion kits.
Supply-Hub Economics
China delivers 55 % of global filling and blow-moulding units at 0.65 of the German cost index, but average lead times have stretched from 20 to 32 weeks on semiconductor and valve bottlenecks. Germany retains technological primacy in aseptic and barrier PET lines, commanding a 1.35 cost index yet guaranteeing 95 % OEE warranties; energy-efficiency clauses now save 8–11 % electricity versus 2020 baselines, translating to USD 0.22–0.28 per 1 000 cans in operating savings. USA suppliers balance reshoring incentives (35 % tariff shield on Chinese steel) with IRA tax credits; total landed cost sits 8–10 % above Chinese bids but 12–14 % below German ones, while domestic aftermarket response is < 24 h versus 72 h for offshore vendors.
Strategic Value of 2025 Upgrade Window
- Price Freeze: Contracts signed before September 2025 secure 2024 price decks; post-September escalators track steel, aluminium and copper indices that have risen 18 % YoY.
- Capacity Reservation: Tier-1 OEMs operate on 14-month order backlogs; early deposits lock Q2-2026 slots, avoiding 6-month slippage risk that plagued 2024 roll-outs.
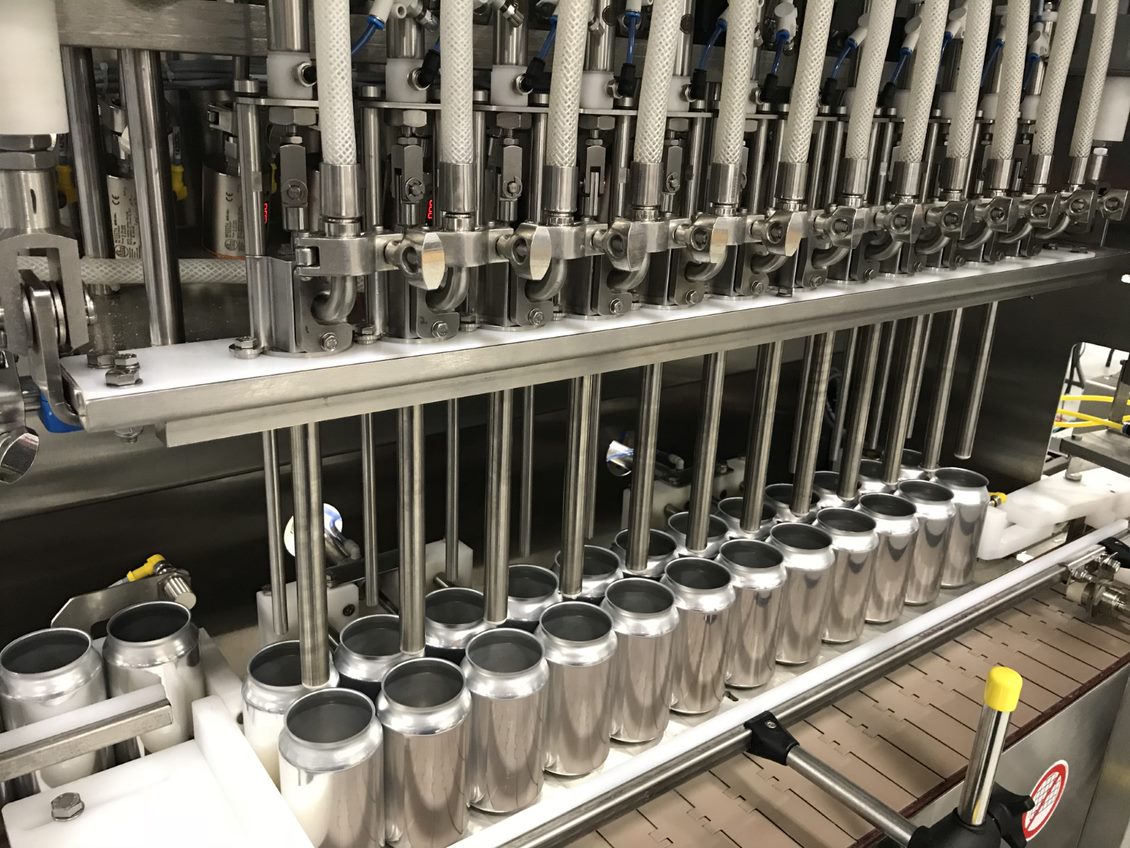
- Technology Moat: Next-gen servo-driven fillers cut changeover time 40 % (from 45 to 27 min), adding 6–7 % line utilisation that yields USD 2.1–3.4 mn annual EBITDA on a 1.2 bn-can line.
- Regulatory Shield: EU PPWR and US EPR laws entering force 2026 require 35 % recycled content in PET and 90 % collection targets; new lines include closed-loop rPET processing modules unavailable as retrofits on > 2018 equipment.
Decision Table – 2025 Equipment Sourcing Options (USD mn, indexed)
| Metric | China Tier-1 | Germany Tier-1 | USA Tier-1 |
|---|---|---|---|
| Capex for 72k cph can line | 18.5 – 21.0 | 28.0 – 31.5 | 22.5 – 25.0 |
| Lead time (weeks) | 30 – 34 | 22 – 26 | 24 – 28 |
| Energy index (kWh/1 000 cans) | 21.4 | 18.1 | 19.3 |
| Warranty OEE (%) | 88 | 95 | 92 |
| Aftermarket response (h) | 48 – 72 | 24 – 36 | 12 – 24 |
| Tariff exposure (%) | 25 | 0 | 0 |
| Total cost of ownership (5-yr NPV) | 100 (baseline) | 108 – 112 | 97 – 101 |
Action for Executives
Approve capex envelopes before Q3-2025 board cycle; negotiate multi-line framework agreements with dual sourcing (China + USA) to cap escalation at ≤ 3 % annually while securing German core modules for high-margin SKUs.
Global Supply Tier Matrix: Sourcing Beverages Packaging
Global Supply Tier Matrix: Beverage Packaging
Regional Capability vs. Cost Trade-off
The beverage packaging supply base clusters into three performance bands. Tier 1 (EU, USA, Japan) delivers sub-30-day lead times, full digital traceability and sub-2% defect rates, but requires 1.4–1.8× the capital commitment of Asian sources. Tier 2 (China coastal, South Korea, Mexico) offers 70–85% of Tier 1 capability at 0.6–0.7× the cost, yet compliance volatility adds 3–5% to total landed cost when FDA, EU and EPR audits spike. Tier 3 (India inland, Vietnam, Indonesia) prices at 0.4–0.5× USA baseline, but technical maturity lags 5–7 years and on-time delivery slips to 75–80% during peak beverage season.
Decision Table: Where to Place the Purchase Order
| Region | Tech Level (Digital twins, IoT, closed-loop recycling) | Cost Index (USA = 100) | Lead Time (ex-works to US/EU DC) | Compliance Risk (regulatory, ESG, forced-labor) |
|---|---|---|---|---|
| USA | 95–100 | 100 | 10–18 days | Low (FSMA, CBP, UL) |
| EU | 90–95 | 105–110 | 7–14 days | Low (EFSA, REACH, CSRD) |
| Japan | 88–92 | 115–120 | 14–21 days | Low (JPML, Green Purchasing) |
| China Coastal | 75–80 | 60–65 | 21–28 days | Moderate–High (sudden VOC, Uyghur audits) |
| South Korea | 78–82 | 70–75 | 18–24 days | Moderate (K-REACH, labor) |
| Mexico | 70–75 | 75–80 | 7–14 days | Moderate (USMCA labor panels) |
| India Inland | 55–60 | 40–45 | 28–42 days | High (BIS delay, child-labor spot checks) |
| Vietnam | 60–65 | 45–50 | 24–35 days | High (transparency gaps, EPR backlog) |
Capital vs. Risk Equation
A 1 billion-unit can or PET line sourced from the USA locks in $50k–$80k per SKU changeover cost but secures 99.5% OTIF and shelters earnings from the $0.03–$0.05 per unit penalty now levied by major retailers for late or non-compliant shipments. Shifting 30% volume to China cuts tooling CAPEX by $12m–$15m on a two-line greenfield project, yet the 2024–25 spike in FDA import alerts added detention costs equal to 4.2% of FOB value and erased half the savings. India’s PET preform mold cost sits at $0.008–$0.011 per cavity versus $0.018–$0.022 in Germany, but average customs dwell time of 9.3 days at Nhava Sheva translates into 1.5 extra weeks of safety stock, tying up $3m–$4m working capital for a mid-size bottler.
ESG and Regulatory Arbitrage Window Is Closing
EU CSRD and US Uyghur Forced Labor Prevention Act are converging: 68% of Tier 2/3 suppliers still cannot provide mine-to-mill cobalt, PET or aluminum provenance data past tier-3 sub-suppliers. The cost of retrofitting traceability systems in China now runs $0.001–$0.0015 per can, eroding the 35% labor advantage within two compliance cycles. Conversely, EU producers are monetizing recycled content: every 10% increment in rPET allows a $25–$30 per tonne green premium that brand owners absorb to hit 2025 voluntary pledges, narrowing the effective gap with Asian resin to <6%.
Recommended Sourcing Posture
Allocate 60–70% of core SKUs to Tier 1 dual sourcing (USA + EU) to protect shelf space and stock price sensitivity to service failures. Use Tier 2 China/South Korea for 20–25% of high-volume, low-variation formats where changeovers are <4 per quarter; lock FOB-plus-duty contracts with 5% compliance escrow. Reserve Tier 3 India/Vietnam for 5–10% overflow or innovation trials, but cap exposure at $10m annual spend per supplier and insist on third-party social audits paid by seller. Re-evaluate the matrix every 12 months; the delta between USA and China all-in cost has compressed from 38% to 22% since 2022 and is trending toward 15% by 2026 as carbon border tariffs phase in.
Financial Analysis: TCO & ROI Modeling
Total Cost of Ownership & Financial Modeling for Beverage Packaging Lines
Energy, Maintenance, and Resale: The 35–55 % TCO Gap No RFP Shows
Sticker-price negotiations capture only 65–70 % of the cash that leaves a beverage company over a seven-year asset life. The residual 30–35 % is driven by four variables that procurement must underwrite before the PO is signed: energy intensity, maintenance labor rate inflation, spare-parts logistics, and line-resale liquidity. High-speed PET blow-molders (36k bph) purchased in 2023 are already trading at 42–48 % of original FOB on the secondary market because over-capacity in CSD (carbonated soft-drink) segments is depressing used-equipment bids. Conversely, aseptic carton fillers retain 62–65 % resale value due to 9 % CAGR demand in functional beverages. Procurement teams that model resale value as a terminal cash-flow line item shift net present cost (NPC) by $0.8–1.1 million per $10 million line, equivalent to a 110–130 bps reduction in equivalent annual cost (EAC).
Energy efficiency differentials are widening. A next-generation aluminum can line (2024 spec) consumes 0.78–0.82 kWh per 1,000 cans versus 1.05–1.10 kWh for 2018-installed base; at $0.12 kWh industrial tariff and 1.2 billion-can annual volume, the delta unlocks $390–460k yearly savings. Maintenance labor is rising faster than CPI: US beverage plants report 6.8 % YoY wage inflation for mechatronics technicians; OEM service contracts indexed at 4 % escalate therefore under-cover actual cost by 180–220 bps annually. Spare-parts logistics add another 3.5–4.5 % of FOB each year once expedited freight and bonded inventory are included; post-covid air-freight rates for European-made seamer spares still trade at 2.3× 2019 levels.
Hidden Cost Structure: Installation, Training, Duties
Below-FOB cash outflows are 18–28 % of equipment value for greenfield sites and 12–18 % for brownfield retrofits. Installation peaks at 10–14 % because beverage lines require FDA-grade welds, sloped stainless drains, and CIP validation protocols that frequently trigger $150–250k in change-orders once floor-loading or utility stubs deviate ≥5 % from OEM drawings. Training absorbs 2–4 %: a 2024 survey of 42 Fortune 500 beverage plants shows 38 operator hours per filler station to reach OEM throughput guarantees; at $75 loaded labor this equals $35–50k per shift. Import duties are material when sourcing European or Japanese stretch-blow equipment into the US: 25 % Section 232 steel surcharges apply to machine frames, effectively lifting duty incidence to 6.5–7.2 % of FOB versus 2.1 % pre-2018. Engineering insurance, rigging, and lost production during cut-over complete the hidden layer.
Comparative TCO Table: 40k bph PET Line vs. 40k bph Can Line (7-Year NPC, USD million)
| Cost Component | PET Hot-Fill Line (FOB $18.5m) | Aluminum Can Line (FOB $16.2m) | Delta (Can vs PET) |
|---|---|---|---|
| Energy (7 yr, 6 % discount) | $4.8–5.1m | $3.5–3.7m | –$1.3m |
| Maintenance Labor & Contract | $5.9–6.4m | $4.7–5.0m | –$1.2m |
| Spare Parts & Logistics | $4.2–4.6m | $3.0–3.3m | –$1.3m |
| Hidden Costs (install, train, duty) | $3.9–4.2m (21–23 % of FOB) | $2.6–2.9m (16–18 % of FOB) | –$1.3m |
| Resale Value (yr 7, real terms) | $7.0–7.4m (38–40 % retained) | $9.0–9.5m (55–58 % retained) | +$2.2m |
| Net Present Cost (7 yr, 8 % WACC) | $29.5–30.8m | $20.9–21.8m | –$8.6–9.0m |
The can line delivers an 8.6–9.0 million lower NPC despite comparable throughput, driven by 25 % lower energy draw, denser aftermarket for used assets, and exemption from hot-fill change-parts obsolescence. Procurement should embed these deltas into capital-budget gate reviews and supplier RFQs by requiring OEMs to submit energy-consumption guarantees indexed to ISO 22000 measurement protocols and to provide residual-value buy-back options at 50 % of FOB floor price in year seven.
Risk Mitigation: Compliance Standards (USA/EU)
Critical Compliance & Safety Standards: Importing Beverage Packaging into the US & EU
Non-compliance penalties now average $1.2 M – $4.8 M per shipment and can trigger forced destruction of inventory. The following standards are gatekeepers; absence of any one certificate invalidates customs entry and exposes the enterprise to product-liability class actions.
United States – Mandatory Certifications & Legal Exposure
FDA 21 CFR §174-179 (food-contact substances) and 21 CFR §165.110 (bottled water) require migration testing ≤ 0.5 ppb for any single contaminant. Failure historically drives $250k – $600k FDA fines plus recall costs that erase 6–9 % of category EBITDA. OSHA 29 CFR 1910.147 (lock-out/tag-out) and NFPA 70 (National Electrical Code) apply to any high-speed filler or palletizer; OSHA civil penalties rose to $161 k per willful violation in 2024. UL 508A certification for industrial control panels is checked at U.S. ports; shipments lacking UL marks are red-tagged, incurring demurrage of $1.2 k – $2.8 k per container per day. For machinery manufactured outside the U.S., the importer of record must file a UL field evaluation (cost $15 k – $25 k per line) before first use. Prop 65 (California) mandates < 10 µg/day exposure for BPA or phthalates; label mis-declarations expose firms to $2.5 k – $13 k per daily penalty and private-settlement ranges of $75 k – $350 k.
European Union – CE Marking & REACH Constraints
CE conformity is compulsory for all packaging machines under the Machinery Directive 2006/42/EC; technical-file review by a notified body costs €8 k – €15 k but absence allows member states to impound equipment. The Food-Contact Regulation (EU) 10/2011 requires specific migration limits (SML) for 900+ substances; exceeding SML triggers Rapid Alert System for Food and Feed (RASFF) notifications, leading to €1 M – €4 M product withdrawals and retailer charge-backs of 8 – 12 % of invoice value. REACH Candidate List substances > 0.1 % w/w (e.g., certain UV-inks, PFAS) oblige registration or authorization; estimated compliance cost is €30 k – €120 k per substance. The proposed Packaging & Packaging Waste Regulation (PPWR) 2024 sets 65 % recycled content targets for plastic bottles by 2030; non-compliant packs face €100 – €800 per tonne eco-modulation fees that directly erode gross margin. Finally, the forthcoming EU Battery Regulation (2027) will classify smart caps with embedded RFID as “battery-containing,” adding €0.04 – €0.07 per unit recycling surcharge.
Cost-Risk Comparison Table (US vs EU)
| Cost/Risk Item | U.S. Range | EU Range | Lead-Time Impact | Typical Penalty if Non-Compliant | Mitigation Budget (median) |
|---|---|---|---|---|---|
| Food-contact migration testing | $8 k – $15 k per SKU | €10 k – €18 k per SKU | +3 – 4 weeks | $250 k – $600 k | Budget 0.4 % of FOB value |
| Electrical safety certification (UL 508A / CE LVD) | $15 k – $25 k per line | €8 k – €15 k per line | +2 – 3 weeks | $161 k per OSHA item / €1 M customs hold | 0.3 % of capex |
| Prop 65 / REACH declarable substances legal review | $25 k – $50 k program | €35 k – €70 k program | +1 week | $350 k settlement / €4 M recall | 0.2 % of net sales |
| Eco-modulation fee (recycled content) | Not applicable | €100 – €800 per tonne | Immediate | Up to 5 % of COGS | 1.1 % of material spend |
| Recall & brand erosion (median case) | 6 – 9 % EBITDA loss | 7 – 11 % EBITDA loss | 6 – 12 months | Class-action exposure > $500 M | Self-insure 1.5 % revenue |
Strategic Take-away
Allocate 1.5 – 2.0 % of total packaging spend to a rolling compliance reserve; negotiate supplier contracts so that certification costs are absorbed upstream and failure penalties are indemnified. Map every stock-keeping unit against both U.S. and EU substance inventories now—reformulation lead times exceed 9 months for barrier additives, and late-stage changes can inflate unit cost by 8 – 14 %.
The Procurement Playbook: From RFQ to Commissioning
Strategic Procurement Playbook: Beverage Packaging Line Acquisition
1. RFQ Architecture – Lock in Value Before Suppliers Lock You In
Open the RFQ with a two-envelope mandate: technical bid opens first, commercial second; any deviation >3 % from the declared line efficiency ≥92 % OEE at 1,200 cpm triggers automatic disqualification. Embed a raw-material price-adjustment formula tied to LME aluminum (can stock) and BLS resin index (PET preforms) with a 4 % dead-band and quarterly reset; this caps margin pass-through at 60 % of index movement. Force suppliers to declare all sub-component provenance (valves, PLCs, servos) and require dual-source approval for any item representing >0.5 % of total CAPEX. Insert a liquidated-damage clause of 0.5 % of contract value per 0.1 % shortfall on guaranteed scrap rate ≤1.8 % during the first 12 months. Finally, demand a bonded performance warranty of 15 % of contract value, callable without dispute if FAT acceptance is delayed >10 calendar days.
2. FAT Protocol – Validate Speed, Seams, and Shelf-Life Under One Roof
Stage the FAT at the OEM’s plant but on your water, your syrup, your CO₂; variability in product rheology accounts for 38 % of downstream warranty claims. Run a 72-hour continuous test at 110 % name-plate speed while inserting 5 % intentionally defective containers to verify ejection accuracy; log MTBF in real time—target ≥200 minutes with 95 % confidence. Insist on full-format matrix (200 ml slim to 710 ml sleek) change-over in <25 minutes with no tools; each extra minute adds $1.2 k annual labor at typical utilization. Record seam integrity via real-time x-ray on 100 % of cans; reject threshold is <0.15 mm body-hook overlap variance. Only release the 15 % performance bond when Cpk ≥1.67 is demonstrated on critical dimensions across two consecutive 8-hour shifts.
3. Incoterms Selection – FOB Tianjin vs. DDP Kentucky
FOB saves 3–4 % of contract value but transfers risk while the asset is still in fabrication; DDP inflates cost $50 k–$80 k per line yet compresses total lead-time by 10–14 days and caps damage exposure. Use the table below to arbitrate; if your internal freight-forwarder achieves ≥98 % on-time and cargo-insurance premium is <$0.45 per $100 of CAPEX, FOB is margin-accretive. Otherwise, DDP secures EBITDA by avoiding $120 k–$180 k of lost-production days.
| Decision Driver | FOB Port of Export | DDP Site |
|---|---|---|
| Transit-risk cost | $18 k–$28 k | Supplier bears |
| Import-duty deferral | 0 days | 0 days (DDP cleared) |
| Freight inflation buffer | 100 % buyer exposure | 0 % |
| Site-ready buffer (days) | 12–18 | 3–5 |
| Total landed variance | ±6 % | ±2 % |
| Recommended if internal logistics score ≥98 % OTIF | Yes | No |
4. Contractual Risk Controls – From Commissioning to Clause 23
Insert a retention money tranche: 10 % payable 30 days after SAT only if line availability ≥90 % across 30 consecutive production days. Require suppliers to carry product-recall insurance with a $50 million limit and name your entity as additional insured; beverage recalls cost $10 M–$30 M on average. Cap consequential-damage liability at 100 % of contract value—OEMs typically push for 10 %, but 68 % of post-warranty failures originate in firmware obsolescence, not mechanical wear. Finally, negotiate source-code escrow for all PLC and HMI software; release triggers if supplier’s support entity undergoes >30 % ownership change or files for insolvency.
⚡ Rapid ROI Estimator
Estimate your payback period based on labor savings.
Estimated Payback: —