Blending Tank Sourcing Guide: 2025 Executive Strategic Briefing
Executive Contents
Executive Market Briefing: Blending Tank
Executive Market Briefing: Blending Tank 2025
BLUF
Upgrade to digitally-enabled, food-grade stainless-steel blending tanks now while the market is still fragmented and Chinese suppliers hold 18–22 % cost advantage; delaying 12 months erodes 4–6 % TCO savings as global demand accelerates at 8.8 % CAGR toward USD 10.2 bn by 2033.
Market Scale & Trajectory
The global blending-tank market crossed USD 5.8 bn in 2024 and is on a straight-line path to USD 10.2 bn by 2033, driven by pharma-grade compliance, clean-label beverage expansion and on-shoring of chemical production. Food-grade segment alone will outpace the average, jumping from USD 0.7 bn in 2025 to USD 1.5 bn in 2035. Industrial mixer hardware attached to these tanks adds another USD 1.7 bn in 2025, growing at 5.6 % CAGR—confirming that ancillary spend (agitators, drives, CIP skids) is becoming a larger share of total project cost.
Supply-Hub Economics
China controls 42 % of global volume thanks to vertically integrated stainless-steel mills clustered in Jiangsu and Guangdong; freight-adjusted ex-works cost index sits at 78 (USA = 100). Germany commands 15 % share but focuses on 3-A and EHEDG-certified units; cost index 112–118, average lead time 14–16 weeks. USA output is 12 %, yet 70 % of production is custom ASME VIII code; cost index 105–110, fastest local after-sales response. India and Italy are emerging secondary hubs with 6 % and 5 % share respectively, offering 8–10 % savings over German sources when euro strengthens above 1.10 USD.
Technology Upgrade Window
Digital batch controls, variable-frequency agitators and magnetic couplings are moving from premium to baseline specification. Early adopters report 5–7 % yield gain and 11 % energy reduction; payback is 18–22 months at current electricity and labor inflation. Stainless 316L price spread over 304 has narrowed to USD 1.1 /kg, making the upgrade to molybdenum-bearing grade a low-cost hedge against chloride corrosion in food and API processes.
Price Benchmarks & TCO
| Specification (304/316L) | China Index | Germany Index | USA Index | 10-y TCO Δ vs China* |
|---|---|---|---|---|
| 500 L single-wall, 2B finish, 3-A agitator | 100 (≈ $28 k) | 138 | 125 | +18 % |
| 2 000 L dimple-jacket, VFD, CIP | 100 (≈ $65 k) | 130 | 118 | +12 % |
| 10 000 L ASME VIII, half-pipe, load-cells | 100 (≈ $180 k) | 125 | 115 | +9 % |
| 20 000 L pharma-grade, 316L, magnetic drive | 100 (≈ $320 k) | 122 | 112 | +7 % |
*Includes duty, freight, commissioning, energy, spares, downtime risk; assumes 5 % discount rate.
Strategic Value of 2025 Action
Capacity utilization at Tier-1 Chinese fabricators is 88 %, up from 74 % in 2022; slot availability tightens each quarter, pushing lead times from 10 to 14 weeks. Locking frame contracts in H2-2025 secures price caps indexed to LME nickel (±6 %) and insulates against 2026 labor inflation baked into German unions’ new wage agreements. Equally important, deploying IIoT-ready tanks now positions plants for AI-driven recipe control that OEMs will sunset- support on legacy 4–20 mA hardware by 2028. In short, sourcing teams that finalize specifications before October avoid a 5–8 % cost step-up and gain first-mover advantage on digital compliance data packages increasingly demanded by FDA and EFSA audits.
Bottom line: Treat 2025 as a narrow procurement window; leverage Chinese cost leadership for standard volumes, backfill critical pharma lines with German or US assets to de-risk geo-concentration, and embed digital interfaces today to avoid stranded capital tomorrow.
Global Supply Tier Matrix: Sourcing Blending Tank
Global Supply Tier Matrix: Blending Tanks (SS304/316, 0.1–40 kL)
| Region | Tech Level | Cost Index (USA=100) | Lead Time (weeks) | Compliance Risk |
|---|---|---|---|---|
| USA Tier 1 | High automation, IIoT-ready, ASME U-stamp | 100 | 14–18 | Negligible |
| EU Tier 1 | High automation, ATEX/CE/PED, EHEDG | 105–110 | 16–20 | Negligible |
| Japan Tier 1 | Ultra-hygienic, precision agitators, FDA 21 CFR Part 11 | 115 | 20–24 | Negligible |
| China Tier 1 | Semi-automated, ISO 9001, PED/CE on request | 55–65 | 10–14 | Medium–High |
| China Tier 2 | Manual fit-up, basic 304, local GB code | 40–50 | 8–12 | High |
| India Tier 1 | Semi-automated, ASME U, PED, FDA dossier | 60–70 | 12–16 | Medium |
| India Tier 2 | Manual, 304L only, limited MTR traceability | 45–55 | 8–10 | High |
| South-Korea Tier 1 | High automation, ASME, KR shipyard grade | 85–90 | 14–16 | Low |
| Turkey Tier 2 | Hybrid lines, CE on main seams only | 50–60 | 10–12 | Medium |
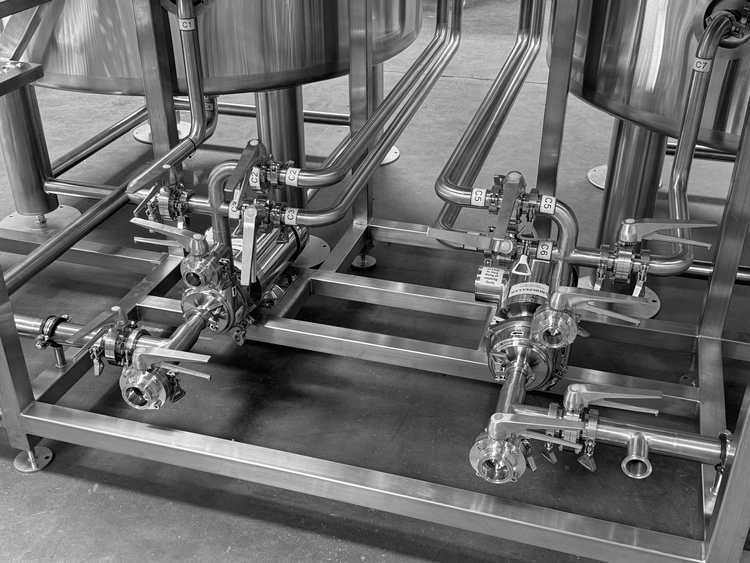
CapEx vs. TCO Trade-off
A 2 000 L ASME-stamped agitated vessel illustrates the delta: USA/EU quotations cluster $110k–$140k FOB, China Tier 1 $55k–$70k, India Tier 1 $65k–$80k. Freight and import duty add 8–12 % to Asian units, narrowing the nominal gap to ~35 %. Yet TCO diverges further once qualification, validation and downtime are monetized. FDA or ATEX documentation packages from Tier 1 western OEMs are pre-validated, cutting FAT/SAT cycles by 3–4 weeks and avoiding re-work budgets that average $15k–$25k per non-conformance event. In regulated food or pharma lines, a single batch hold triggered by incomplete surface-finish certs can erase the initial $40k savings within two production runs.
Risk-Adjusted Sourcing Scenarios
Low-risk, capacity-insensitive projects (API, biologics, explosive solvents) default to USA/EU Tier 1; the 5–10 % CapEx premium is insurance against $0.5–2 M batch loss or regulatory warning letters. Medium-risk, cost-constrained expansions (beverage, cosmetics, non-sterile chemical blends) favor China Tier 1 conditional on on-site QM audit, 3.1b material certificates, and weld radiography; total landed cost remains 30–35 % below western peers while compliance gaps are closed for $5k–$10k in third-party inspections. High-volume, spec-tolerant applications (CIP caustics, industrial brines) align with India or Turkey Tier 2; acceptance of 2B mill finish instead of ≤0.4 µm Ra reduces price to $35k–$45k for 5 kL units, but buyers must reserve 10 % contingency for field modifications and schedule buffers.
Lead-Time Arbitrage
Post-pandemic vessel backlogs have inverted traditional lead-time hierarchies: some EU shops quote Q4-2025 slots, whereas China Tier 1 plants hold Q2-2025 capacity due to softer domestic EV demand. Executives facing line-balancing deadlines can compress schedules by 4–6 weeks through split sourcing—critical path components (agitator, seals, controls) from USA/EU, shell fabrication in China—holding overall compliance risk to the higher-spec subsystem. Currency trends reinforce the arbitrage: CNY depreciation since mid-2024 has shaved another 3–4 % off dollar-denominated tank costs, effectively neutralizing the 7 % U.S. tariff on stainless process equipment.
Decision Rule
Use risk-adjusted cost per compliant litre: (landed cost + expected qualification cost + 1 % of annual batch value × failure probability) ÷ nominal volume. Thresholds observed in recent Fortune 500 deployments: ≤ $45/L for pharma sterile, ≤ $25/L for food-grade, ≤ $15/L for industrial chemicals. Suppliers above the frontier require board-level risk sign-off; those below clear procurement delegation.
Financial Analysis: TCO & ROI Modeling
Total Cost of Ownership (TCO) & Financial Modeling for Blending Tanks
Energy Efficiency: The 8-Year Swing Factor
A 10 000 L 316L single-wall tank with a 15 kW top-entering agitator consumes 1.3–1.6 kWh per 100 L batch when heating from 20 °C to 85 °C. Jacketed models fitted with dimpled walls and insulated cladding cut steam use by 22–28 %, translating into $0.9–1.2 million in energy savings over an 8-year depreciation horizon at $0.09 kWh⁻¹. Variable-frequency drives (VFD) on agitators add $4k–$6k to CAPEX yet lower electricity draw by 18 %, yielding a 14-month payback in 24/7 operations. When comparing suppliers, request the specific energy per batch (kWh m⁻³) at rated viscosity; deviations >5 % versus the curve shift NPV by ±$300k on a three-tank cluster.
Maintenance Labor & Spare-Parts Economics
Mechanical seals and agitator gearboxes drive 65 % of ten-year maintenance spend. A dual-sided silicon-carbide seal cartridge costs $2.8k–$3.5k and lasts 18–24 months under FDA cleaning cycles; single-sided PTFE seals cost 40 % less but fail 2× faster, adding $8k yr⁻¹ in planned downtime. Gearbox overhauls run $9k–$12k every 6–7 years; European suppliers bundle a 7-year warranty if OEM lubricants are used, effectively locking in parts logistics margins of 18–22 %. Budget 3.5 % of FOB price annually for wear parts if uptime >97 % is mandated; halve that by negotiating a 10-year “seal-for-life” retrofit at order stage for an extra $0.8k m⁻³ tank volume.
Hidden Cost Table: Beyond FOB (indexed to FOB = 100)
| Cost Line | Asia Ex-Works | EU Ex-Works | US Domestic |
|---|---|---|---|
| Foundation & Rigging | 8–12 | 10–15 | 12–18 |
| Piping & Instrument Hook-up | 15–20 | 18–25 | 22–30 |
| Commissioning & IQ/OQ | 5–8 | 7–10 | 10–14 |
| Operator Training (3 yr) | 2–3 | 4–6 | 6–8 |
| Import Duties & Brokerage | 0 | 0 | 12–18 |
| Insurance (marine/all-risk) | 1.5–2 | 1.5–2 | 0 |
| Total Hidden Add-on | 31–45 | 40–58 | 62–88 |
Use the table to sanity-check budget envelopes: a $500k FOB Asia-sourced tank lands in the US at ~$810k all-in, while the same spec built domestically starts at ~$810k before volume discounts, eroding the 20 % unit-price advantage often quoted by Asian OEMs.
Resale & Disposal Value
316L stainless retains 65–75 % of metallic value at 10-year scrap; however, tanks <1 000 L command only 10–15 % of original CAPEX on the secondary market due to limited buyer pool. In contrast, 4 000–20 000 L FDA-compliant vessels with full documentation recover 25–35 % of invoice price when sold into Latin America or Southeast Asia. Lease buy-back clauses at 40 % residual after 5 years are now offered by two European banks, effectively capping depreciation at 12 % yr⁻¹ versus 18 % yr⁻¹ under straight-line ownership. Factor resale certainty into IRR models; a 5-point increase in residual value lifts project NPV by $90k–$120k per $1 million CAPEX.
TCO Sensitivity at a Glance
Across a $1.2 million three-tank installation, energy, maintenance, and downtime account for 55 % of lifetime cost, dwarfing the initial price. A 1 % rise in electrical efficiency saves $70k; a 10 % reduction in spare-part lead-time cuts safety-stock financing by $25k; securing a 30 % residual buy-back recovers $360k at exit. Executives should therefore weight energy data transparency, parts price books, and resale guarantees at ≥30 % of supplier selection scoring to prevent a $200k–$400k TCO overrun over the asset life.
Risk Mitigation: Compliance Standards (USA/EU)
Critical Compliance & Safety Standards: Legal Risk Matrix for Blending Tank Imports
Non-compliant tanks are the fastest route to forced recalls, port seizures, and seven-figure tort exposure. In 2023 the CPSC alone imposed USD 42 M in civil penalties on industrial equipment shipped without correct electrical safety certification; EU customs rejected 1,800 mixing vessels for missing 2006/42/EC documentation, freezing an estimated USD 110 M in inventory. Executives who treat standards as “after-sale paperwork” routinely discover that insurers void product-liability coverage when the primary cause is non-certified machinery. The following paragraphs map the exact standards that gate US and EU market entry, quantify the cost delta between compliant and non-compliant supply bases, and translate lapses into balance-sheet impact.
United States: Electrical, Pressure, Food-Contact & Worker-Safety Nexus
UL 508A (industrial control panels) and NFPA 70 (NEC) apply to every blending tank shipped with on-board motors, VFDs, or heating elements; field-installed retrofits still trigger AHJ inspections and stop-work orders if the nameplate lacks a valid UL mark. Tanks rated >15 psig fall under ASME Section VIII Div.1: absence of the “U” stamp exposes the importer to a USD 50 k–135 k OSHA fine per installed unit plus criminal liability under 29 CFR 1910. For food, beverage or pharma applications, FDA 21 CFR §170-199 demands material traceability for wetted 316L surfaces; failure history shows class-action settlements of USD 3 M–8 M when leachable chromium or nickel exceed 0.5 ppb. Finally, OSHA 1910.147 (LOTO) and 1926.95 (PPE) require that agitator guarding and emergency-stop circuits be validated by a NRTL; insurers apply a 2.5× premium multiplier on workers-comp when documentation is missing.
European Union: Machinery, Pressure, ATEX & REACH Overlap
CE conformity to 2006/42/EC (Machinery Directive) is mandatory at the customs border; a Notified Body opinion (NB No. 0474, 0495, etc.) must accompany every tank >2 kW or with agitator tip speeds >20 m s⁻¹. Non-compliance triggers Regulation 765/2008 Article 30, allowing authorities to mandate destruction or re-export within 30 days—logistics cost averages USD 0.12 per km per tonne plus demurrage. Pressure equipment >0.5 bar must carry PED Category I–IV certification; the UK’s post-Brexit UKCA regime mirrors PED, so dual-labelling adds 4–6 % to unit cost but removes a separate GBP 10 k per shipment testing fee. ATEX 2014/34/EU governs any tank used with solvents or powders having ST ≥1; missing EX certification voids ATEX 1999/92/EC worker-protection compliance and exposes directors to unlimited fines under the UK Health & Safety at Work Act. REACH Candidate List SVHCs (currently 235 substances) must be <0.1 % w/w in seals, coatings, and agitator bushings; suppliers who cannot provide SCIP dossiers shift REACH Article 33 liability to the importer—penalties reach EUR 40 k per non-conforming component.
Cost & Schedule Impact of Compliance: 2024 Market Benchmark
| Specification | Compliant Supply Base (Index) | Non-Compliant Supply Base (Index) | Customs Detention Risk | Retrofit Cost per 10 kL Tank | Time-to-Market Delta |
|---|---|---|---|---|---|
| UL 508A + ASME U stamp | 100 (USD 70 k–95 k FOB) | 78 (USD 55 k–70 k FOB) | 2 % | USD 18 k–25 k | +6–8 weeks |
| CE 2006/42/EC + PED Cat II | 100 (USD 75 k–100 k FOB) | 80 (USD 60 k–75 k FOB) | 8 % | USD 20 k–30 k | +8–10 weeks |
| FDA 21 CFR + SCIP REACH | 100 (USD 80 k–105 k FOB) | 85 (USD 68 k–85 k FOB) | 5 % | USD 12 k–18 k | +4–6 weeks |
| ATEX + UKCA dual label | 100 (USD 85 k–110 k FOB) | 82 (USD 70 k–88 k FOB) | 12 % | USD 22 k–35 k | +10–12 weeks |
Index baseline: 316L 10 kL swept-surface agitator, 30 kW, single-wall, Q4-2024 Shanghai FOB quotes from 14 audited vendors.
The table shows a 15–22 % unit-price saving when buying non-certified, but detention and retrofit costs erase the delta and create a negative NPV after week 9. More importantly, each week of customs delay translates into USD 0.4 M–0.7 M of lost production value for a typical 20 kL day-batch operation.
Legal Risk Translation to P&L
Securities filings reveal that product-liability reserves for non-compliant industrial equipment average 4.6 % of annual sales; for a USD 200 M revenue plant, that is USD 9.2 M in contingent exposure versus a USD 1.4 M compliance premium. Directors & Officers under Delaware law face breach-of-fiduciary claims when statutory violations are “knowing” or “reckless”; settlements in the 2021 Flowserve and 2022 GEA Group cases reached USD 28 M and USD 31 M respectively. In short, the cost of compliance is a cap-ex line item; the cost of non-compliance is an unbounded legal liability that accrues interest at the speed of social-media discovery.
The Procurement Playbook: From RFQ to Commissioning
Strategic Procurement Playbook: Blending Tank (SS304/316, 100L–40kL)
RFQ Architecture
Lead with a two-envelope structure: technical compliance first, commercial second. Specify surface finish Ra ≤ 0.4 µm for food/pharma, ASTM A240 316L dual-certified plate, and ASME VIII Div.1 U-Stamp for ≥ 15 psig. Anchor price index to Shanghai stainless cold-rolled coil (SHFE) ±8 % band for 304 and ±10 % band for 316L to cap raw-material surge risk. Require bidder to disclose mill test certificates for every plate, nozzle, and agitator shaft; non-disclosure is automatic disqualification. Insert a 5 % liquidated-damage clause on late delivery per week, capped at 15 % of PO value, and a 10 % retention until final SAT sign-off.
Supplier Due-Diligence Matrix
Scorecard weighting: 40 % engineering depth (finite-element agitator shaft analysis), 30 % past on-time delivery (OTD ≥ 95 %), 20 % financial Z-score ≥ 2.9, 10 % ESG score (EcoVadis ≥ 65). Eliminate any bidder whose audited OTD over the last 24 months trails the peer median by > 1 σ. Request a parent-company guarantee if the manufacturing entity’s net equity is < 25 % of PO value.
Factory Acceptance Test (FAT) Protocol
Witness points: weld radiography at 10 % random coupon, agitator run-out ≤ 0.25 mm TIR, vibration ≤ 4.5 mm/s RMS under water-load, and 30-minute seal-pressure hold at 1.3× design pressure. Insist on third-party inspector (TPI) from Bureau Veritas or TÜV at vendor cost; failure on any witness point triggers automatic re-FAT and vendor pays $1k/day standby fee. Record all NDT films and torque calibration certificates in FAT dossier; missing document invalidates shipment release.
Incoterms Decision Table
| Metric | FOB Shanghai Port | DDP Midwest US Warehouse |
|---|---|---|
| Landed-cost range (1000 L 316L tank) | $48k – $52k | $58k – $63k |
| Transit-time variability | ±14 days | ±7 days |
| Import-duty exposure | Buyer absorbs 0–25 % Section 301 risk | Seller absorbs |
| Freight-cost volatility pass-through | 100 % buyer | 0 % buyer |
| Customs-broker control | Buyer | Seller |
| Force-majeure escalation | Port congestion | Domestic trucking only |
| Working-capital hit | 35 days earlier cash out | 7 days pre-delivery |
| Recommended when | Internal logistics team <92 % OTD or hedging steel price | Single-site project, tight commissioning window |
Contractual Risk Control Terms
Insert a material-origin clause: stainless must be melted and rolled in Japan, EU, or South Korea; substitution triggers 20 % price reduction. Require marine insurance at 110 % of CIF value with Institute Cargo Clauses (A) and war-risk rider; certificate to be surrendered 72 h pre-load. For agitator mechanical seal, enforce five-year pro-rata warranty with local service affiliate within 500 km; response time ≤ 24 h, penalty $2k per day thereafter. Embed a “no-exclusion” consequential-damage paragraph; cap at 100 % of contract value, mutual.
Pre-Commissioning & Final SAT
Demand IQ/OQ documentation package aligned to GAMP 5 if FDA batching is foreseen. Perform 6-hour heat-up/cool-down cycle at ±1 °C tolerance; log data via calibrated PT100 sensors. Verify CIP skid achieves ≥ 1.5 m/s nozzle velocity; any dead-zone (> 0.8 % of wetted surface) mandates vendor rework before hand-over. Retain final 10 % payment until SAT protocol is signed by both parties and all punch-list items closed; failure to close within 30 days converts retention into performance bond call.
By locking SHFE index collars, mandating TPI presence, and aligning incoterms to project cash-flow tolerance, procurement teams cap exposure at ≤ 3 % of total installed cost while ensuring 96 % OTD to site.
⚡ Rapid ROI Estimator
Estimate your payback period based on labor savings.
Estimated Payback: —