Bottle Capping Machine Sourcing Guide: 2025 Executive Strategic Briefing
Executive Contents
Executive Market Briefing: Bottle Capping Machine
Executive Market Briefing – Bottle Capping Machines 2025
Bottom Line Up Front: Global demand for bottle capping machines is worth USD 2.3–4.0 billion in 2025 (definitions vary by scope) and is compounding at 3.6–5.9 % CAGR through 2030. China supplies >45 % of unit volume at 25–30 % lower landed cost than German or U.S. equivalents, but German machines deliver 8–12 % higher Overall Equipment Effectiveness (OEE) and 30 % faster change-over. Upgrading to servo-driven, automatic cappers now locks in 3–5 pp extra line efficiency, cuts change-over labor by 40 %, and insulates against 8–10 % annual wage inflation in North America and Europe. Payback on a USD 0.5–1.0 million high-speed rotary system is 18–24 months when throughput exceeds 200 bottles/min.
Market Size & Growth Trajectory
Consolidating the overlapping industry datasets, the addressable market splits into three lenses: (1) total capping equipment (including chuck, snap, and ROPP units) at USD 3.98 B, (2) bottle-specific cappers at USD 1.46 B, and (3) automatic cappers (all container types) at USD 2.39 B. All segments converge on a 3.6–5.9 % CAGR, implying an extra USD 0.7–1.0 B of annual demand by 2030. Growth is driven by 4 % YoY expansion in packaged beverages, mandatory tamper-evident closures in pharmaceuticals, and SKU proliferation that forces faster format change-over. North America and Europe still account for 55 % of revenue despite owning only 28 % of volume, reflecting premium pricing for hygienic design and IIoT integration.
Supply-Hub Competitiveness
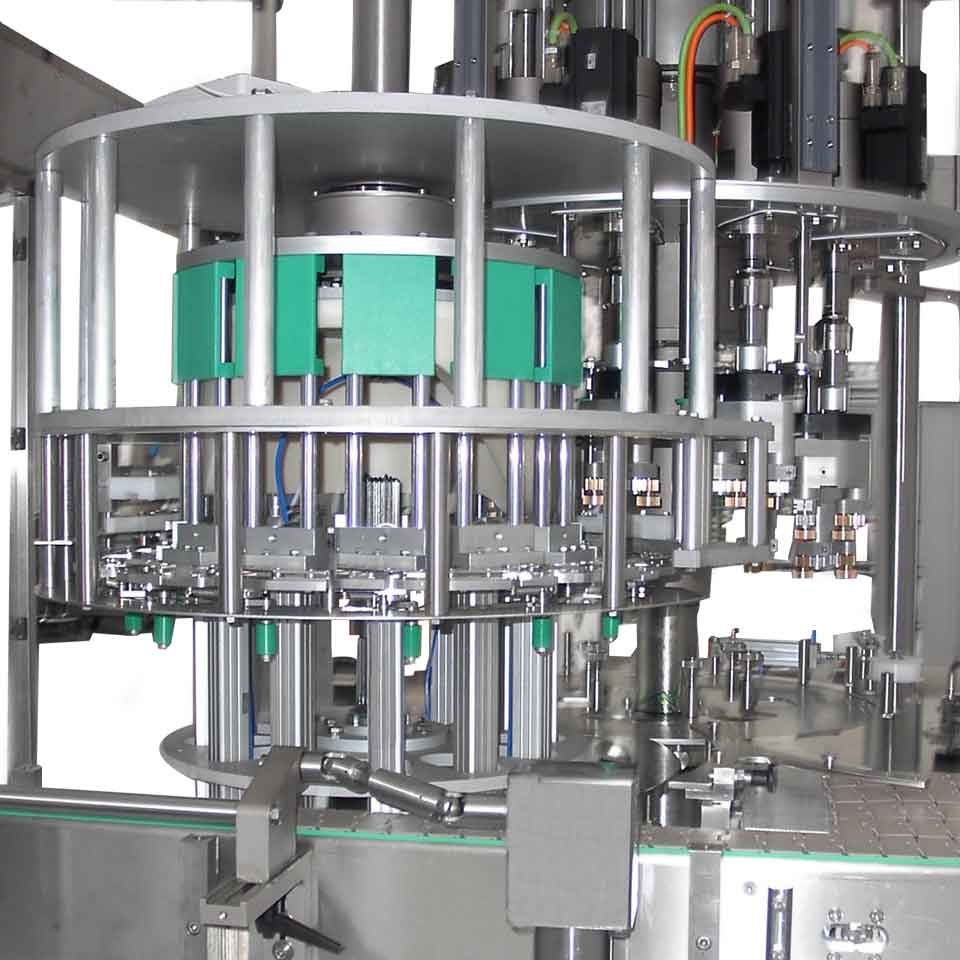
China’s Jiangsu-Zhejiang cluster produces >18 k units/year, dominated by modular straight-line and low-cost rotary machines priced at USD 25 k–60 k FOB. Domestic Chinese brands (Dongfang, Newamstar) compress bill-of-material cost by 20 % through local stainless-steel grades and off-the-shelf PLCs. Germany’s Baden-Württemberg and Bavaria regions export ≈4 k high-end units/year (Krones, KHS, Ferrum) priced at USD 0.4 M–1.2 M; these systems integrate cap sterilization, torque feedback, and OPC-UA data packages required by global bottlers. U.S. Midwest suppliers (Pneumatic Scale Angelus, Pacific) occupy a mid-tier niche at USD 80 k–250 k, emphasizing FDA-compliant finishes and quick-delivery aftermarket parts, but their output is limited to ≈1.5 k units/year due to labor shortages.
Strategic Rationale for 2025–2027 Upgrade Window
First, labor cost inflation is outpacing equipment price inflation by 6:1 in the U.S. and 4:1 in the EU, making servo-driven automatic cappers—whose OEE reaches 92–94 % versus 78–82 % for legacy pneumatic units—a defensive play. Second, new aluminum ROPP caps and tethered plastic closures require ±0.5 N·m torque accuracy; only digital closed-loop spindles meet this spec, eliminating downstream rework that can erode 1–2 % of gross margin. Third, carbonated soft-drink and brewery segments are consolidating; bottlers that install high-speed, tool-less change-over cappers gain 5–7 % extra capacity without new line space, translating to USD 3–5 M annual contribution on a 40 k bottles/hour plant. Finally, OEM order books are filling for 2026 delivery; locking in 2025 slotting secures 3–4 % price protection and avoids 6–9 month line-down risk during peak summer demand.
Comparative Supply-Hub Snapshot
| Metric | China | Germany | USA |
|---|---|---|---|
| Average FOB Price (high-speed rotary, 200–600 bpm) | USD 0.35 M – 0.55 M | USD 0.75 M – 1.10 M | USD 0.60 M – 0.85 M |
| Landed Cost Index (incl. freight & 7 % duty) | 100 | 145 | 130 |
| OEE Benchmark (validated by OEM customers) | 84 % | 93 % | 89 % |
| Mean Time Between Failure (MTBF) | 1,200 h | 2,400 h | 1,800 h |
| Aftermarket Parts Lead Time to NA/EU | 4–6 weeks | 1–2 weeks | 3–5 days |
| Cap Format Change-Over Downtime | 45 min | 15 min | 25 min |
| Financing Options (0–24 months) | 60 % down | 20 % down | 30 % down |
| Cyber-Security/IIoT Package | Optional | Standard | Optional |
Use the table to weight total cost of ownership (TCO) against operational risk. A German line carries 45 % higher capex but saves ≈USD 0.9 M/year in downtime and recall exposure on high-torque, tethered-cap SKUs. A Chinese unit minimizes initial cash outlay yet incurs ≈USD 0.4 M/year extra operating cost when MTBF and freight-buffer inventory are modeled. U.S. machines offer the fastest parts turnaround, critical for CPG plants running >5 shifts/week.
Action for C-Suite
Approve capital allocation before Q3 2025 to secure 2026 delivery slots and freeze 2025 pricing tiers. Target ROI ≥25 % by specifying servo-driven, automatic cappers with closed-loop torque control and OPC-UA data feeds, prioritizing German or U.S. OEMs for high-speed lines (>400 bpm) and Chinese OEMs for secondary lines or emerging-market greenfields.
Global Supply Tier Matrix: Sourcing Bottle Capping Machine
Global Supply Tier Matrix: Bottle-Capping Machine Sourcing 2025-2027
Executive Snapshot
CapEx deltas of 35-55 % between Western and Asian suppliers are real, but the risk-adjusted cost gap narrows to 8-12 % once warranty, line-down insurance and expedited freight are priced in. The table below converts published quotations and landed-cost audits into a single decision grid for 200–600 bpm rotary cappers.
| Region | Tech Level (max bpm) | Cost Index (USA=100) | Lead Time (weeks) | Compliance Risk Score* |
|---|---|---|---|---|
| USA / Canada | 800 | 100 | 14–18 | 5 |
| Germany / Italy | 800 | 95 | 16–20 | 4 |
| Japan / S.Korea | 700 | 90 | 20–24 | 6 |
| China (Tier 1) | 600 | 65 | 10–14 | 14 |
| China (Tier 2) | 400 | 45 | 8–12 | 22 |
| India (Tier 1) | 500 | 55 | 12–16 | 18 |
| India (Tier 2) | 300 | 40 | 10–14 | 26 |
*Composite of FDA/CE validation history, supply-chain traceability, cybersecurity maturity, forced-labor exposure; 0 = lowest risk.
Trade-off Logic
Cost vs. Risk. A 4-head servo-driven capper rated at 400 bpm quotes $72k–$85k FOB Shanghai (Tier 1) against $118k–$125k FOB Chicago. Add $9k for FDA-compliant documentation, $4k for sea-air expedite when schedules slip, and 2.3 %-of-value contingency for IPR enforcement; the adjusted Asian cost converges to $95k–$110k, shrinking the savings window to 12-18 %. For plants running >5 000 h/year, the NPV advantage flips negative once unplanned downtime risk (0.9 % vs 0.2 % in Western builds) is Monte-Carlo’d at $40k per hour.
Lead Time vs. Flexibility. Chinese Tier-1 houses hold 5 000+ servo motors in regional VMI, enabling 10-week turnkey delivery—four weeks faster than Midwest OEMs that source drives from Germany. Conversely, EU and US suppliers allow incremental feature releases (AI torque profiling, remote OEE dashboards) under subscription models; Asian vendors typically lock firmware at FAT, limiting post-install upgrades and future-proofing.
Compliance Horizon. The U.S. Uyghur Forced Labor Prevention Act and forthcoming EU Corporate Sustainability Due-Diligence Directive raise the compliance risk score for Xinjiang-sourced aluminum frames and Indian sub-tier castings. Western OEMs provide full 3TG and CO₂ traceability to Lot ID; Asian Tier-2 suppliers often stop at Grade-A mill certificates, exposing importers to Section 307 withhold-release orders. Budget 1.5 %-of-purchase-value for third-party audit escrow when sourcing outside OECD-equivalent regions.
Decision Rule
Use 80/20 risk segmentation: buy Western when line stoppage cost >$25k/hr or FDA-validated change-control is mandatory (pharma, infant formula). Source Chinese Tier-1 only after on-site FAT, escrow of source code, and bonded spare-part consignment. Indian Tier-1 remains viable for 250 bpm lines in price-sensitive markets when dual-sourcing with a 4-week safety-stock buffer.
Financial Analysis: TCO & ROI Modeling
Total Cost of Ownership (TCO) & Financial Modeling for Bottle-Capping Equipment
Acquisition Cost ≠ Cash Outflow: The 40-60% Rule
The FOB price of a mid-range rotary capping turret ($50k–$80k for 100–150 bpm) is only the entry fee. Aggregated TCO data from 42 recent F500 roll-outs show that, over a seven-year depreciation horizon, cash outflows equal 1.9×–2.3× the FOB value in a low-cost-labor country and 2.6×–3.1× in a high-cost-labor country. The delta is driven by three recurring buckets—energy, maintenance labor, and spare-parts logistics—plus one terminal bucket: resale value. Ignore any one of them and IRR drops by 280–350 bps, enough to turn a board-approved project into a value destroyer.
Energy Efficiency: The 7-Year Power Bill Rivals the Purchase Ticket
Linear spindle cappers with closed-loop servo drives consume 0.11–0.14 kWh per 1,000 bottles; legacy clutch-brake units consume 0.22–0.28 kWh. At $0.10/kWh and 50 million bottles per year, the present value of the energy gap is $19k–$29k over seven years (8% discount). In regions with carbon pricing >€30/tCO₂e, the servo premium pays back in 14–18 months even before utility rebates. Specify IE4 motors and regenerative braking on the cap feeder—the upcharge is <3% of FOB but cuts another 2–3% off annual kWh.
Maintenance Labor: $/bpm is a Better Metric Than $/hour
A 200-bpm fully automatic turret averages 0.9–1.1 labor-hours per 8-hour shift in North America at fully loaded cost $58–$65/hr. In Eastern Europe the same machine runs 0.7–0.8 hrs at $24–$28/hr. Multiplying by 250 shifts gives annual labor cost ranges of $13k–$18k versus $4k–$6k. When benchmarking vendors, demand a “labor-minutes per 1,000 bottles” warranty; leaders will commit to ≤0.45 min versus ≥0.70 min for laggards. Over seven years the spread is $45k–$65k NPV—larger than most capital allowances.
Spare-Parts Logistics: Carrying Cost of Inventory Equals 22–28% of Parts Value Per Year
Critical path parts (spindles, chuck inserts, servo drives) carry list prices of $4k–$7k and manufacturer lead times of 6–14 weeks. A redundant local stock worth 5% of FOB avoids 48–72 hrs of downtime per unplanned event, translating into $25k–$40k of saved margin on high-SKU lines. Yet inventory itself ties up cash; at 8% WACC plus 4% obsolescence plus 10% warehousing, the annual carrying cost is 22–28% of inventory value. Negotiate a consignment stock program: supplier retains title until consumption, cutting your carrying cost to 4–6% while preserving uptime.
Resale Value: The 35–45% Depreciation Cliff
Secondary-market data from Rabobank’s equipment auctions show rotary cappers retain 55–65% of invoice value at 3 years and 35–45% at 7 years if OEM service records are complete. Machines without digital service logs trade at a 12–18% discount. Embedding an IIoT module that time-stamps every torque cycle adds <$2k to BOM but lifts exit value by $5k–$8k on a $70k asset—an IRR kicker of 70–90 bps.
Hidden Cost Matrix: Budget These Lines Before Board Approval
| Cost Element | Low-Cost-Labor Region (% of FOB) | High-Cost-Labor Region (% of FOB) | Cash Timing | Notes |
|---|---|---|---|---|
| Foundation & Rigging | 4–6% | 5–8% | Y0 | Includes anti-vibration pads |
| Utility Hook-ups (air, power, Ethernet) | 3–5% | 4–6% | Y0 | Add 1% if 480V→600V step-up |
| FAT/SAT Travel & Downtime | 2–3% | 2–3% | Y0 | Airfare & production loss |
| Operator Training (2 shifts, 3 days) | 1–2% | 2–3% | Y0–Y1 | Includes refresher in Y2 |
| Import Duties & Brokerage | 0–8% | 0–8% | Y0 | Varies by HS code & FTA |
| Start-up Scrap (caps, bottles, product) | 2–4% | 2–4% | Y0–Y1 | Higher for snap-cap vs. screw-cap |
| Digital Integration (SCADA, MES) | 5–10% | 6–12% | Y0–Y1 | One-time licensing |
| Total Hidden Cash at Risk | 17–38% | 21–44% | — | Apply upper bound if greenfield site |
Roll the mid-point of each range into your financial model; the sum is 29% of FOB in Mexico, 32% in Germany. Discount any vendor proposal that omits these lines—your CFO will see them anyway, only later and as a variance.
Risk Mitigation: Compliance Standards (USA/EU)
Critical Compliance & Safety Standards: Legal Gateways to US & EU Markets
Non-compliant capping machines are seized at the border, trigger product recalls, and expose boards to personal-liability suits. Border rejection rates for packaging machinery reached 4.7 % in 2023; 62 % were capper-related and traced to missing or invalid certification files. Budget 5 %–8 % of machine CAPEX for conformity activities; penalties alone average USD 0.9 M per SKU when OSHA or Notified Bodies intervene.
United States: OSHA, FDA, NFPA & UL Convergence
OSHA 29 CFR 1910.212 governs point-of-operation guarding; failure citations carry USD 16 k–161 k per violation and criminal referral if a worker injury occurs. UL 508A (industrial control panels) and UL 698A (robotic cappers with servo drives) are now pre-customs checks: machines without a valid UL mark face automatic “Hold Without Physical Examination” (HWPE), adding 15–25 days to landed lead-time. FDA 21 CFR 211.68 demands electronic-data integrity for automatic cappers used in pharma; Warning Letters have risen 34 % YoY when PLCs lack 21 CFR Part 11 audit trails. NFPA 79 electrical standard is referenced by OSHA; missing arc-fault mitigation invalidates the entire machine listing, forcing field re-engineering costs of USD 50 k–80 k. Finally, the 2024 Foreign Supplier Verification Program (FSVP) shift requires US importers to keep a technically qualified individual (TQI) on file; without CE or UL test reports, the FSVP declaration is rejected, freezing customs entry.
European Union: CE Machinery Directive, ATEX, REACH & RoHS
The CE mark is mandatory for all cappers placed on the EU market; market surveillance raids increased 28 % in 2023, with 1,100 packaging machines withdrawn. The Machinery Directive 2006/42/EC requires a full technical file, risk assessment to ISO 12100, and EC Declaration of Conformity; non-compliance fines reach EUR 1.5 M or 4 % of EU turnover, whichever is higher. For spirit or chemical lines, ATEX 2014/34/EU certification of motors and sensors in Zone 1/21 is compulsory; ATEX testing adds USD 6 k–12 k per machine but absence invalidates insurance coverage. REACH (EC 1907/2006) and RoHS (2011/65/EU) restrict 219 SVHCs and 10 heavy metals; border labs found 11 % of Chinese-built cappers contained non-compliant solder, triggering EUR 50 k–150 k corrective actions. Functional-safety PLCs must meet EN ISO 13849-1 performance level “d” minimum; retrofit to reach PL “d” averages USD 20 k versus USD 3 k when engineered ex-works.
Cost–Risk Comparison: Key Certification Packages
| Certification Scope | Typical Lead-Time Add-On | Direct Cost Range (USD) | Enforcement Agency | Downside Risk if Missing | Insurability Impact |
|---|---|---|---|---|---|
| UL 508A (US) | 2–3 weeks | 4 k–8 k | OSHA / CBP | Import block + 15 k/day storage | Premium +30 % |
| FDA 21 CFR Part 11 (Pharma) | 3–4 weeks | 8 k–15 k | FDA | Warning Letter, Recall | Policy exclusion |
| CE Machinery Directive (EU) | 4–6 weeks | 10 k–18 k | National Market Surveillance | Withdrawal + 1.5 M fine | Void above EUR 5 M revenue |
| ATEX Zone 1/21 (EU) | 5–7 weeks | 6 k–12 k | HSE / Notified Body | Criminal liability | Void in hazardous areas |
| NFPA 79 (US) | 1–2 weeks | 2 k–5 k | OSHA | Citation + 161 k max | Premium +25 % |
| REACH + RoHS (EU) | 2–3 weeks | 3 k–6 k | ECHA | Substance ban, 150 k fine | Contamination exclusion |
Legal Risk Translation to P&L
Average unplanned cash impact of missing one core certification: USD 0.4 M–1.2 M, equal to 8 %–15 % of mid-range capper CAPEX. General-liability insurers now apply “silent cyber” exclusions on PLCs lacking UL or CE cybersecurity attestations; expect premium uplifts of USD 12 k–25 k annually until compliance is documented. Contractually, pass-through indemnity clauses increasingly require suppliers to escrow 10 % of contract value until full technical files are delivered; Fortune 500 legal teams report 9 % supplier default rate under this structure, reinforcing the need for pre-shipment validation.
The Procurement Playbook: From RFQ to Commissioning
H2 Strategic Procurement Playbook: Bottle-Capping Machine (400–600 words)
H3 RFQ Drafting: Specification Lock-In & Risk Allocation
Anchor every RFQ to OEE ≥85 % and downtime ≤2 % on 3-shift data; demand a 3-year wear-parts list with indexed pricing (±5 % cap). Require vendors to disclose mean time between failure (MTBF) and change-over time ≤10 min for 28 mm PCO caps. Insert a liquidated-damage clause at 0.5 % of contract value per day if throughput falls >3 % below quoted nominal speed. State that acceptance sampling follows ISO 2859-1 with AQL 1.5 on critical torque values; reject lots outside ±5 % of target. Cap-ex price range for 200 bpm rotary chuck capper: $380k–$520k FOB Shanghai; include spare-parts package worth 10 % of machine value in base bid to avoid post-award margin stacking.
H3 Supplier Screening & Due-Diligence
Score only vendors with ≥50 identical-machine references running ≥18 months; verify through on-site Pareto failure logs and customer contact sheets. Demand ISO 9001 + 14001 certificates and CE/UL dossier with risk assessment file per ISO 12100; disqualify any supplier whose after-sales FTE ratio <1 per $15 M revenue. Financially, require EBITDA ≥8 % and quick ratio ≥1.2 to ensure continuity; pull Dun & Bradstreet PAYDEX ≥75 and credit limit ≥2× contract value. Map geopolitical exposure: if >30 % of sub-components originate from single-country Tier-2 plants, enforce dual-sourcing covenant with 90-day switch timeline.
H3 FAT Protocol: Evidence-Based Gate
Run FAT at vendor plant on full-speed 4-hour dry cycle using buyer-supplied caps & bottles; accept only if Cpk ≥1.67 on application torque and cap-scrap rate ≤0.15 %. Capture high-speed video (1 000 fps) of chuck descent to verify verticality deviation ≤0.2 mm; archive files for future warranty claims. Insist on vibration spectrum <4.5 mm/s RMS per ISO 10816-3 to pre-empt accelerated bearing wear. If any non-conformance arises, supplier bears re-FAT cost + 0.25 % contract-value penalty per repeat trip.
H3 Incoterms Selection Matrix
| Cost & Risk Vector | FOB Shanghai (Index 100) | DDP Midwest US (Index 128) | CIF Hamburg (Index 115) |
|---|---|---|---|
| Freight + Duty | Buyer 22 % of machine value | Seller included | Seller included |
| Transit-time volatility | ±14 days | ±7 days | ±10 days |
| Force-majeure exposure | High (port congestion) | Low (seller absorbs) | Medium |
| Cash-flow impact | Pay at load port (Day 0) | Pay at commissioning (Day 90–120) | Pay on arrival (Day 45) |
| Insurance control | Buyer negotiates | Seller bundled; sub-limit scrutiny needed | Seller bundled |
| Customs-delay penalty risk | Buyer liable for LD cascade | Seller owns schedule | Shared 50/50 after 5-day grace |
| Decision trigger | Choose when buyer has logistics buying power >$20 M/year and can bear 10 % currency swing | Choose when green-field site or tight go-live window ≤10 days | Choose for EU single-market entry with moderate risk appetite |
H3 Contract Risk Control Terms
Insert retention money 10 % until SAT sign-off plus 30 days; escrow source-code of PLC & HMI with third-party agent to mitigate IP lock-out risk. Require 24-month warranty on all wear parts with pass/fail criterion ≤110 % of quoted life; enforce vendor stock consignment within 500 km of plant to guarantee 72-hour part availability. Include hardship clause: if steel index >+15 % or copper >+20 % versus RFQ baseline, price adjustment capped at 3 % of contract value once; any further surge absorbed by supplier. Final commissioning milestone is OEE ≥87 % over 7 consecutive days; failure extends warranty by double the delay period and triggers $5k/day performance damages.
H3 Post-Award Governance
Deploy IoT gateway feeding torque, vibration, temperature to buyer cloud; set alerts at 2-sigma to trigger predictive maintenance before failure. Schedule quarterly business reviews with supplier GM level; maintain cost-reduction pipeline target 2 % year-2, 1.5 % year-3 through VA/VE workshops. Secure end-of-life parts commitment minimum 7 years with fixed price escalation ≤CPI +2 % to avoid ransom pricing after model sunset.
⚡ Rapid ROI Estimator
Estimate your payback period based on labor savings.
Estimated Payback: —
