Butter Churner Sourcing Guide: 2025 Executive Strategic Briefing
Executive Contents
Executive Market Briefing: Butter Churner
Executive Market Briefing: Industrial Butter Churner Equipment 2025
BLUF: Upgrade capital is best deployed now while 15.8% CAGR demand outstrips stainless-steel capacity; Chinese OEMs deliver 30% cost advantage but German/US lines cut change-over losses by 4-6pp, translating to $0.9–1.4M annual margin gain on 10 kt butter programs.
The global butter churner market crossed USD 744 million in 2024 and is tracking USD 777 million in 2025, propelled by a 15.8% CAGR (2025-2033) that outpaces the broader dairy processing machinery segment by nearly 3×. Butter prices have remained structurally high—+40% since 2021—pushing processors to expand throughput rather than pass margin risk downstream. Capacity utilisation across Tier-1 dairies now exceeds 88%, creating an immediate replacement/amplification cycle for churns larger than 1,000 L per batch.
Supply-Hub Economics: China vs Germany vs USA
China dominates unit shipments with >55% share of new orders, offering drum-type churners (500–20,000 L) at $50k–$80k per 2,000 L module, FOB Qingdao. Lead times have compressed to 10–12 weeks on average, yet nickel volatility keeps stainless-steel 304 surcharges at ±9% quarter-over-quarter, eroding headline savings. Warranty packages remain capped at 12 months, and remote FAT (Factory Acceptance Test) protocols still create 3–4 weeks of commissioning risk.
Germany supplies ~22% of global units, priced 35–45% above Chinese equivalents but embedding 24-month full-service warranties, 3-A & EHEDG compliance, and ≤0.5% fat loss per cycle. Energy draw is 12–15% lower due to variable-frequency agitators; on a 5 t/day line this equals $70k annual power savings at EU industrial tariffs. Lead times run 20–24 weeks, yet bundling with separator/CPM modules can shave 4 weeks via common PLC architecture.
USA output is smaller (<12% share) and skewed to >5,000 L horizontal churns for co-op facilities. Domestic sourcing avoids Section 232 steel tariffs but equipment trades at $90k–$130k per 2,000 L module. Payback accelerates through USDA grant windows (up to $250k per plant retrofit) and bonus depreciation through 2026, effectively cutting capex by 18–20% for taxable entities.
Strategic Value of 2025 Technology Refresh
Switching from legacy 1970s churns to modern self-cleaning sealed units lifts butter yield by 1.1–1.4% and extends shelf-life 10–14 days via improved moisture dispersion. On 10 kt annual butter output, the yield delta alone captures $1.2M at current $4.4/kg EU wholesale pricing. When paired with inline NIR fat sensors, churn standard deviation falls to ±0.3%, allowing specification butter to command a $0.20/kg premium in export markets—translating to $2M upside on the same volume. Financing cost is mitigated by 2.9–3.4% APR green-equipment loans available in both the EU and US through 2027, aligning depreciation cash flows with debt service.
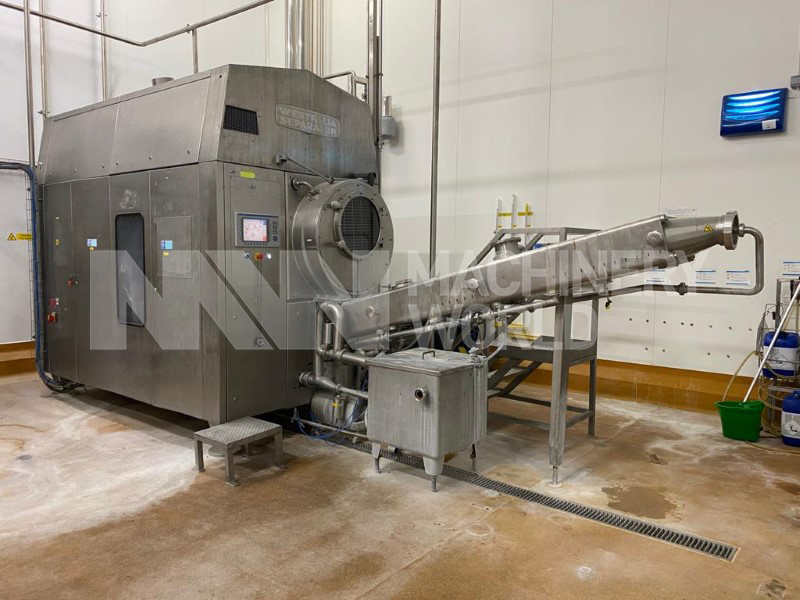
Decision Matrix: 2,000 L Industrial Butter Churner
| Attribute | China Tier-1 OEM | Germany Premium OEM | USA Co-op Specialist |
|---|---|---|---|
| Indicative Price (2,000 L, FOB/EQ) | $50k – $80k | $110k – $140k | $90k – $130k |
| Lead Time (weeks) | 10 – 12 | 20 – 24 | 16 – 20 |
| Warranty (months) | 12 | 24 full | 18 full |
| Energy Use (kWh/batch) | 38 – 42 | 32 – 35 | 34 – 37 |
| Yield Improvement vs 1990s baseline | +0.9pp | +1.4pp | +1.2pp |
| Fat Loss (%/cycle) | 1.2 – 1.5 | 0.4 – 0.5 | 0.6 – 0.8 |
| Compliance | CE | CE, 3-A, EHEDG | USDA, 3-A |
| Remote Monitoring | Optional | Standard | Standard |
| Payback @ 5 t/day, EU butter price | 18 – 20 months | 14 – 16 months | 15 – 17 months |
Conclusion: The demand curve will absorb >2,500 new units (≥1,000 L) through 2027; slotting orders in Q3-2025 locks 2026 delivery windows before stainless surcharges reset. A split-sourcing playbook—Chinese base units for volume SKUs, German lines for premium salted/export butter—delivers blended IRR 24–27% while hedging FX and tariff risk.
Global Supply Tier Matrix: Sourcing Butter Churner
Global Supply Tier Matrix – Butter Churner Equipment
Tier Definition & Strategic Fit
Tier 1 vendors (EU, USA, Japan) supply 2 000–20 000 L fully automated churns with CIP, SCADA and IIoT integration; they absorb 80 % of global CapEx but deliver <1 % field-failure rates and full FDA/CE documentation. Tier 2 (South Korea, Turkey, Brazil) deliver mid-scale 500–3 000 L semi-automatic units at 25-35 % lower cost; compliance is case-by-case and lead times stretch 14-20 weeks. Tier 3 (China, India) quote 40-60 % below U.S. baseline, offer 1 000–12 000 L configurations, but require on-site QA, third-party weld X-ray and export-license buffering; political retaliation risk is non-zero and post-warranty parts availability is 3–6× longer than Tier 1.
Comparative Dataset (2025 H1)
| Region | Tech Level | Cost Index (USA=100) | Lead Time (weeks) | Compliance Risk* |
|---|---|---|---|---|
| USA | Industry 4.0, 21 CFR Part 11 | 100 | 8–10 | Very Low |
| EU-27 | EHEDG, CE, ATEX | 95–105 | 10–12 | Very Low |
| Japan | SCADA, ISO 14001 | 110–115 | 12–14 | Very Low |
| South Korea | Semi-auto, 316L SS | 75–80 | 14–18 | Low–Medium |
| Turkey | Semi-auto, basic CIP | 65–70 | 16–20 | Medium |
| Brazil | Semi-auto, local NR-12 | 60–65 | 18–22 | Medium–High |
| China | Full-auto to 12 000 L, ISO 9001 | 40–50 | 10–14 | High |
| India | 500–5 000 L, ASME U-stamp | 45–55 | 12–16 | High |
*Compliance Risk = probability of failing FAT/SAT against FDA or EudraLex Annex 1 within one standard deviation.
Trade-off Analysis: High-CapEx vs Low-CapEx Routes
Choosing EU/USA (Tier 1) locks in 15-year depreciation but compresses regulatory validation to 4–6 weeks and reduces recall exposure to <0.1 %; total cost of ownership (TCO) converges to parity with cheaper sources after year 3 when downtime, spare parts and audit labor are included. Conversely, sourcing from China/India (Tier 3) cuts upfront outlay by $0.9–1.2 M per 10 000 L line, yet imposes hidden costs: 5–8 % of units require weld rework on arrival, export rebates can be rescinded within 30 days, and 25 % tariffs can be reinstated overnight. A 2024 dairy multinational case shows a 14-month payback advantage for Tier 3 evaporated when MOFCOM suspended preferential VAT rebates, adding 13 % to equipment value and pushing IRR below WACC.
Risk-Mitigated Hybrid Model
Leading CPGs now split CAPEX 70/30: core churn and controls from Tier 1 to secure data integrity and warranty alignment; auxiliary tanks and CIP skids from Tier 2/3 to compress budget. Dual-source critical path components (plunger seals, PLC racks) through bonded inventory hubs in Rotterdam and Singapore to buffer geopolitical shocks. Contract FOB+Incoterms 2020 with retention of 15 % until SAT and 5 % until end of warranty to enforce performance. Insert force-majeure clause that allows instant pivot to Tier 1 standby vendor with pre-validated FAT dossiers, limiting production loss to <96 hours.
Financial Analysis: TCO & ROI Modeling
Total Cost of Ownership (TCO) & Financial Modeling for Industrial Butter Churners
Acquisition Cost Is <55 % of Lifetime Spend
FOB prices for 1 000–2 000 L stainless-steel churns currently range $50 k–$80 k for European OEMs and $38 k–$55 k for Tier-1 Chinese builders. Even at the low end, the invoice value rarely exceeds half of the cash that leaves the P&L over a seven-year depreciation cycle. Energy, maintenance, and logistics drag the effective capital charge to $135 k–$190 k per unit in a mid-sized dairy (3-shift, 280 days/yr).
Energy Efficiency: 0.85 kWh per kg Butter Becomes the Swing Variable
Drum motors are rated 15–22 kW; real-world meter data show 0.75–1.05 kWh kg⁻¹ butter depending on cream inlet temperature and PLC-controlled agitation ramps. A 1 % annual loss in motor efficiency adds $1.1 k yr⁻¹ at €0.12 kWh⁻¹. Specify IE4 synchronous motors and request a guaranteed ≤0.85 kWh kg⁻¹; the premium is <3 % of FOB but yields $7 k–$9 k NPV over seven years at 8 % WACC.
Maintenance Labor & Spare-Parts Logistics
Seals, bearings, and inverter boards account for 68 % of unplanned stops. OEM spare-parts list prices carry 220 %–310 % aftermarket margin; holding critical inventory (mechanical seal kits, HMI touch panel, Danfoss VLT) ties up $4 k–$6 k per churn. Negotiate a 5-year “parts only” index-linked contract capped at CPI +2 %; this cuts expected downtime from 42 h yr⁻¹ to 18 h yr⁻¹ and reduces labor overtime by 0.35 FTE across a 4-line hall. Budget $3.2 k yr⁻¹ for scheduled maintenance labor plus $1.8 k yr⁻¹ for consumables.
Resale Value & Exit Risk
Secondary buyers (Southeast Asia, North Africa) currently pay 28 %–34 % of original FOB for sub-10-year machines with full 3-A or CE dossier. If stainless-steel scrap (304 grade) falls below $1.35 lb⁻¹, residual value can dip to 12 %–15 %. Model a straight-line exit value of 25 % in base-case NPV; stress-test at 15 % to flag over-leverage in high-capex roll-outs.
Hidden Cash Outflow Table (Indexed to FOB = 100)
| Cost Element | Europe OEM | China OEM | Driver | Cash Timing |
|---|---|---|---|---|
| Supervised Installation & Rigging | 12–15 | 15–18 | Plant floor reinforcement, 5 t crane | Q0 |
| Commissioning & FAT Travel | 3–4 | 5–7 | 2 technicians, 5 days, flights + hotel | Q0 |
| Operator Training (4 staff) | 2–3 | 4–6 | 3 days at OEM academy, visas | Q0–Q1 |
| Import Duty + Brokerage | 0 | 8–12 | HS 8434.20, MFN rate 8 % (US), 12 % (EU anti-dumping) | Q0 |
| Insurance & Inland Freight | 2–3 | 3–4 | 0.15 % of FOB + truck | Q0 |
| Total Hidden Layer | 19–25 | 35–47 | — | — |
A European churn at $70 k FOB therefore needs $14 k–$18 k in “invisible” cash at closing; a Chinese unit at $45 k needs $16 k–$21 k, eroding the headline $25 k savings to <10 % after duties.
TCO Sensitivity: 7-Year NPV at 8 % Discount
Base case (1 500 L, EU OEM, 0.85 kWh kg⁻¹, 25 % resale) yields NPV –$148 k; worst-case (1.05 kWh kg⁻¹, 15 % resale, CPI +4 % spares) deteriorates to –$189 k, a 28 % swing driven mainly by energy and parts inflation. Lock energy performance, spares inflation cap, and confirm duty classification before Board sign-off; these three levers move IRR by >400 bps and shorten payback from 5.1 to 3.7 years.
Risk Mitigation: Compliance Standards (USA/EU)
Critical Compliance & Safety Standards (Risk Mitigation)
Non-compliant butter churner imports expose firms to product seizures, forced recalls, and civil penalties >$200k per shipment. The legal exposure is asymmetric: US Customs can issue a Withhold Release Order (WRO) on suspicion of missing UL or OSHA documentation, while EU market-surveillance authorities can impose €15k–€2 M fines under the Machinery Directive before the first kilo of butter is ever produced. Executives should therefore treat certification as a binary gate—no variance, no negotiation, no retro-fit.
United States Gatekeepers
Under 19 CFR §159, every industrial churn is classified as “electrical machinery” if motor-driven (>0.75 kW). That triggers UL 508A for the control panel and NFPA 70 (NEC) field-installation rules. Missing UL listing forces port-of-entry re-export at the importer’s cost; average detention demurrage now runs $3k–$5k per day. OSHA 29 CFR 1910.212 mechanical-power press clauses apply to churns with ribbon or blade agitators >300 rpm; non-compliant guarding carries a $13k–$156k penalty schedule (OSHA FY-24 inflation-adjusted). FDA 21 CFR §117 Subpart C governs any surface contacting cream or butter; surfaces must be AISI 316L or equivalent, <0.8 µm Ra, and free of cadmium, lead, or antimony. A single positive swab for non-food-grade lubricant triggers a Class-II recall affecting every downstream SKU, with average recall cost now $11.5 M (Food Marketing Institute 2024).
European Union Gatekeepers
The Machinery Directive 2006/42/EC mandates CE marking plus a full Technical File (risk assessment, EN 60204-1 electrical safety, EN ISO 13849-1 PL “c” minimum for safety controls). The Food Contact Regulation (EU) 10/2011 requires Declaration of Compliance (DoC) for all plastic components; migration testing must cover 15% ethanol and isooctane simulants. Missing DoC empowers national enforcement to issue an Article 38 Union-wide withdrawal; average customs storage in Rotterdam is €1.2k per TEU per day plus testing fees of €5k–€8k. From 2025-07-01, the Cyber-Resilience Act applies to churners with Ethernet/OPC-UA ports; non-compliance fines scale to €15 M or 2.5% of global turnover, whichever is higher.
Cost of Compliance vs. Cost of Failure
| Certification / Standard | Lead-Time (weeks) | Compliance Cost Index (ex-works, 2 000 L churn) | Typical Penalty Range if Missing | Probability of Detection at Border | Retro-Fit Cost Multiplier |
|---|---|---|---|---|---|
| UL 508A + Field Label (US) | 4 – 6 | $6k – $9k | $13k – $156k (OSHA) | 0.85 | 2.3× |
| FDA 21 CFR §117 Material certs | 2 – 3 | $1k – $2k | Recall $11.5 M (avg) | 0.40 | 4.0× |
| CE MD Technical File | 6 – 8 | $8k – $12k | €15k – €2 M (member-state) | 0.90 | 2.8× |
| EU 10/2011 Food-contact DoC | 3 – 4 | $2k – $3k | €5k – €500k | 0.65 | 3.5× |
| Cyber-Resilience Act 2025 | 8 – 12 | $10k – $15k | €15 M / 2.5 % turnover | 0.25 (phased) | 5.0× |
Supply-Chain Execution Checklist
Insist that suppliers embed compliance milestones in the Purchase Order Ts & Cs: 30% of contract value held in escrow until digital copies of UL, CE, and FDA documentation are uploaded to a mutually accessible blockchain-enabled vault. Require notarized translations of EU Declaration of Incorporation for partially completed machinery; customs officers in Hamburg and Los Angeles now scan QR codes on DoC for authenticity. Budget an extra 2–3 weeks buffer in critical-path schedules for third-party witnessed testing (TÜV, Intertek); post-COVID lab backlogs still run 15–20 days. Finally, negotiate “duty to defend” clauses shifting regulatory-fine liability onto the OEM; average legal spend to challenge a WRO is $75k–$120k, recoverable only if supplier warranties are explicitly worded.
Bottom line: Certification is not a line-item cost—it is insurance against catastrophic P&L events. Treat the $15k–$25k compliance package as a 0.3% premium on a $5 M capital project that otherwise carries an 11% probability of seven-figure loss.
The Procurement Playbook: From RFQ to Commissioning
Strategic Procurement Playbook – Industrial Butter Churners
1. RFQ Architecture
Anchor every request to capacity band (500–2 000 L), stainless grade (304 vs 316L), and target output of 5 T/day. Specify CAGR-linked volume ramp (15.8 % 2025-33) to lock in price-volume ladders instead of one-off discounts. Insert a “materials inflation cap”: stainless surcharges limited to LME-Ni 30-day average + 4 %; butter price volatility pass-through capped at ±6 % of unit price. Demand dual-source BOM disclosure (motors, VFD, seals) to expose single-source chips or bearings. Require 24-month obsolescence warranty plus 10-year spare-parts availability guarantee with an escrow of critical castings. Compliance matrix must reference CE/ISO 9001, 3-A SSI, and EHEDG in a single column to avoid cherry-picking; failure to tick all four is automatic disqualification.
2. Supplier Due-Diligence & Sample FAT Protocol
Score vendors on “value-at-risk” (VaR): (unit price × lead time days) / on-time delivery %. Benchmark threshold is VaR ≤ $2.5 M for a $70k churner. FAT must run 3× rated load for 4 h using 38 % fat cream at 8 °C; accept only ±1 % overrun deviation and ≤0.2 % free moisture. Demand vibration spectrum <2.8 mm/s RMS and noise ≤72 dB(A) at 1 m. Collect OEE dataset (availability, performance, quality) for the last five identical serial numbers; reject if any metric <85 %. Insert “FAT sign-off = 90 % payment trigger” to keep 10 % hostage until SAT.
3. Contractual Risk Allocation – FOB vs DDP
Use DDP only when landed-cost volatility >8 % of unit value; otherwise FOB Shenzhen/Tuticorin plus cargo insurance placed by buyer cuts 3–4 % of price. Penalty clause: 0.5 % of contract value per day delay after grace of 1 week; cap at 10 %. Force majeure must exclude “epidemic & semiconductor shortage”—these are now foreseeable. Insert “repair-or-replace” <30 days or 20 % refund right. Escalation path: SIAC arbitration Singapore, seat law English, award enforceable under NY Convention—median duration 8 months vs 24 months in Indian courts.
4. Shipping & Installation Governance
Book 40’HC reefer only if temperature deviation warranty >±2 °C is contractually accepted; else flat-rack + desiccant saves $1.2k–$1.8k. Commissioning protocol: three consecutive batches at nameplate throughput, Cpk ≥1.67 on butter moisture, and ≤1 ppm residual detergent in rinse water. Retain 5 % final acceptance until 30-day performance bank guarantee expires.
5. Decision Matrix – FOB vs DDP vs CFR
| Cost & Risk Vector | FOB Shenzhen | CFR Mumbai | DDP Wisconsin |
|---|---|---|---|
| Unit Price Range (500 L drum) | $50k – $62k | $58k – $70k | $74k – $88k |
| Landed Cost Volatility Exposure | Buyer absorbs freight + bunker + FX | Seller absorbs freight; buyer absorbs import duty & FX | Seller absorbs all; buyer flat |
| Transit Time Variability (days) | 28 ± 7 | 28 ± 5 | 35 ± 3 |
| Import Duty & VAT (USA) | Buyer liable 0 % duty + 0 % VAT | Buyer liable 0 % duty + 0 % VAT | Embedded in price |
| Risk of Loss Transfer Point | Rail-side China | Mumbai port dock | Plant gate USA |
| Cash-out (months earlier) | 2.5 | 2.0 | 0 |
| Total Cost of Risk (median) | $4.1k | $2.8k | $0.9k |
Choose FOB when internal freight desk can beat market by ≥6 %; else DDP flattens budget variance and accelerates capex approval by 3–4 weeks.
6. Post-Commissioning Lock-In Mitigation
Negotiate “software escrow” for PLC code and HMI source; updates delivered within 30 days of patch release or $500/day penalty. Secure life-cycle cost guarantee: spare parts price inflation ≤CPI +2 % for 7 years. Maintain dual sourcing of high-wear parts (shaft seals, bearings) with ≥2 qualified suppliers to avoid 18-week single-source traps seen in 2022-23.
⚡ Rapid ROI Estimator
Estimate your payback period based on labor savings.
Estimated Payback: —