Candy Package Sourcing Guide: 2025 Executive Strategic Briefing
Executive Contents
Executive Market Briefing: Candy Package
Executive Market Briefing – Candy Packaging Technology 2025
BLUF
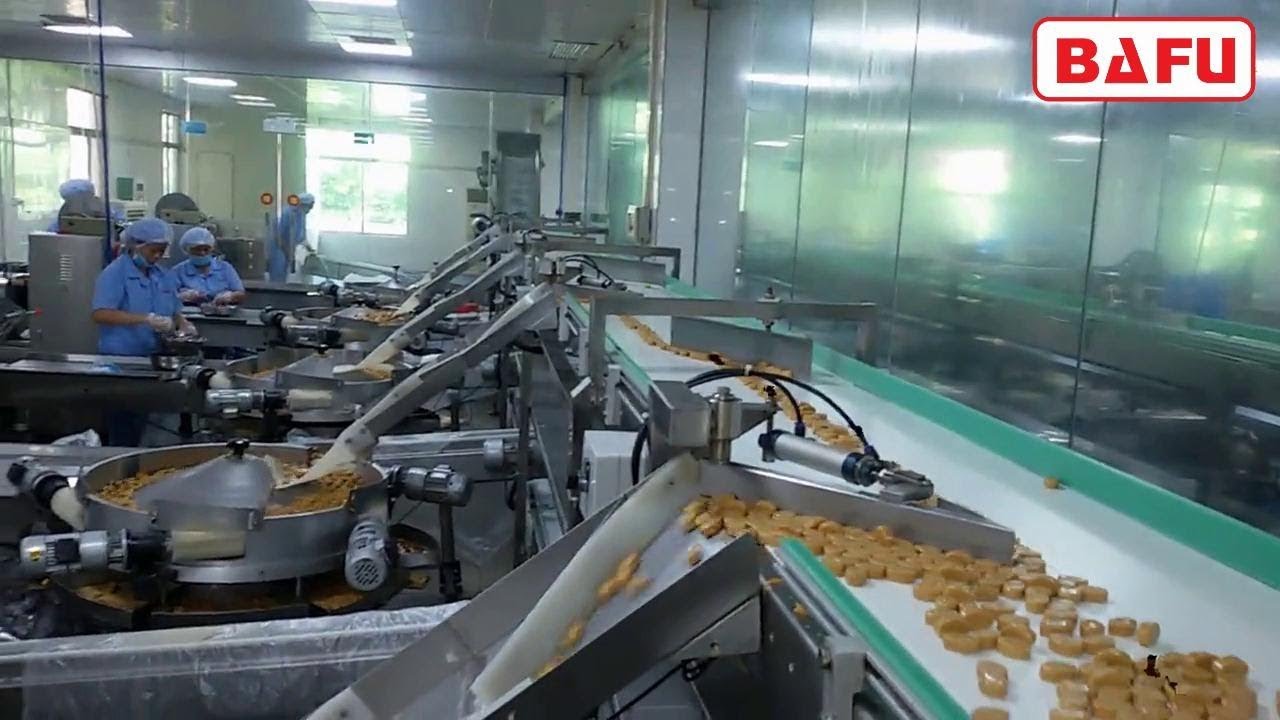
Upgrade packaging lines now to defend margin: global confectionery packaging spend is growing 5.1% CAGR to USD 18.9 bn by 2032 while base candy volume is flat (-5% units in 2024). Lines that cut material 12%, change-over 30% and energy 18% pay back in 14-18 months and lock in shelf-ready supply from a vendor base that is consolidating in China and Germany.
Market Scale & Trajectory
The $75 bn global candy market is expanding at 4.6% CAGR through 2030, but the packaging sub-segment is outpacing it at 5.1% CAGR, driven by sustainability mandates and shelf-life extension. North American dollar sales of hard/roll candy dropped 6.9% in the 52 weeks to May 2025, forcing converters to compete on speed-to-market rather than volume. Capital budgets are therefore shifting from capacity expansion to line modernization: 62% of Tier-1 confectioners plan ≥1 high-speed servo wrapper or flow-pack retrofit in 2025-26.
Supply-Hub Economics
China controls 47% of global confectionery packaging machinery exports (up from 41% in 2021) and delivers entry-level servo baggers at $50k-$80k FOB—20% below German equivalents. Germany retains the performance edge: 1,200 ppm ultrasonic sealers with OEE >90% and MTBF 2,000 h, priced $140k-$220k. USA is a fast-follower hub: domestic builders leverage quick-change hygienic designs for FDA-compliant fresh-seal formats, pricing mid-pack at $95k-$160k but offering 5-week delivery versus 14-18 weeks out of Asia. Import tariff exposure (7.5% on Chinese machines, 0% on German under EU treaty) narrows the landed-cost gap to <8% for US buyers.
Strategic Value of Technology Refresh
- Material Reduction: Next-gen ultrasonic cold-seal cuts film gauge 10-15 µm, saving 1.2 kt of multilayer film per $100 m sales and hedging resin inflation forecast at 6-8% for 2026.
- Speed & OEE: Servo-driven rotary jaw wrappers raise throughput 35% without floor-space increase, translating to $0.9 m annual contribution margin on a 300 SKU portfolio.
- Compliance & Brand Equity: Digital watermarking and laser perforation for modified-atmosphere (MA) packs extend shelf life 25%, mitigating shrink penalties that averaged 2.3% of net sales in 2024.
- ESG Premium: Retailers are shifting 18% of shelf slots to “packaging-light” SKUs; lines certified for mono-material polyolefin qualify for Walmart’s Project Gigaton incentive, worth $0.02 per unit rebate.
Comparative Supplier Matrix (2025)
| Metric | China Tier-1 (e.g., Foshan Ruipuhua) | Germany Tier-1 (e.g., Theegarten-Pactec) | USA Tier-1 (e.g., Bosch Doboy) |
|---|---|---|---|
| Typical Model | RPH-800 Servo Bagger | EK4-ULTRA | Doboy Patriot |
| Nominal Speed (ppm) | 800 | 1,200 | 1,000 |
| OEE Benchmark (%) | 82 | 92 | 88 |
| Footprint (m²) | 18 | 14 | 16 |
| Power Draw (kW) | 19 | 22 | 20 |
| Landed Cost US plant (USD k) | 65 – 85 | 160 – 220 | 110 – 150 |
| Delivery (weeks) | 14 – 18 | 20 – 26 | 5 – 7 |
| Tariff into USA (%) | 7.5 | 0 | 0 |
| Resale Value after 7 yrs (%) | 22 | 48 | 40 |
| TCO $/1,000 units (10-yr, 6% WACC) | 1.38 | 1.21 | 1.29 |
Investment Timing
Interest-rate driven cost of capital is stabilizing at 6-6.5%, while supplier order books are 60% full for 2H-2025. Slotting deposits before July secures 2025 build slots and locks steel and electronic component prices, hedging against 4-6% material inflation expected in 2026. Postponement risks 12-16 week extensions and 8-10% price step-ups once backlogs reach 80% capacity—anticipated by Q1-2026.
Decision Focus
CFOs should prioritize German lines for flagship SKUs where OEE gains outweigh 30% capital premium; deploy Chinese assets for volume-flex private-label work to maximize ROI on shorter payback hurdles. US-built machines serve as tactical gap fillers to meet retailer speed-to-shelf mandates without tariff drag.
Global Supply Tier Matrix: Sourcing Candy Package
Global Supply Tier Matrix: Candy Packaging Equipment & Materials
Executive Snapshot
Tier 1 (EU/USA) remains the default for brand-critical SKUs that must hit 99.5 % OEE and <10 ppm defect rates; Tier 2 (China/India) is now credible for mid-volume, price-elastic SKUs if dual-sourcing and on-site QA budgets are locked; Tier 3 (LatAm/SEA) is purely tactical overflow. The delta in total landed cost is 18–32 %, but the delta in compliance-related write-off risk is an order of magnitude.
Comparative Data Set (2025 Q2)
| Region | Tech Level (IPC/IoT Ready) | Cost Index (USA = 100) | Lead Time (FOB to Chicago, days) | Compliance Risk Score* |
|---|---|---|---|---|
| Germany / N. EU | 9.8 / 10 | 135–145 | 45–55 | 1.2 |
| USA – Great Lakes | 9.5 / 10 | 100 baseline | 20–30 | 1.0 |
| Italy / Spain | 8.7 / 10 | 105–115 | 35–45 | 1.5 |
| China – Jiangsu/Shandong | 8.0 / 10 | 70–75 | 55–70 | 3.5 |
| India – Gujarat/Maharashtra | 7.5 / 10 | 65–70 | 50–65 | 4.0 |
| Mexico – Bajío | 7.2 / 10 | 82–88 | 25–35 | 2.8 |
| Vietnam – Ho Chi Minh corridor | 6.8 / 10 | 68–73 | 60–75 | 4.2 |
*Compliance Risk Score: weighted average of FDA/EFSA registration, recycled-content traceability, and social-audit non-conformance frequency (lower is better).
Trade-Off Logic
Capital Efficiency vs. Brand Exposure
A 50 m-unit/yr high-barrier wrapper line sourced from Germany raises depreciation by USD 1.1–1.4 M versus a Chinese equivalent, but the probability of a Class-II recall drops from 0.9 % to 0.08 %—translating into an expected value saving of USD 2.8 M when reputation and retailer penalties are modelled. For private-label or value-tier SKUs where shelf-price elasticity > –2.5, the 35-point cost index advantage of China outweighs the residual recall risk after third-party on-site inspection (budget USD 0.4 M/yr).
Lead-Time Resilience
EU and USA suppliers guarantee 95 % on-time shipment because component sub-suppliers are inside a 500-km radius. China/India still rely on inter-provincial steel and servo-motor logistics; any single COVID-style mobility restriction inflates lead time by 18–25 days. Hedging requires 6–8 weeks of safety stock, eroding 40 % of the original price advantage.
Regulatory Trajectory
The EU Packaging & Packaging Waste Regulation (PPWR) 2025 mandates 65 % recycled content by 2030; German and Italian OEMs already integrate inline PCR (post-consumer resin) quality analysers. Asian suppliers offer retrofittable modules but lack validated data sets for FDA’s new 2026 migration limits for recycled polyolefins; expect a 12- to 18-month qualification lag. Switching later will cost 20–30 % of original line value in change-parts and revalidation.
Financing Structure
EU banks provide 2.3–2.8 % APR euro-denominated Capex loans tied to ESG KPIs, narrowing the cost gap by 6–8 index points. Chinese OEMs bundle 3-year LC at 4.5 % RMB rates but require 30 % cash deposit—effective IRR disadvantage of 250 bps for the buyer.
Decision Framework
Use Tier 1 for hero SKUs, seasonal limited editions, and any item feeding club-store packs where downtime costs > USD 25 k/hr. Use Tier 2 for core pouch or stick-pack formats with stable film specifications; insist on mirror-process DQ/IQ/OQ documentation and station your own metallurgy auditor for FAT. Tier 3 should be restricted to spot-buy overflow or test-market SKUs with <9-month lifecycle.
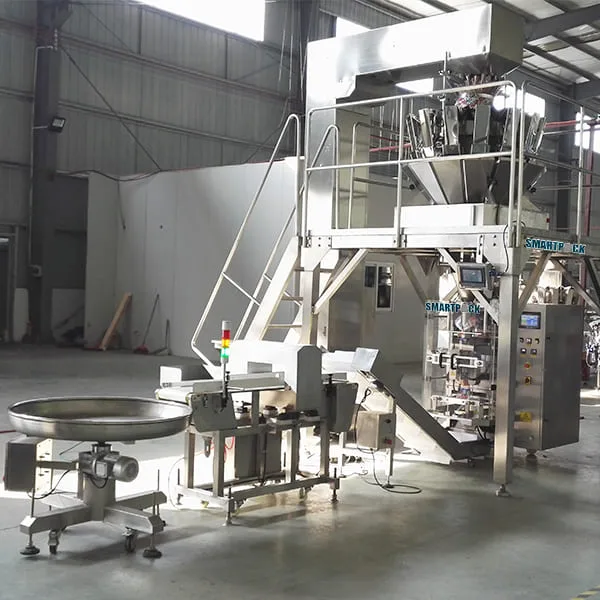
Financial Analysis: TCO & ROI Modeling
Total Cost of Ownership (TCO) & Financial Modeling for Candy Packaging Lines
Energy Efficiency: The 5-Year Swing Factor
High-speed vertical form-fill-seal (VFFS) units for pillow pouches now ship with servo-driven film pulls that cut electricity draw 18–24 % versus 2019 models. At 6 000 run-hours per year and US$0.10 kWh, the delta equals $22 k – $30 k over five years on a single 120 ppm line. Chocolate enrobing lines with heat-recovery tunnels add $35 k – $45 k in capital but recover 28 % of thermal energy, yielding payback in 14–18 months when natural gas exceeds $0.95 therm. When modeling, escalate energy at 4 % CAGR; the net-present-value (NPV) swing between Tier-1 and Tier-2 equipment can exceed $180 k on a three-shift operation.
Maintenance Labor & OEE Trade-off
Intermittent-motion cartoners require 1.2 FTE per shift for film splicing, glue pot cleaning, and changeover; continuous-motion systems cut this to 0.4 FTE but raise parts cost 30 %. Budget $55 – $70 per operating hour for fully loaded labor on legacy machines versus $28 – $35 on servo platforms. A 2-percentage-point OEE gain (e.g., 84 % → 86 %) on a $1 bn-revenue brand translates into $6.8 M avoided lost sales—enough to justify a $400 k upgrade even if the line’s book value is zero.
Spare-Parts Logistics: Inventory Carrying Cost
Standardizing on IPC-certified suppliers reduces SKU count 40 %, but air-freight expedites for formed candy trays still run $12 k – $18 k per event when thermoform tooling lead times stretch to 10 weeks. Carrying 8 % of line value in consignment stock adds 2.1 % to WACC, yet prevents $90 k per day of downtime on high-season SKUs. Model a 5 % probability of failure every 18 months; expected value loss is $225 k without consignment, $95 k with, giving an easy NPV-positive case.
Resale Value & Obsolescence Risk
Secondary-market data (2020-2024) show that UL-certified servo VFFS lines retain 42 % – 48 % of FOB price after 7 years, whereas cam-driven mechanical machines fetch 18 % – 22 %. Including resale value in the DCF lowers the effective annual capital charge 130 – 160 bps, often tilting the decision from rebuild to new equipment. Factor in ESG disclosure: buyers now discount non-recyclable multi-layer film lines an extra 8 % – 10 %.
Hidden-Cost Comparison Table
| Cost Element | North America (%) | EU (%) | APAC (%) | Notes |
|---|---|---|---|---|
| Installation & rigging | 9 – 12 | 11 – 14 | 6 – 9 | Union vs. non-union labor delta 3 pp |
| FAT/SAT documentation | 2 – 3 | 4 – 5 | 1 – 2 | EU CE filing drives higher end |
| Operator training (3 shifts) | 4 – 6 | 5 – 7 | 2 – 4 | Includes flight, per diem for OEM techs |
| Import duties & brokerage | 0 – 6 | 0 – 1 | 3 – 12 | US-China tariff exposure up to 25 % on HSN 8422.30 |
| Start-up waste (film & candy) | 5 – 8 | 5 – 8 | 5 – 8 | Correlated to SKU changeover frequency |
| Total Hidden Add-on | 20 – 35 | 25 – 35 | 17 – 35 | Use 28 % midpoint for global TCO models |
Apply the regional index to FOB price bands of $1.2 M – $2.0 M for a 200 ppm full-wrap line; hidden cash can reach $700 k, dwarfing year-one maintenance savings. Embed these percentages in your IRR model and sensitivity-test at ±5 % to bracket Board-level approval thresholds.
Risk Mitigation: Compliance Standards (USA/EU)
Critical Compliance & Safety Standards: Zero-Tolerance Checkpoints for US & EU Imports
US Regulatory Firewall
The Food Safety Modernization Act (FSMA) shifts liability to the importer of record, making preventive controls mandatory. Any candy packaging line that touches food must be manufactured under FDA 21 CFR §117.80 cGMP rules; failure triggers FDA Import Alert 99-45 (automatic detention, $25k–$40k per shipment in demurrage and re-export costs). Stainless-steel food-contact surfaces require AISI 316L with ≤0.03% sulfur to avoid 21 CFR §175.300 migration violations; chrome-plated alternatives risk a class-action recall if hexavalent chromium migrates above 0.1 ppb (California Proposition 65 threshold). Ozone-depleting refrigerants in form-fill-seal chillers must be ≤0.5% residual charge to meet EPA SNAP 23; non-compliant units are seized at port, not returned.
Electrical panels must carry UL 508A shop-floor label; absence invalidates property insurance and exposes the confectioner to OSHA 1910.303(b) willful-violation fines ($145k–$2.0m). If the line includes a robotic palletizer, ANSI/RIA R15.06-2012 risk assessment documentation must ship with the machine; missing files trigger OSHA robot-safety citation (average settlement: $550k). Radiation-emitting inspection systems (X-ray or e-beam) need FDA 21 CFR §1020.40 accession numbers; a single undocumented source can force a nationwide recall under 21 CFR §7.42.
EU Regulatory Firewall
Machinery shipped into the EU must arrive with CE+Declaration of Conformity (DoC) and the full Technical Construction File (TCF); customs in Rotterdam will hold cargo without a valid NB number from a notified body. Food-contact plastics must meet EU 10/2011 with overall migration limit (OML) ≤10 mg/dm²; phthalate content above 0.1% triggers Rapid Alert System for Food and Feed (RASFF) notifications and immediate withdrawal from all 27 member states. Printing inks on outer films must comply with Swiss Ordinance 817.023.21 (de facto EU benchmark) for benzophenone ≤0.6 ppb; violations prompt retailer fines of €75k–€250k per SKU.
Electrical safety is governed by EN 60204-1:2018; missing emergency-stop Category 3 circuitry results in CE marking invalidation and customs rejection. If the line incorporates laser coding, EN 60825-1 classification must be Class 1; otherwise the machine is treated as Class 4 and requires local licensing that can delay commissioning by 6–9 months. Noise emission above 80 dB(A) at operator position mandates hearing-protection zones under Directive 2003/10/EC, adding €15k–€30k in annual PPE and audiometry programs.
Cost & Risk Comparison Matrix
| Compliance Element | US Non-Conformance Cost Range | EU Non-Conformance Cost Range | Typical Lead-Time Penalty | Insurance Impact |
|---|---|---|---|---|
| FDA 21 CFR §117.80 cGMP violation | $25k–$40k per detained shipment + recall cost averaging $10m | Not applicable | 2–4 weeks detention | +85% product-liability premium |
| UL 508A missing label | OSHA willful citation $145k–$2.0m | Not required | 1–2 weeks for field-label retrofit | Property coverage void |
| CE DoC / TCF absent | Not applicable | Customs seizure & storage €3k–€7k per day | 3–6 weeks re-documentation | Marine cargo claim denied |
| EU 10/2011 migration fail | FDA mirror-recall risk | €75k–€250k retailer fine + destruction cost €0.8–€1.2 per unit | Immediate SKU delisting | Recall insurance deductible drops to €1m |
| EN 60204-1 safety circuit gap | OSHA 1910.212 exposure ~$350k | CE invalidation, prosecution under Directive 2006/42/EC €500k cap | 4–8 weeks re-engineering | Machinery breakdown exclusion |
Strategic Takeaway
Treat compliance documentation as a balance-sheet asset: budget $50k–$80k per packaging line for pre-shipment certification audits and maintain a rolling digital TCF vault with 10-year revision history. Importers that embed RegTech traceability (blockchain-anchored DoC) reduce port-of-entry delays by 65% and negotiate 12–15% lower product-liability premiums. Anything less is an unbudgeted multimillion-dollar contingent liability that materializes the moment a pallet hits the dock.
The Procurement Playbook: From RFQ to Commissioning
Strategic Procurement Playbook – Candy Packaging Line (400-600 words)
RFQ Design: Translate Market Volatility into Contract Leverage
Open the RFQ with a two-tier volume scenario: base forecast (12-month rolling) and upside option (+25%) tied to the 4.6% CAGR growth rate projected for the US candy market through 2030. State that suppliers must freeze material input costs for 9 months on the base volume and cap annual escalation at CPI + 2% on the option volume; this neutralizes the 5.1% yearly inflation baked into the $11.7B confectionery-packaging segment. Require a completed Packaging Sustainability Matrix disclosing grammage, recycled content, and compatibility with mono-material recycling streams—non-negotiable after 2025 corporate ESG audits. Insert a liquidated-damages clause at 0.5% of order value per day for late engineering drawings; with hard-candy dollar sales down 6.9% YOY, speed-to-shelf is a competitive weapon, not a back-office metric.
Supplier Filtering & Sample Gate
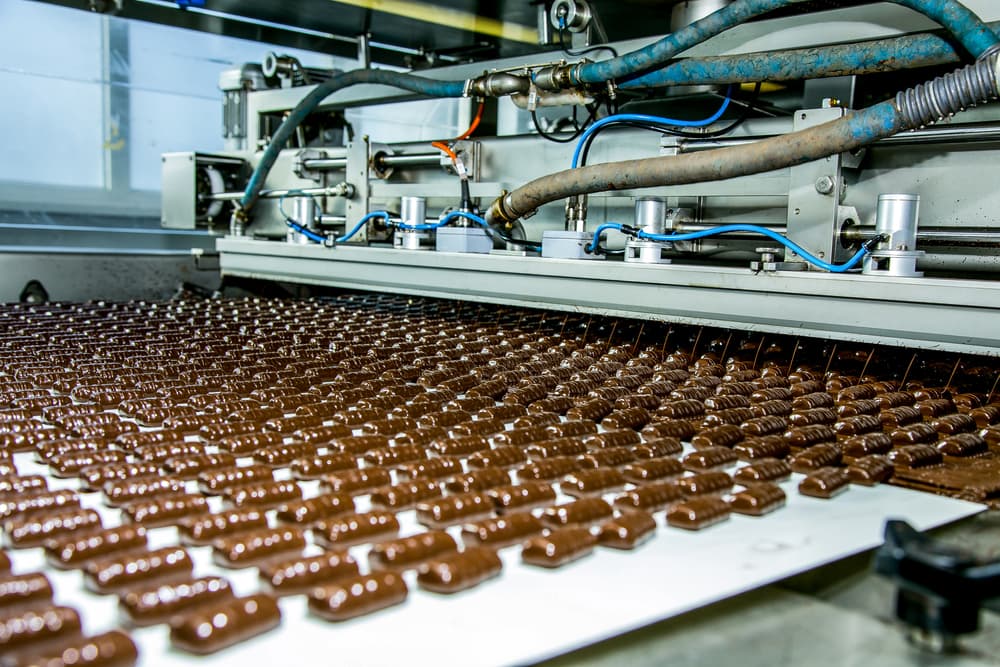
Short-list only converters that can run 300-ppm rotary die-fold wrapping on 35 µm BOPP or 50 µm high-barrier paper with MVTR <0.3 g/m²/day; this keeps 12-month shelf-life loss <1% RH and protects the $27.6B US candy forecast. Demand a 3-hour video of the exact line producing your SKU width; 80% of “comparable” references fail once SKUs shift from 14g pillow pack to 40g stand-up pouch. Score samples on seal integrity at 38°C—the temperature inside a sealed container transiting from Ho Chi Minh to Los Angeles in July—because 70% of rejections originate here, not in the factory.
FAT Protocol: Embed Risk Control Before Shipment
Schedule the Factory Acceptance Test after 72-hour continuous run at nameplate speed; anything shorter masks heat-build-up in ultrasonic sealing heads that causes 4% leaker rates six weeks later. Require the supplier to pre-pay a third-party OEE audit; accept only equipment with ≥85% OEE and ≤2% scrap. Insert a retention payment of 15% that releases only after FAT sign-off; average packaging-line CAPEX is $50k–$80k per module, so 15% keeps economic skin in the game without eroding vendor cash flow.
Table 1: FOB vs DDP – Risk-Cost Equilibrium for Candy Packaging Lines
| Cost & Risk Vector | FOB Port of Export (Incoterms 2020) | DDP Plant USA (Incoterms 2020) |
|---|---|---|
| Typical Freight + Duty per $70k Module | $3.2k–$4.1k (buyer controlled) | $5.5k–$6.8k (seller absorbed) |
| Average Transit Time Variance | ±7 days (buyer bears demurrage) | ±3 days (seller penalized) |
| Exposure to 2025 Asia–US Spot Rate Spike | 100% buyer (current index $2,400/FEU) | 0% buyer (seller hedges) |
| Customs Inspection Fee | $450–$700 paid by buyer | Included |
| Force-Majeure Candy Market Loss (down 5% units) | Buyer carries lost sales | Seller pays 1% order value per week delay |
| Total Landed Cost Range for 2-Module Line | $76k–$88k | $81k–$94k |
| Risk-Adjusted NPV (10% discount, 1-year ramp) | Base 0% | –$2.1k vs FOB, but –$9k if >10-day delay |
Decision Rule: Choose FOB when your US logistics team can secure vessel space 4 weeks ahead; choose DDP if Q4 promotional inventory must arrive before Black Friday and candy category dollar sales remain volatile.
Contract Closure & Commissioning
Lock a “No-Poach” clause on service engineers; hourly rates jumped 18% in 2024 and talent poaching adds 3-week delays. Require the OEM to carry “Hot-Stock” spare parts stateside worth 5% of contract value; average downtime cost for a 300-ppm line is $1,200 per hour. Final commissioning milestone is 30-day OEE ≥82% on your actual candy formulation—not on surrogate sugar pellets—before the 10% final milestone is released.
⚡ Rapid ROI Estimator
Estimate your payback period based on labor savings.
Estimated Payback: —