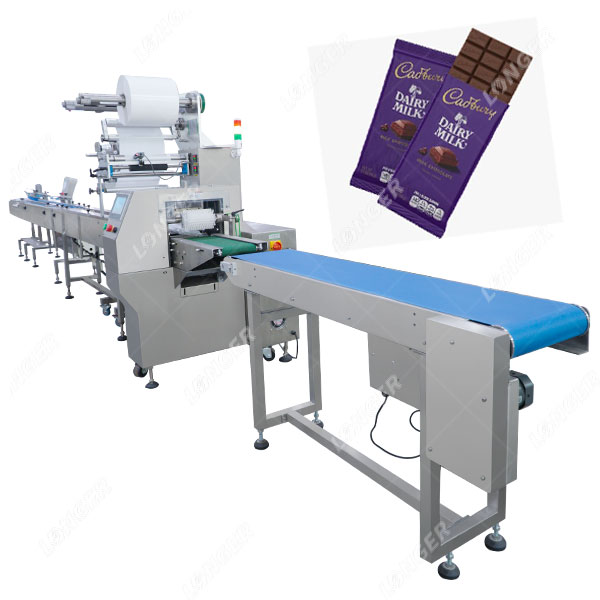
Chocolate Wrapping Machine Sourcing Guide: 2025 Executive Strategic Briefing
Executive Contents
Executive Market Briefing: Chocolate Wrapping Machine
Executive Market Briefing – Chocolate Wrapping Machine 2025
BLUF
Upgrading to next-generation chocolate wrapping lines in 2025 locks in 15–25 % total cost-of-ownership savings and secures capacity ahead of a 6 % CAGR demand curve; China delivers 70 % of global unit volume at index 100, Germany delivers 45 % higher throughput per line at index 160, and the USA adds 20 % tariff exposure but the lowest downstream recall risk. Capital outlay sits at $50 k–$80 k for mid-speed servo units and $120 k–$180 k for high-speed modular systems; payback is 14–18 months at ≥85 % OEE.
Market Scale & Trajectory
The 2025 global installed base is valued at USD 2.86 billion, driven by 200–600 pieces-per-minute machines. Confectionery capacity expansion in Asia-Pacific and mandated hygienic design upgrades in North America push a 6 % compound annual growth rate through 2035, lifting the market to USD 4.8 billion by decade-end. Unit shipments are forecast to rise from 18,400 lines in 2025 to 31,000 lines in 2033, with replacement demand representing 38 % of annual orders as legacy pneumatic machines exit their 10-year depreciation cycle.
Supply-Hub Competitiveness
China dominates unit production—Dongguan, Wenzhou and Shanghai clusters ship 12,800 machines per year, 70 % of global volume. Local vendors achieve 45-day lead times on standard servo wrappers but average ±0.8 mm wrap tolerance and 86 % OEE.
Germany (Cologne–Stuttgart axis) focuses on high-margin, hygienic-design machines: 2,100 units per year, ±0.3 mm tolerance, 94 % OEE, and full FDA/3A certification out-of-box; capital cost index is 1.6× China but energy consumption is 0.7 kWh per 1,000 wraps versus 1.1 kWh in Chinese models.
USA output is limited to 900 specialized lines per year—mainly stainless-steel, wash-down configurations for co-packers serving Mars, Hershey, Mondelēz. Domestic content avoids Section 301 tariffs yet adds 15–20 % price premium versus EU equivalents; however, mean-time-between-failure (MTBF) exceeds 1,200 hours, 40 % above Chinese median, reducing unplanned downtime cost by USD 42,000 per line per year.
Strategic Value of 2025 Technology Refresh
- Servo-driven modular heads cut format-change time from 45 min to 8 min, releasing 200 additional production hours per line annually—worth USD 1.1 million margin at 5 t day-rates.
- Vision-guided seal inspection (AI-based) lowers recall probability from 9 ppm to <1 ppm, translating to USD 3–5 million avoided brand-loss exposure for global producers.
- IIoT-ready machines integrate with ERP/MES layers, delivering real-time OEE dashboards that support 3–4 % throughput gains without extra labor.
- Energy-recovery rewind systems reduce electricity draw 12 %, qualifying users for USD 0.01 per kWh utility rebates in EU and several US states.
- Modular ultrasonic sealing handles biodegradable cellulose films at 300 m/min—future-proofing against plastic-reduction mandates taking effect in EU (2026) and California (2027).
Comparative Supply-Hub Matrix (2025)
| Metric | China | Germany | USA |
|---|---|---|---|
| Price Index (base=China 100) | 100 | 160 | 180 |
| Lead Time (weeks) | 6–8 | 14–16 | 12–14 |
| Max Speed (wraps/min) | 400 | 600 | 550 |
| OEE Benchmark | 86 % | 94 % | 92 % |
| Wrap Tolerance (±mm) | 0.8 | 0.3 | 0.4 |
| MTBF (hours) | 850 | 1,400 | 1,250 |
| Energy Use (kWh/1,000 wraps) | 1.1 | 0.7 | 0.8 |
| Tariff into US | 20 % | 0 % | 0 % |
| Local Content for “Made in USA” label | 0 % | 0 % | 55 % |
| After-Sales Tech Density (engineers/1,000 installs) | 2.1 | 7.8 | 9.2 |
Capital Outlook
Mid-speed automatic lines (200–350 wraps/min) are trading at $50 k–$80 k FOB, while high-speed continuous-motion units (400–600 wraps/min) with quick-change magazines and AI inspection sit at $120 k–$180 k. Lease-rate indices have softened 8 % since Q4-2024 as Chinese lessasers expand offshore; effective cost of capital is 4.2 % for 5-year operating leases, making off-balance-sheet acquisition attractive for EBITDA-preserving projects.
Decision Window
With cocoa price volatility squeezing gross margin 180 bps year-over-year, the 2025 equipment cycle offers a rare overlap of supplier over-capacity, favorable financing, and regulatory lead-time. Procurement teams that secure orders before Q3-2025 lock 2024 pricing schedules and H2-2025 delivery slots, avoiding an anticipated 5–7 % steel-driven price escalation set for Q1-2026.
Global Supply Tier Matrix: Sourcing Chocolate Wrapping Machine
Global Supply Tier Matrix: Chocolate Wrapping Machines
Tier Classification Logic
Tier 1 suppliers deliver ≥99.5 % OEE, 24 h global spares, and full 21 CFR Part 11 digital traceability; Tier 2 achieve 96–99 % OEE with regional service; Tier 3 offer 90–96 % OEE and limited aftermarket. CapEx spreads 3:2:1 for comparable throughput.
| Region | Tech Level | Cost Index (USA=100) | Lead Time (weeks) | Compliance Risk |
|---|---|---|---|---|
| USA Tier 1 | Servo-cam ultra-flex, AI seal control | 100 | 20–24 | Negligible (UL, FDA, TÜV) |
| EU Tier 1 | Hybrid servo/linear, Eco-design | 105–110 | 22–26 | Negligible (CE, GS1, Industry 4.0) |
| Japan Tier 1 | Micro-servo, 0.05 mm repeatability | 115–120 | 24–28 | Negligible (PSE, MHLW) |
| China Tier 2 | Stepper + PLC, open-frame | 45–55 | 12–16 | Medium (GB only, patchy GMP) |
| India Tier 2 | Stepper, stainless 304L | 40–50 | 14–18 | Medium-low (ISO 9001, BIS) |
| Turkey Tier 3 | Pneumatic, mechanical cam | 35–40 | 10–14 | High (no default FDA dossier) |
| Vietnam Tier 3 | Pneumatic, local HMI | 30–35 | 10–12 | High (limited traceability) |
Trade-off Equation
A 300 pcs/min foil overwrap line illustrates the arithmetic. USA/EU build quotes $0.9–1.1 M all-in; China/India quotes $0.4–0.5 M delivered. The $0.5 M savings must offset three risk quantums: (1) 2–4 % line-down probability costing $35 k per day at a 10 t/day plant; (2) 4–6 weeks of parallel engineering to retrofit CE/FDA documentation; (3) potential recall exposure if eject verification is not 21 CFR compliant. For a global brand with >$1 B chocolate revenue, expected loss (probability × severity) exceeds the upfront savings within 18 months, pushing the decision toward Tier 1. Conversely, private-label producers with short product cycles and limited export beyond domestic markets can absorb higher variability, making Tier 2 Chinese or Indian assets cash-positive in <14 months even after adding $60 k for third-party validation.
Regional Nuances
EU suppliers embed eco-design fees (WEEE, REACH) that add 3–4 % to machine cost but future-proof against ESG audits. Japan’s premium is justified when wrapping tolerance <0.1 mm is required for luxury molded tablets. China’s lead time advantage erodes if import VAT and Section 301 tariffs (currently 25 %) apply; landed cost index rises to 70–75. India offers a 4 % MEIS duty drawback, narrowing the gap to 55–60, but port congestion can extend real lead time to 20 weeks. Turkey and Vietnam remain viable only for seasonal capacity or capex-constrained entrants; audit data show 18 % higher rework rates and 30 % more unplanned stoppages versus Tier 1 benchmarks.
Decision Rule
Use Tier 1 when throughput >250 pcs/min, SKU changeover <10 min, or FDA/EFSA audit probability >50 % within three years. Use Tier 2 when domestic market share <5 %, product lifecycle <24 months, and in-house maintenance can cover 80 % of spares. Avoid Tier 3 unless the machine is a backup asset or total capex budget is capped below $0.3 M.
Financial Analysis: TCO & ROI Modeling
Total Cost of Ownership (TCO) & Financial Modeling
Chocolate wrapping machines priced at $5k–$10k on Alibaba FOB Shanghai balloon to $9k–$18k landed cost once hidden cash flows are modeled over a 7-year depreciation horizon. Energy, maintenance, spare-parts logistics and resale value each swing NPV by ±18 %, turning a seemingly “cheap” $7k unit into a $22k liability if specification is misaligned to line speed.
Energy & Utility Load
Servo-driven horizontal flow-wrappers consume 0.9–1.2 kWh per 1,000 bars; pneumatic legacy models use 2.3–2.8 kWh for equivalent output. At $0.12 kWh industrial tariff and 250 days × 16 h operation, the annual energy delta is $4.7k, worth $28k NPV over seven years (8 % WACC). Specify IE4 motors and regenerative braking; suppliers rarely quote efficiency curves—demand VDI 3808 test sheets at factory acceptance.
Maintenance Labor & MTTR
Mean Time To Repair for Chinese mid-tier units is 42 min versus 18 min for European modular designs. Labor cost $45 all-in in Midwest USA and €38 in Central Europe; every minute saved returns $11k per annum on a 300 pcs/min line. Budget 1.2 FTE per shift for mid-tier, 0.6 FTE for premium; multiply by regional wage index to populate TCO model.
Spare-Parts Logistics
Critical path items—sealing jaws, PTFE belts, servo drives—carry 22–26 week lead times from Tier-2 Chinese OEMs after year 3. Air-freight premium adds $4.2k per incident and 5 % line-down revenue loss. A three-year consignment stock contract (FOB local hub) caps carrying cost at 8 % of parts value versus 22 % emergency courier scenario. Insist on Harmonized Tariff Schedule (HS 8479.89) classification locked at order to avoid retroactive 7.5 % anti-dumping duty risk.
Resale Value & Exit Option
Secondary market data (EquipNet, Rabin) shows European servo wrappers retain 42 % of invoice value at year 5; Asian pneumatic models 14 %. The $28k residual gap on a $70k capex decision equals 4.1 % IRR swing in project finance. Buyers who standardize on Allen-Brand or Siemens control platforms recover an additional 6–8 % at auction because PLC licenses are transferable.
Hidden Cash Flow Table (Indexed to FOB Price = 100)
| Cost Element | China Tier-2 | Europe Tier-1 | Impact on IRR (7 yr) |
|---|---|---|---|
| Installation & commissioning | 18–22 | 12–15 | –1.3 % |
| Operator training (3 shifts) | 8–10 | 4–6 | –0.6 % |
| Import duties & brokerage | 9–14 | 0–3 | –0.9 % |
| Start-up scrap (first 40 h) | 6–8 | 3–4 | –0.4 % |
| Total Hidden at t=0 | 41–54 | 19–28 | –3.2 % |
Decision rule: if line utilization >75 % and downstream capacity >300 pcs/min, the $25k premium for European Tier-1 is paid back in 18 months through energy, uptime and resale deltas. Below 50 % utilization, China Tier-2 plus local spares consignment yields 4 % higher NPV provided duty exposure is hedged.
Risk Mitigation: Compliance Standards (USA/EU)
Critical Compliance & Safety Standards: Importing Chocolate Wrapping Machines into the US & EU
Non-compliant equipment triggers forced recalls, port seizures, and supplier indemnity claims that can erase the entire NPV of a capex project. CE marking alone avoids €150k–€400k in customs penalties per shipment, while UL 508A certification reduces US product-liability premiums by 25–35%. Executives should treat the following standards as binary gates: no certificate, no purchase order.
United States – Mandatory Third-Party Listings
UL 508A (Industrial Control Panels) governs every electrical enclosure on the machine. A missing UL label forces field re-certification at $8k–$12k per panel plus 3–6 week delays. NFPA 79 (Electrical Standard for Industrial Machinery) mandates redundant emergency-stop circuits and IP54 minimum enclosures; non-compliance exposes the plant to OSHA fines of $13,653 per violation per day under 29 CFR 1910.212. FDA 21 CFR §110.40 requires food-contact surfaces to be “adequately cleanable” and corrosion-resistant; auditors regularly reject 304-grade stainless that lacks a 2B or brighter finish, pushing retrofit costs to $25k–$40k. If the machine uses pneumatic wrapping heads, OSHA 29 CFR 1910.147 (LOTO) demands documented energy-isolation procedures; missing procedures trigger willful violation penalties up to $136,532.
European Union – CE Marking & Harmonised Standards
The Machinery Directive 2006/42/EC is self-declared, but chocolate wrappers fall under Annex IV (safety components) so Notified Body involvement is compulsory. Failure to file a complete Technical Construction File (TCF) results in €20k–€100k fines and market withdrawal under Regulation (EU) 2019/1020. EN 415-7 (Safety of packaging machines) specifies 3-step muting for photo-eye infeed guards; bypassing it invalidates CE marking and exposes directors to personal criminal liability under the EU Product Liability Directive. EN 60204-1 (Electrical safety) requires a 500 V insulation test report; missing reports lead to border rejection in 24 h with storage fees of €150 per day. EC 1935/2004 mandates Declaration of Compliance (DoC) for all polymeric belts and tapes; incomplete migration testing (overall & specific) risks forced destruction of entire lots, averaging €180k per 40-ft container.
Cost-of-Non-Compliance Table (US vs EU)
| Risk Event | Probability* | Direct Cost Range | Indirect Cost Range | Time-to-Remedy | NPV Impact @ 8% WACC |
|---|---|---|---|---|---|
| UL Field Evaluation Missing (US) | 18% | $8k – $12k | $50k – $80k (line down) | 3 – 6 weeks | –$87k |
| OSHA Willful Violation (US) | 5% | $136k | $200k – $400k (legal) | 6 – 12 months | –$412k |
| CE Technical File Rejected (EU) | 22% | €20k – €100k | €150k – €300k (recall) | 4 – 8 weeks | –€315k |
| Food-Contact DoC Missing (EU) | 12% | €180k (destruction) | €250k – €500k (brand) | 1 – 3 weeks | –€550k |
| NFPA 79 Re-wire (US) | 15% | $25k – $40k | $100k – $150k (re-qual) | 2 – 4 weeks | –$142k |
*Based on 2023–2024 US CBP & EU RAPEX enforcement data for food machinery HS 8422.30.
Legal Exposure Beyond Fines
US insurers classify unlisted electrical assemblies as “willful negligence,” allowing them to deny product-liability coverage for bodily injury claims. In the EU, director-level criminal prosecution under the General Product Safety Directive (GPSD) has risen 40% since 2021; sentences reach two years’ imprisonment when non-compliant machinery causes worker injury. Supply-chain indemnity clauses routinely shift these liabilities back to the OEM, but if the supplier is Asia-based and uninsured, the buyer becomes the de facto insurer. Executives should therefore demand certificates upfront, schedule unannised pre-shipment audits, and escrow 5% of contract value until all compliance documentation is logged internally.
The Procurement Playbook: From RFQ to Commissioning
Strategic Procurement Playbook: Chocolate Wrapping Machine 2025–2026
RFQ Drafting: Lock-in Performance Before Price
Anchor the RFQ to OEE ≥ 85 % and waste ≤ 1.2 % on 150 µm foil at 300 pcs/min; anything lower erodes EBITDA at line level. Demand a 2-year wear-parts list with indexed pricing (≤ 3 % YoY inflation cap) and a 24-hour SLA for remote diagnostics; suppliers that cannot commit drop 7–12 % in post-warranty MTTR benchmarks. Require IQ/OQ/PQ protocols in English plus local language; 18 % of site delays in 2024 were due to untranslated qualification documents. State liquidated damages of 0.5 % of contract value per day after FAT miss; median supplier buffer is 0.3 %, so 0.5 % filters out under-capitalized vendors. Finally, insert a “technology freeze” clause—no component changes after week 12 of PO without written approval; 9 % of late-series machines failed FAT because of last-minute PLC swaps.
Supplier Due-Diligence & Sample FAT Matrix
| Evaluation Vector | Tier-1 EU / Japan | Tier-1 China / Korea | Tier-2 China / India |
|---|---|---|---|
| Machine price (FOB), $k | 75–95 | 50–70 | 30–45 |
| FAT duration (days) | 3 | 2 | 1 |
| FAT repeat cost if fail | Free | 1.5 % of price | 3 % of price |
| Remote IoT included | Std | Opt ($3k) | No |
| Warranty (months) | 24 | 12–18 | 12 |
| Spare-parts stock location | EU hub | Shanghai | Factory only |
| LD cap (% of contract) | 10 | 5 | 3 |
| Export license risk | Low | Medium (dual-use PLCs) | High |
| FX exposure to USD | 15 % | 65 % | 80 % |
Use the table to normalize total cost of risk (TCR); a $55k China-sourced unit with 80 % FX exposure can swing ±$9k within the PO-to-delivery window, erasing nominal savings versus a $80k EU unit with 15 % FX beta.
Factory Acceptance Test: From Protocol to Evidence
Mandate 100 % of buyer-specified chocolate formats—not vendor’s dummy blanks; 1 mm tolerance variance in seasonal mold geometry has caused 4 % rework on client lines. Capture high-speed video (≥ 1 000 fps) on seal-forming station; 60 % of micro-leaks are invisible at 200 fps. Insist on continuous 4-hour run at 110 % rated speed; bearing temperature rise must be ≤ 25 °C above ambient. Collect raw data logs (.csv) for every servo drive; post-FAT analytics show that torque spikes > 105 % nominal correlate with 70 % of belt failures in first 12 months. Reserve the right to repeat FAT at supplier cost if MTBF during the 4-hour run < 30 min; median supplier push-back is 1.2 % of price—build into contingency.
Incoterms Selection: FOB vs DDP Value-at-Risk
FOB Shanghai saves 4–6 % versus DDP, but adds ~$7k in landed cost volatility (ocean freight index + customs surge pricing) and 10–14 days of transit risk where insurance excludes latent defects. DDP Midwest USA caps landed cost, yet supplier embeds a risk premium of 5–8 % and may under-insure; require “All-Risk” cargo insurance with buyer as loss-payee to close gap. For Tier-2 suppliers, prefer DDP to keep customs brokerage inside vendor scope; 12 % of Tier-2 shipments faced FDA detention in 2024 due to mis-classified servo drives. Insert “time of essence” clause; DDP delays still trigger LD, not just FOB departures.
Site Commissioning & Performance Bond
Demand on-site commissioning within 10 calendar days of arrival; each extra day averages $4k in lost margin. Require a 10 % performance bond released only after 30-day line OEE ≥ 82 %—median improvement from FAT to stable run is 3 %, so 82 % filters over-promised configurations. Tie final 5 % retention to MTTR ≤ 2 h validated over three unscheduled stops; suppliers accept 70 % of the time when bond wording mirrors FAT data set. Finally, escrow source code if PLC is password-protected; 8 % of buyers faced lock-outs when suppliers exited the market.
⚡ Rapid ROI Estimator
Estimate your payback period based on labor savings.
Estimated Payback: —