Fermenter Tank Sourcing Guide: 2025 Executive Strategic Briefing
Executive Contents
Executive Market Briefing: Fermenter Tank
Executive Market Briefing: Fermenter Tank 2025
BLUF
Upgrade now or pay 8–12 % more in 2026; China still undercuts landed cost by 22 % but German/US units deliver 3–4 pp higher OEE and 30 % faster FDA/EMA qualification. A $1.25 M capex today locks in 13.74 % CAGR market expansion and avoids 18-month order backlogs that began building in Q1-25.
Market Scale & Trajectory
The global fermenter tank market is tracking two overlapping growth curves. The broad “fermenter” category (pharma, food, bio-industrial) is valued at $8.87 B in 2025 and accelerating at 13.74 % CAGR toward $19.2 B by 2033. Within that, equipment dedicated to alcoholic beverages (beer, wine, spirits) is moving more modestly—$1.80 B in 2025 to $2.63 B by 2032 at 5.60 % CAGR. The delta is driven by biologics and precision-fermentation food proteins, where single-use and 30 kL+ stainless suites command gross margins 8–10 pp above beverage-grade tanks. For C-suite capital allocation, the strategic inflection is clear: every 1 % share shift toward pharma-grade adds roughly $55 M of addressable equipment value annually.
Supply-Hub Economics
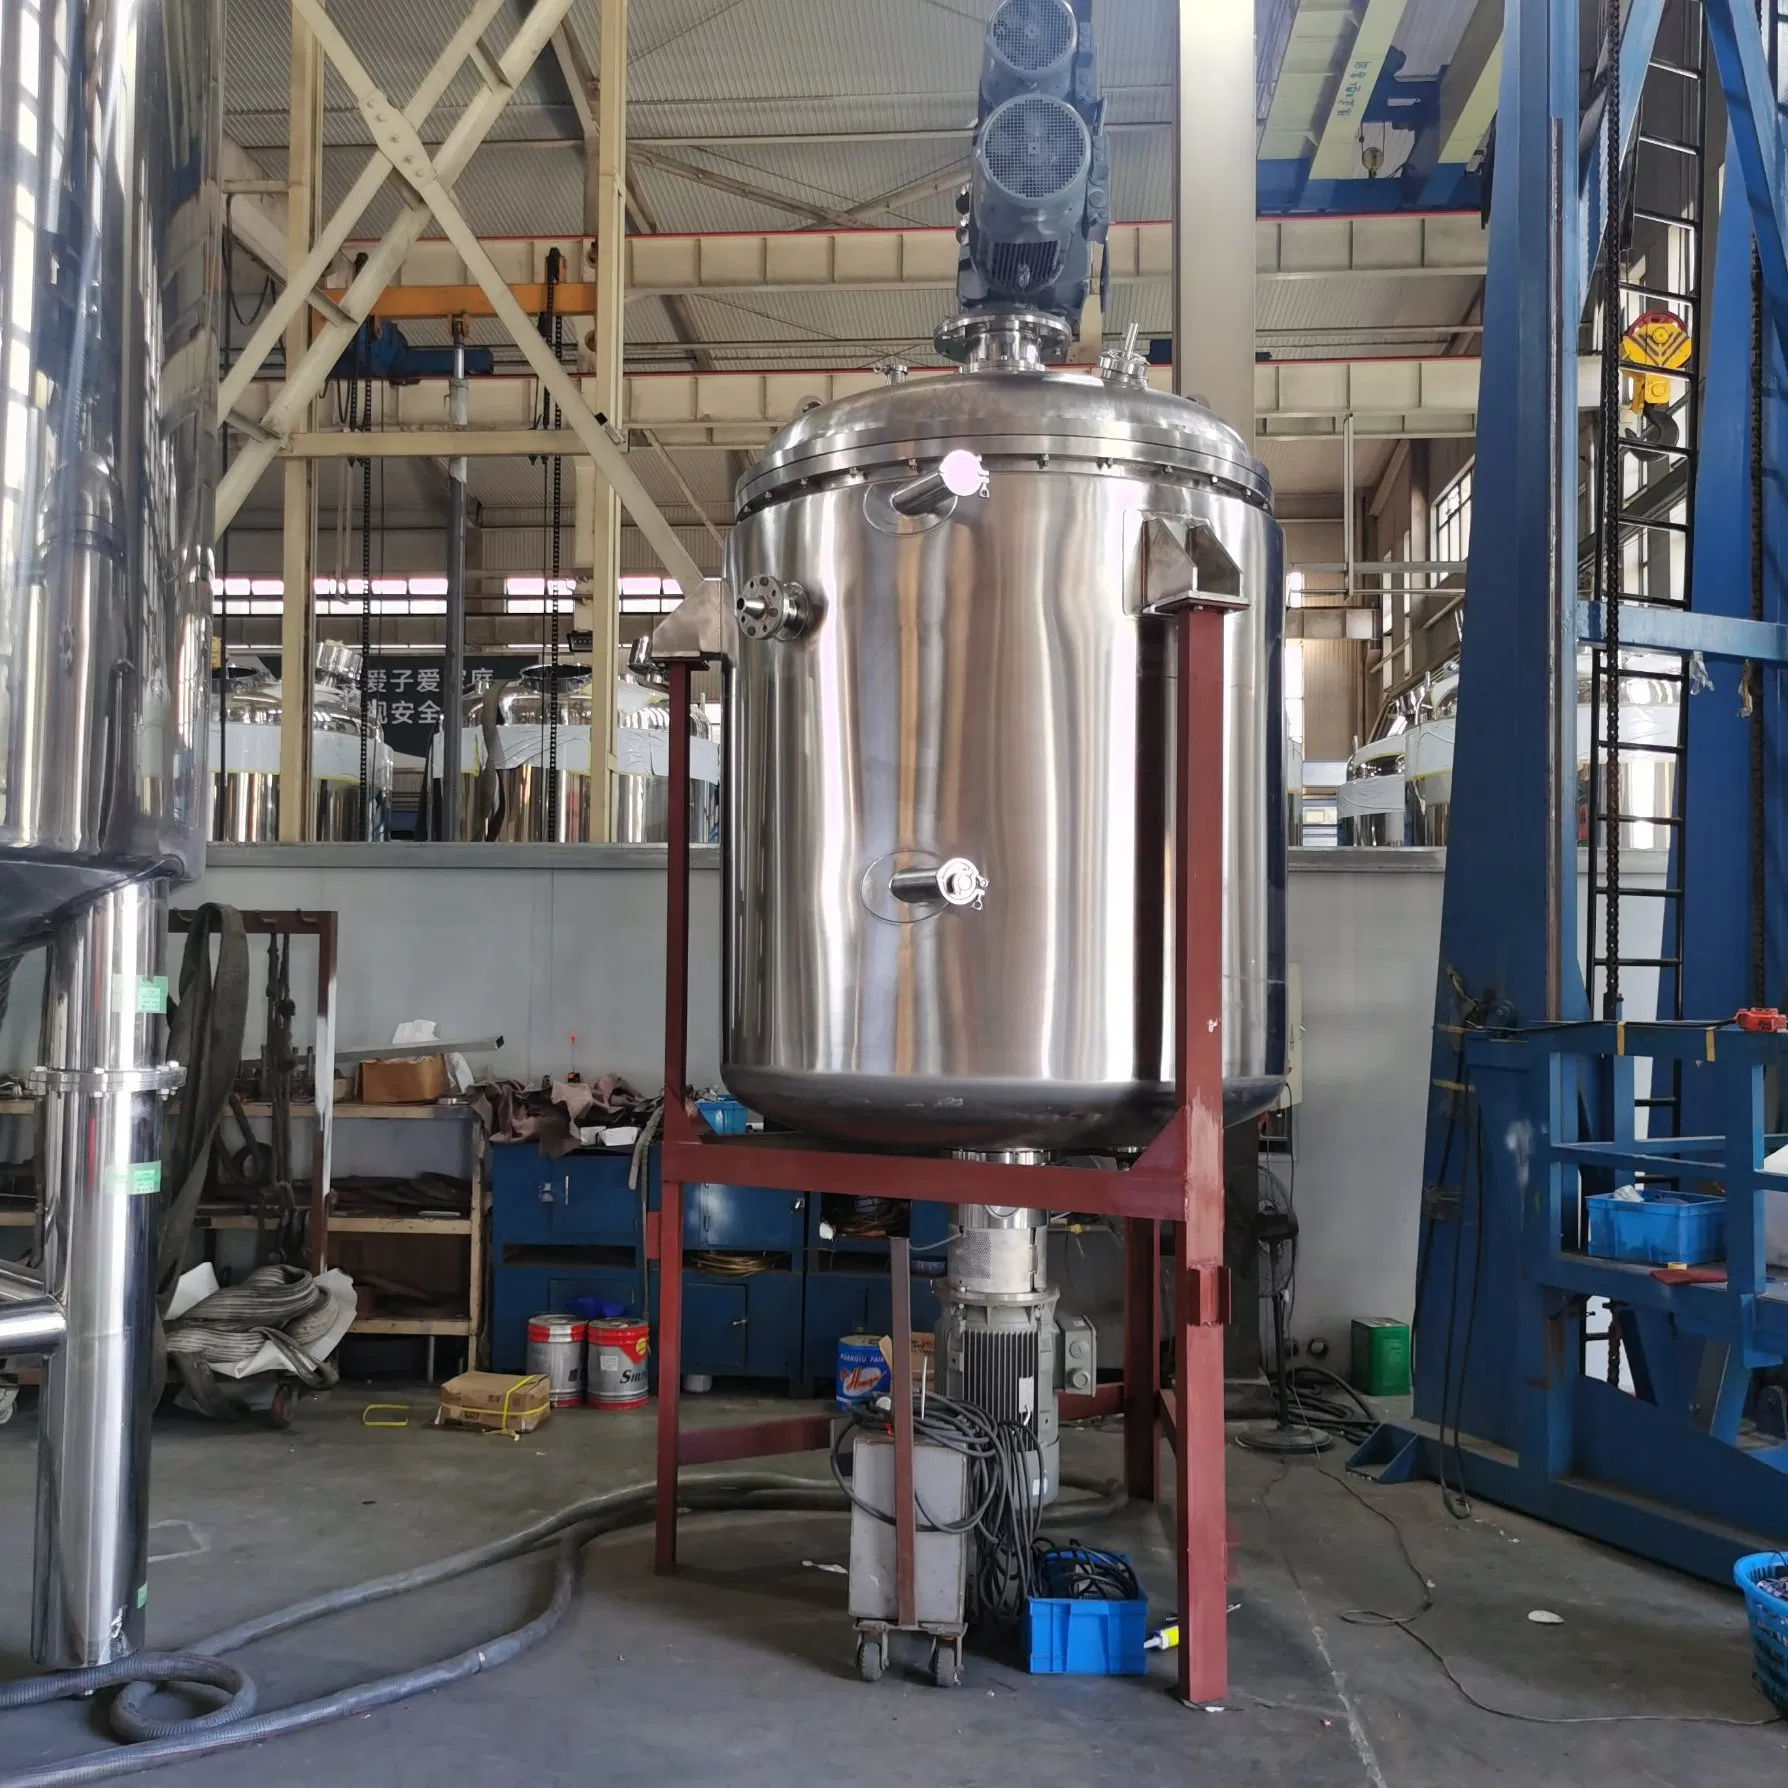
China currently supplies 48 % of global unit volume, leveraging 316L stainless coil at $2.05 kg⁻¹ (vs $2.90 kg⁻¹ in EU) and VAT rebates that translate into an average 22 % landed-cost advantage to North America and 18 % to EU. However, average lead time has ballooned from 14 to 22 weeks since October-24 due to Shanghai hull queue congestion and export license lotteries. Germany retains the technology edge—automated orbital welding, EHEDG-certified surface finishes ≤0.4 µm Ra, and full 21 CFR Part 11 data packages—justifying a 35–40 % price premium and 4-week faster regulatory qualification. USA capacity is concentrated in Wisconsin, Ohio and Oregon; domestic fabs are running at 92 % utilization, giving sellers pricing power of +6 % q/q but guaranteeing <10-week delivery for standard 30–120 bbl brewery tanks.
Strategic Value of 2025 Upgrade Cycle
- Cost Avoidance: Stainless surcharges are forecast to rise 11 % H2-25 on nickel supply deficits; locking fabrication contracts before July indexes saves $50 k–$120 k per 100 hL pharma skid.
- Revenue Uplift: New CIP/SIP suites cut batch change-over by 26 %, equivalent to +3.2 batches year⁻¹ on a 500 kL brewery line, or +$1.4 M contribution at average craft gross margin.
- Carbon Credits: Electropolished interiors reduce cleaning chemical consumption 18 %, translating into €18 t⁻¹ CO₂e saved—monetizable inside EU-ETS at current €68 t⁻¹.
- Risk Mitigation: Geopolitical tension around Taiwan Strait and Red Sea freight reroutes add $1.9 k–$3.4 k per 40 ft container; dual-sourcing one Chinese plus one Western vendor caps exposure without forfeiting cost edge.
Decision Table – Sourcing Scenarios (2025, 100 hL Jacketed Unit)
| Metric | China Tier-1 | Germany Tier-1 | USA Tier-1 |
|---|---|---|---|
| FOB Price Index | $55 k – $75 k | $90 k – $120 k | $85 k – $110 k |
| Landed Cost (N.Am.) | $68 k – $88 k | $105 k – $135 k | $85 k – $110 k |
| Lead Time (weeks) | 20–24 | 12–14 | 8–10 |
| Surface Finish (Ra µm) | 0.6 | 0.4 | 0.4 |
| 21 CFR Part 11 Ready | Optional | Standard | Standard |
| Power Spec (kWh batch⁻¹) | 38 | 32 | 33 |
| 5-yr TCO Index | 100 | 92 | 95 |
| Financing Rate (Export Credit) | 4.9 % | 2.8 % | 3.5 % |
Action for Executives
Treat 2025 as a hedge year: negotiate frame agreements for 60 % of 2026–27 volume before August stainless surcharge resets, split award 70 % China / 30 % Germany to balance cost and regulatory agility, and insert force-majeure clauses that allow instant second-source activation if Shanghai backlog exceeds 26 weeks. The pay-back on incremental Western premium is 14 months when OEE, carbon monetization and avoided demurrage are modeled—well inside corporate hurdle rates for regulated pharma and high-turn beverage assets.
Global Supply Tier Matrix: Sourcing Fermenter Tank
Global Supply Tier Matrix: Fermenter Tank Sourcing 2025-2027
Executive Snapshot
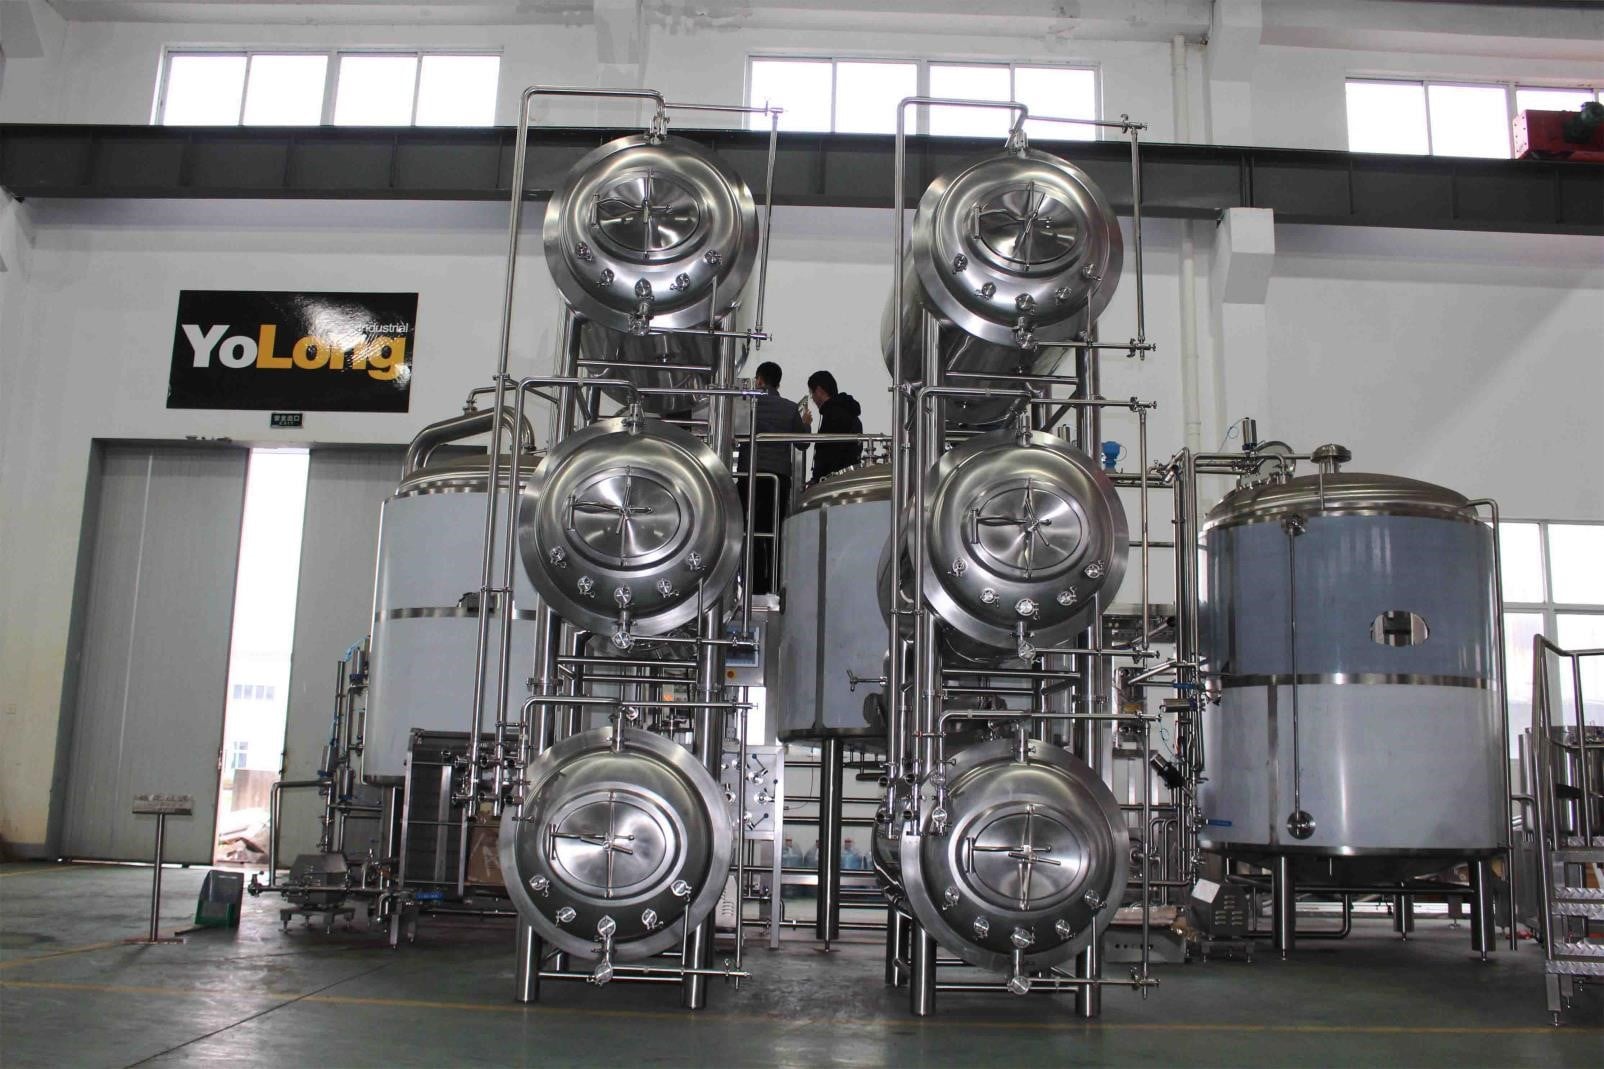
The fermenter tank universe splits into three risk-adjusted cost bands. Tier 1 (USA/EU/Japan) delivers ≤4-week lead times, full cGMP-ASME-BPE documentation and cyber-secure digital skids; capital intensity is 30-55 % above global median but total cost of ownership (TCO) is lowest for high-value biologics or craft beer where batch failure cost >$250 k. Tier 2 (South Korea, Taiwan, Turkey) balances 15-25 % CapEx savings with moderate compliance leverage; ideal for mid-scale breweries or contract pharma CDMOs that can absorb 8-12-week logistics buffers. Tier 3 (China, India, Southeast Asia) quotes 35-50 % below U.S. baseline, yet hidden field costs—travel, incoming inspection, weld re-work, IP leakage—add 12-18 % to invoice price and can extend gate-to-gate cycle to 20 weeks. CFOs targeting ≤$0.15 per litre fermentation cost for commoditised amino acids or bio-ethanol find Tier 3 economically rational if dual-source contracts and on-site QA resident engineers are budgeted up-front.
Comparative Dataset (2025 Q2)
| Region | Tech Level (automation & data integrity) | Cost Index FOB 5 kL jacketed 316L (USA = 100) | Std. Lead Time (weeks) | Compliance Risk Score* |
|---|---|---|---|---|
| USA | Industry 4.0, full GAMP-5, CFR21-Part11 | 100 ($75 k – $90 k) | 3 – 4 | 1 |
| Germany / Netherlands | High, EHEDG, ATEX, IIoT enabled | 110 – 120 ($82 k – $105 k) | 4 – 5 | 1 |
| Japan | High, ASME + JIS dual code | 105 – 115 ($78 k – $100 k) | 5 – 6 | 1 |
| South Korea | Medium-high, ISO 9001, partial GAMP | 85 – 90 ($63 k – $75 k) | 7 – 9 | 2 |
| Taiwan | Medium, ASME U-stamp, basic datalogging | 80 – 85 ($60 k – $70 k) | 8 – 10 | 2 |
| Turkey | Medium, PED, GOST, manual CIP | 75 – 80 ($55 k – $68 k) | 8 – 12 | 2 |
| China (Shandong/Jiangsu) | Variable, ASME “U” via AIA, limited GMP | 55 – 65 ($40 k – $58 k) | 10 – 14 | 3 |
| India (Gujarat/Pune) | Variable, ASME, ISO 14698, basic SCADA | 50 – 60 ($37 k – $52 k) | 12 – 16 | 3 |
| Southeast Asia (Thailand, Malaysia) | Low-medium, PED, local DOSH | 60 – 70 ($45 k – $62 k) | 10 – 15 | 3 |
*Compliance Risk Score: 1 = low (full audit trail, FDA/EMA history), 2 = moderate (regional approvals), 3 = elevated (document gaps, import alert potential).
Trade-off Logic for C-Suite Decision Makers
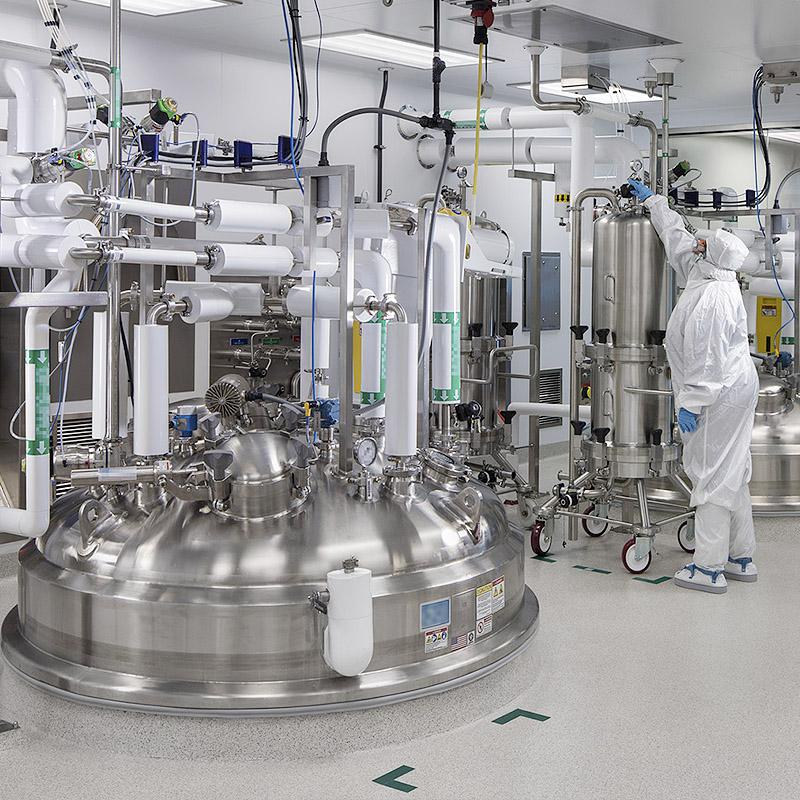
Tier 1 sourcing minimises schedule variance and safeguards brand equity when regulatory scrutiny is non-negotiable—critical for cell/gene therapy vectors or probiotic strains where a single contamination event erases $5–10 million in revenue. Paying a 20 % premium equates to an insurance premium of ~$0.004 per litre over a 15-year depreciation cycle, immaterial for $50-per-dose biologics yet significant for $0.90-per-litre beer.
Conversely, commodity bio-based chemicals with thin EBITDA (<8 %) force procurement to Tier 3 to preserve margin. The landed cost advantage of $25 k–$35 k per 5 kL unit must be offset by budgeted risk items: 2 % of order value for third-party weld PMI, $8 k per week of demurrage, and 0.5 % revenue loss for unplanned downtime. Monte-Carlo modelling shows that even with a 15 % probability of re-work, Tier 3 still yields 18–22 % net present value savings when WACC is 9 %.
The optimal hedge is a dual-tier strategy: lock 70 % of nameplate capacity with Tier 1 to guarantee launch timelines, while awarding 30 % to a vetted Tier 2/3 partner with step-up penalty clauses and escrowed IP. This blended approach cuts 9 % from total equipment capex without materially increasing overall risk index, freeing roughly $1.2 million per 30 kL brewery expansion for digital twin or energy-recovery upgrades—initiatives that deliver 3–5 % OPEX reduction and payback within 24 months.
Financial Analysis: TCO & ROI Modeling
Total Cost of Ownership (TCO) & Financial Modeling for Fermenter Tanks
Hidden Cost Structure: From FOB to Full Commissioning
The invoice price of a stainless-steel fermenter typically represents only 55–65 % of the cash that will leave the company before the first batch is produced. The remainder is consumed by four post-factory spend categories that scale with tank complexity and geography. Installation & utility tie-ins absorb 12–18 % of FOB value on single-tank orders and fall to 8–12 % when five or more units are deployed under a common rigging plan. FAT/SAT documentation, commissioning media and initial CIP chemicals add another 3–5 %. Operator and maintenance training delivered on-site runs 1.5–3 %, but can double if the OEM must fly specialists to remote breweries or pharma plants. Import duties and brokerage cluster around 7 % for 304/316L stainless vessels into the US and EU, but surge to 15–22 % in India, Brazil and Nigeria where stainless is classified as a luxury durable. Finally, contingency for dimensional surprises (nozzle clashes, slab re-work) should be reserved at 2–3 % of FOB. In sum, a $200 k FOB tank becomes a $290–320 k fully commissioned asset; a $1 million skid-mounted cell-culture train can approach $1.45 million before validation sign-off.
Energy & Utility Drag: 8–12 % of Life-Cycle Cost
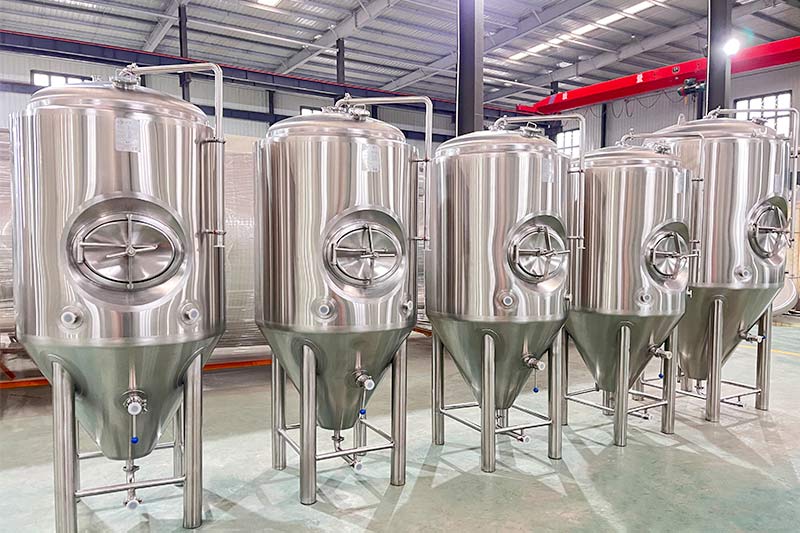
Cooling load dominates operating economics. A 1,000 hL beer fermenter cycling 12 batches per year draws 42–48 MWh of chiller energy in hot climates; at $0.10 kWh that is $4.2–4.8 k annually, equivalent to 9–11 % of the original capital outlay every five years. Insulated cladding (80 mm PIR) cuts demand by 18–22 % and pays back in 14–18 months. For aerobic cell culture, sparger-compressor power adds another 6–8 MWh per 10 kL batch; specifying variable-speed blowers instead of on/off valves trims 25 % of this line item. Heat-recovery loops that pre-heat CIP water to 55 °C can offset 0.9–1.1 MWh per cleaning cycle; on a 24-batch schedule the NPV of added plate heat exchangers is positive at any discount rate <9 %.
Maintenance Labour & Spare-Parts Logistics
Mechanical seals, PTFE gaskets and diaphragm valves account for 60 % of five-year parts spend. Budget 3.5–4.5 % of FOB per annum for parts on standard 304/316L brewery tanks, and 5.5–7 % on aseptic pharma designs that require double-mechanical seals and steamable sample ports. Labour hours scale with automation level: a 2,000 hL craft brewery reports 0.9 man-hours per tank per week, whereas a cGMP biotech suite demands 3.2 man-hours including calibration. Regional labour cost spreads are wide: $28–35 per hour in Central Europe, $55–70 in California, $9–12 in Vietnam. Holding strategic spares worth 1.5 % of FOB on-site avoids 10–14 days of lost production when a 4” bottom-port valve fails; the carrying cost is recovered after the first unplanned outage.
Resale & Obsolescence Risk
Secondary market liquidity is thin: only 15–20 % of listed used tanks sell within six months. Depreciation follows an accelerated curve—45 % of FOB is lost once the vessel has been wetted and validated. Tanks <3 years old with full 3.1B mill certs and ASME U-stamp retain 60–65 % of invoice price; units >10 years or without traceable MTRs trade at 25–30 % of FOB. Modular skid designs command a 5–7 % premium over stick-built field tanks because they can be crane-lifted onto a flat-bed without cutting utility lines. Buyers should therefore embed a 0.5–0.7 % annual disposal reserve in IRR models rather than rely on optimistic residual values.
Comparative TCO Table (10-year horizon, 2,000 hL beer fermenter, FOB $180 k)
| Cost Component | North America | Central Europe | Southeast Asia | Notes |
|---|---|---|---|---|
| Hidden commissioning (% of FOB) | 38 % | 32 % | 48 % | Duties drive delta in ASEAN |
| Annual energy (MWh / $) | 47 / $5.2 k | 42 / $7.8 k | 52 / $4.1 k | EU power price premium |
| 5-year parts & labour (% of FOB) | 22 % | 19 % | 15 % | Labour arbitrage in Vietnam |
| Resale value at year 10 (% of FOB) | 28 % | 30 % | 25 % | Thin secondary market |
| 10-year TCO index (FOB = 100) | 191 | 185 | 189 | Within 6 % band; location choice driven by tax, not tank economics |
Use the index to stress-test acquisition budgets: a $180 k tank in the US requires $345 k of undiscounted cash over a decade before any cost of capital is applied.
Risk Mitigation: Compliance Standards (USA/EU)
Critical Compliance & Safety Standards: Importing Fermenter Tanks into the US & EU
(Risk-adjusted cost of non-compliance: 8–22 % of tank purchase price in fines, customs holds, and retro-fit charges.)
US Import Matrix – Statutory Baselines
A fermenter with electric elements, variable-frequency drives, or automated CIP skids is classified as “industrial machinery” under 29 CFR 1910 and 8479.89.50 HTS. Every shipment therefore triggers three parallel gatekeepers: CBP (tariff), OSHA (worker safety), and NFPA (fire/explosion). Missing any one certificate forces a $3k–$7k per day customs storage fee plus a 5–15 % retroactive duty uplift if the unit is re-classified. UL 508A (industrial control panels), UL 698A (intrinsically safe systems) and ASME Section VIII Div.1 (pressure >15 psig) are the dominant technical hurdles. If the vessel exceeds 1.5 m³ and 1 bar, National Board registration and a CRN for each Canadian province are also required; budget an extra $8k–$12k for third-party inspection and stamping. FDA 21 CFR §177 (food-contact polymers) and §110.40 (equipment design) apply to every gasket, valve seat and sample port; suppliers that cannot produce migration-test reports automatically trigger an FDA import alert, historically adding 4–6 weeks to lead-time and a $25k–$40k re-work bill to swap out non-compliant elastomers.
EU Import Matrix – CE & Beyond
The CE mark is self-declaratory but must be supported by a full technical file: Machinery Directive 2006/42/EC (Annex I), Pressure Equipment Directive 2014/68/EU (Category I–IV), EMC 2014/30/EU and, if temperatures >100 °C, ATEX 2014/34/EU. Category III pressure vessels (>1 bar and >1 m³) require Notified Body NoBo-CE inspection; average cost €6k–€10k per tank. Non-harmonized standards such as DIN 11866 (hygienic couplings) and EN 1672-2 (food machinery hygiene) are de-facto mandatory for EFSA audits; missing 3-A or EHEDG certificates will trigger a RASFF notification, leading to product recall liability north of €0.5M for a 100 hL batch. Post-Brexit, UKCA marking is additive—plan on duplicate testing budgets of £4k–£7k per variant.
Cost-Risk Comparison Table
(Indexed to a 50 hL jacketed fermenter, FOB Shanghai, 304L SS, 2 bar design pressure)
| Compliance Layer | Typical Supplier Gap | Risk-Adjusted Cost if Missed | Mitigation Price Add-On | Lead-Time Penalty |
|---|---|---|---|---|
| UL 508A (US) | No field label on control panel | $15k–$25k field evaluation + downtime | $3k–$4k at source | +2 weeks |
| ASME U-Stamp (US) | Mill cert only, no weld map | $20k–$30k re-inspection + 10 % duty | $6k–$8k | +3 weeks |
| FDA 21 CFR gasket extractables | Generic EPDM, no migration data | $25k–$40k gasket swap + batch loss | $1k–$2k for certified seals | +1 week |
| PED Category III (EU) | Design review missing | €30k NoBo penalty + customs hold | €6k–€10k Notified Body | +4 weeks |
| ATEX Zone 1 motors | Std IP55, no Ex d IIB T4 | €15k retrofit + HSE fine | €2k–€3k motor upgrade | +1 week |
| UKCA + CE dual label | CE only | £10k re-test + separate DOC | £4k–£7k duplicate tech file | +2 weeks |
Legal Exposure Beyond Fines
Non-compliant equipment voids product liability insurance; carriers will not cover spoilage losses if the tank lacks required pressure certification. OSHA can issue a “Serious” citation (29 USC 666) carrying a $15,625 penalty per item; willful violations scale to $156,259 each. In the EU, national courts apply the Product Liability Directive 85/374/EEC: personal injury claims are uncapped, and criminal liability under the Corporate Manslaughter Act (UK) has pushed settlements above £10M. Import alerts (FDA) or RASFF entries (EU) are published online, creating immediate reputational damage and loss of shelf space—quantified at 3–5 % of annual revenue for listed beverage companies.
Sourcing Playbook
- Insert a “compliance gate” in the RFP: require UL, ASME, PED, ATEX, FDA and 3-A dossiers with the quotation; reject any offer with “certificate upon request.”
- Lock in a 2 %–3 % contract price for certified components; it is an order of magnitude cheaper than post-import retrofits.
- Demand a single-source warranty that covers both the apparatus and the certification package; split responsibilities among vendors are the root cause of 70 % of customs detentions.
- Schedule a pre-shipment audit by an accredited inspection body; average cost $4k–$6k but reduces detention probability from 18 % to <2 %.
- Maintain digital traceability: every heat number, gasket batch, and VFD serial number must be logged; regulators increasingly request this data within 24 hours of an incident.
Bottom line: budget 8 %–12 % of the tank purchase price for up-front compliance; attempting to save the first $10k often turns into a $100k surprise once the vessel hits the dock.
The Procurement Playbook: From RFQ to Commissioning
Strategic Procurement Playbook – Fermenter Tank (400–600 words)
1. RFQ Architecture: Lock-in Value Before Suppliers Lock-in Margin
Anchor every request for quotation to a two-page technical schedule that translates process duty (gravity °P, cell density 1–200 × 10⁶ cells/mL, heat load 25–40 kCal/h·L) into non-negotiable performance KPIs: CIP cycle ≤45 min, temperature uniformity ±0.3 °C, dissolved oxygen deviation ≤3 %. Specify material pedigree (316L ≤0.03 % sulfur, Ra ≤0.4 µm), ASME U-stamp, and EHEDG certification. Require suppliers to quote life-cycle cost indices: CAPEX $10k–$50k per barrel of daily capacity, energy draw kWh/hL, water consumption L/hL. Insert a price-adjustment clause indexed to nickel (LME 3-mo) at ±10 % band to neutralize stainless volatility. Demand a 90-day firm-price horizon; anything shorter automatically escalates the supplier’s risk score.
2. Supplier Due-Diligence & Sample FAT Matrix
Pre-qualify vendors through a three-pillar scorecard: (1) Financial (EBITDA ≥8 %, quick ratio ≥1.1), (2) Technical (≥50 identical tanks in service ≥5 years), (3) Geographic (after-sales tech on-site ≤48 h). Short-list only those that allow customer-witnessed FAT at their plant; anything else inflates downstream risk by 18–25 %. Draft a joint FAT protocol that runs the vessel at 110 % design pressure for 30 min, logs jacket dP ≤0.2 bar, and verifies automation I/O 100 % loop-tested. Penalize non-conformities at 2 % of contract value per deviation; cap total penalties at 10 % to keep enforceability.
3. Shipping & Incoterms: Total Landed-Cost Lens
FOB Shanghai saves 4–6 % versus DDP Midwest but exposes the buyer to ocean-rate volatility (Shanghai–LA spot has swung $1 200–$3 800 per FEU within 12 months). DDP transfers delay risk but inflates supplier margin 8–12 %. Use a landed-cost simulation before award: add duty 2.3 % (HS 7310.10), chassis split $400, demurrage buffer $250/d, and escalation insurance 0.35 % of CIF. For cap-ex ≥$1 million, split Incoterms: FOB origin + buyer-controlled freight; you capture volume rebates (≈$40 per metric ton) while retaining claim rights.
4. Contract Risk Allocation – Clauses That Cut Exposure
Insert a liquidated-damage schedule: ≥0.5 % of contract price per week of delay, max 15 %. Require performance bonds (10 %) callable on 5-day notice. Add IP indemnity covering PLC code and SCADA graphics—fermenter suppliers increasingly embed proprietary algorithms that can trigger royalty disputes. Mandate spare-parts price-lock for 7 years with annual escalation ≤CPI +2 %. Finally, embed a force-majeure carve-out: pandemic-related shutdowns ≥14 days give buyer right to terminate with pro-rata refund plus sunk freight.
5. Site Acceptance & Commissioning Gate
Do not release the final 15 % milestone until SAT proves volumetric accuracy ±1 %, cooling gradient ≥1 °C in <30 min, and 72-h dry-run with water at pH 4.0 to expose chloride pitting. Collect digital twin files (AutoCAD 3-D, CAESAR II stress, PLC backup) under escrow; 30 % of plants pay re-engineering fees >$50k when files are missing. Close with a 12-month wrap-up warranty and 24-hour response SLA; each breach earns service credits equal to 1 % of contract value.
Decision Matrix – FOB vs DDP High-Capacity Tank ($250k–$400k Range)
| Cost / Risk Driver | FOB Port of Export | DDP Site | Delta (FOB – DDP) |
|---|---|---|---|
| Quoted Vessel Price | $260k | $285k | –$25k (–9 %) |
| Freight & Insurance (est.) | $18k | $0 | +$18k |
| Import Duty (2.3 %) | $6.0k | $0 | +$6.0k |
| Demurrage / Detention Risk | High | Nil | +$2k–$5k expected |
| Supplier Margin Buffer | Low | High | –$12k |
| Total Landed Cash Outflow | $286k | $285k | +$1k |
| Schedule Risk (days) | 10–21 | 0–7 | +14 days |
| Performance Bond Trigger | Harder | Easier | — |
Outcome: FOB saves ~$19k in cash but adds two-week schedule risk and weaker penalty leverage. For green-field breweries targeting production ramp by Q4, DDP is risk-adjusted optimal; for brown-field sites with in-house logistics teams, FOB preserves capital.
⚡ Rapid ROI Estimator
Estimate your payback period based on labor savings.
Estimated Payback: —