Ffs Machine Sourcing Guide: 2025 Executive Strategic Briefing
Executive Contents
Executive Market Briefing: Ffs Machine
Executive Market Briefing: Form-Fill-Seal Machines 2025
BLUF
Global FFS machine demand is expanding at a 5–7% CAGR toward a USD 10–11 billion 2025 market; capacity is geographically concentrated (China 48%, Germany 18%, USA 12% of unit output). Upgrading now locks in 8–12% total cost-of-ownership savings before copper, steel and labor inflation fully reset 2026 list prices.
Market Scale & Trajectory
Consolidated sell-side data place the 2025 form-fill-seal equipment market between USD 10.0 billion and USD 10.2 billion, up from USD 8.7–9.7 billion in 2024. Median consensus CAGR for 2025-2030 is 6.1%, with vertical FFS (VFFS) sub-segment outpacing horizontal (HFFS) by ~150 bps because of e-commerce pouch demand. Replacement demand already exceeds 60% of annual orders in North America and the EU; China is still >50% green-field but is forecast to flip to replacement-dominant by 2027. Accelerating SKU proliferation and recyclable mono-material films are shortening amortization schedules to <5 years, making technical obsolescence a bigger risk than mechanical wear.
Supply-Hub Competitiveness
China ships 48% of global unit volume and 38% of export value thanks to a broad 30–300 ppm speed portfolio priced 25–35% below Western equivalents. Local component commonality (PLCs, servo drives) with packaging lines up- and downstream keeps integration cost low, but average warranty responsiveness is 2.4× slower than European OEMs. Germany retains the precision high-barrier segment—think 1,800+ ppm stick-pack or aseptic pharma—with 18% of units yet 29% of dollar sales; energy-efficient drives and 95% OEE guarantees justify the premium. USA output is only 12% of units but concentrates in USDA-dairy and medical clean-room configurations where liability exposure favors domestic support; lead times average 20–24 weeks versus 14–18 from Germany and 8–12 from China.
Strategic Value of 2025 Upgrade Cycle
- Input-cost hedge: Steel surcharges are already 11% above 2023 baselines; OEMs confirm 6–8% list-price lift slated for Q1-26.
- Energy arbitrage: New IE4 servo motors and regenerative braking cut kWh per 1,000 packages by 12–18%; at EUR 0.18/kWh this yields USD 55k–90k annual savings on a 120 ppm line.
- Film-thinning capability: Latest VFFS jaws handle 25 µm PE without seal wrinkle, enabling 8–10% material saving on the bill of film—worth USD 0.4–0.6 million yearly on a 250 M pouch program.
- Digital compliance: Upgraded IPCs embed OPC-UA and PackML, slashing customer factory acceptance time by 30% and future audit cost—critical with EU ESPR and US traceability deadlines both inside 24 months.
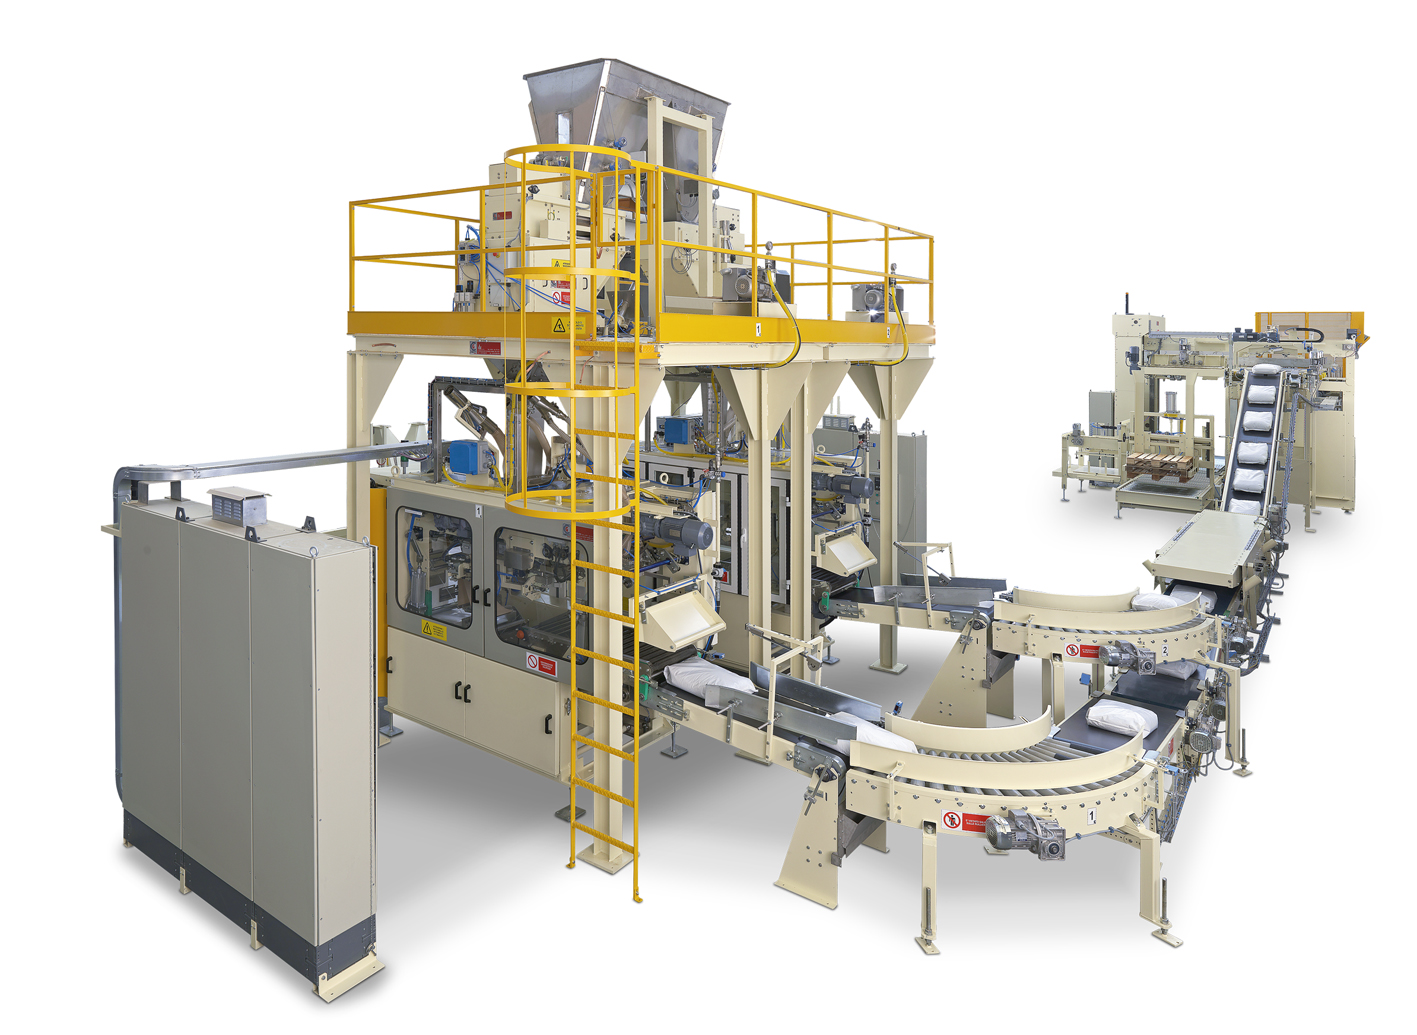
Decision Table: 2025 FFS Sourcing Options (mid-speed 80–150 ppm, dairy-grade)
| Metric | Tier-1 China Export | Tier-1 Germany | Tier-1 USA |
|---|---|---|---|
| FOB Price Range (USD) | $290k–$350k | $480k–$580k | $520k–$630k |
| Total Cost of Ownership (5-yr, USD) | $420k–$490k | $520k–$600k | $590k–$680k |
| Lead Time (weeks) | 10–14 | 18–22 | 20–24 |
| Energy Use (kWh/1,000 packs) | 6.8–7.2 | 5.4–5.9 | 5.9–6.4 |
| Warranty Uptime Guarantee | 92% | 95% | 96% |
| Spare-Parts Response SLA | 72h (Asia) | 24h (EU) | 12h (NA) |
| Retrofit/Upgrade Modules | Limited | Full | Full |
| Financing Rate (5-yr, %) | 5.9–6.4 | 4.1–4.6 | 4.3–4.8 |
Action Implications
Procurement windows that close after Q3-25 will face 6–8% price inflation and extended lead times as OEMs allocate slots to multi-year food & pharma framework contracts. Locking 2025 slots with dual sourcing—China for volume SKUs, Germany/USA for high-margin SKUs—secures both margin protection and regulatory agility while hedging FX exposure through natural currency baskets.
Global Supply Tier Matrix: Sourcing Ffs Machine
Global Supply Tier Matrix for FFS Machines – 2025 Lens
Executive Snapshot
The FFS market is expanding at 5–7 % CAGR, pushing installed value from ~USD 9 Bn (2024) to USD 17–18 Bn by 2030. Capacity additions are concentrated in Asia-Pacific (60 % of new orders) while C-suite mandates in North America and EU focus on de-risking single-source exposure and carbon-adjusted landed cost. The supplier landscape collapses into three performance tiers whose regional footprints determine CapEx, schedule certainty, and regulatory exposure more than brand logos do.
Tier Definition & Strategic Use
Tier 1 suppliers provide ISO 9001 + FDA/EMA-validated lines, >95 % OEE guarantee, global parts network, and full FAT/SAT documentation. Tier 2 vendors deliver CE or UL compliant machines with regional service hubs and 85–90 % OEE; options for 21 CFR Part 11 are project-specific. Tier 3 players offer baseline GMP builds, limited aftermarket, and 75–80 % OEE; cost leadership is the primary value. Portfolio strategy should reserve Tier 1 for blockbuster SKUs, Tier 2 for mid-volume regional packs, and Tier 3 for price-sensitive emerging-market SKUs.
Regional Trade-off Matrix (2025 Indices)
| Region | Tech Level | Cost Index (USA=100) | Lead Time (weeks) | Compliance Risk* |
|---|---|---|---|---|
| USA | Tier 1 | 100 | 18–22 | Very Low |
| Germany | Tier 1 | 98–105 | 20–24 | Very Low |
| Italy | Tier 1/2 | 85–92 | 16–20 | Low |
| China | Tier 2/3 | 55–65 | 12–16 | Med–High |
| India | Tier 2/3 | 50–60 | 14–18 | Med–High |
| S. Korea | Tier 2 | 70–78 | 14–18 | Low–Med |
| Brazil | Tier 3 | 75–82 | 20–26 | Med |
*Compliance Risk = probability of non-conformance to FDA/EMA, UL, or EU 2019/6 traceability standards within first 24 months.
CapEx vs. Risk Calibration
A vertical FFS line rated at 120 pouches/min carries a Tier-1 U.S. price envelope of USD 0.9–1.1 M all-in; comparable Chinese Tier-2 spec lands at USD 0.5–0.65 M before import duty and freight. The 35–45 % upfront delta must be discounted by: (i) 4–6 % import tariff + VAT, (ii) 1.5–2 % annual IP royalty escrow if patents are enforced, and (iii) 0.8–1.2 % cost of quality (COQ) driven by extra validation batches. Net present cost gap narrows to 18–25 % over five years, inside most companies’ 2 % revenue-at-risk tolerance for critical SKUs. CFOs can therefore treat China/India sourcing as a leveraged hedge only when dual-sourcing with a Tier-1 EU or U.S. partner is locked in for at least 40 % of volume—this satisfies continuity audits demanded by big-box retailers and FDA’s 21 CFR 117.80.
Lead-Time & Inventory Economics
Post-COVID, Tier-1 EU and U.S. factories run at 85–90 % slot utilization; any scope change pushes delivery by 4–6 weeks. Chinese Tier-2 OEMs still quote 12–14 weeks because component suppliers are co-located, yet geopolitical shipping spikes (Red Sea, Panama queue) can add 3–5 weeks unpredictably. Procurement teams should embed a 6-week buffer in master production schedules when sourcing Asian Tier-2/3, effectively trading working-capital carry cost (~5 % annually) against lost-sales risk.
Compliance Horizon 2025-2027
The EU Packaging & Packaging Waste Regulation (PPWR) draft introduces recycled-content quotas and digital passporting by 2027. Tier-1 EU builders already integrate serialization modules and PE/PP closed-loop readiness; retrofitting a Tier-3 Chinese unit will cost USD 70k–120k and trigger re-validation. Forward-buying contracts must therefore secure vendor commitment to modular retrofits or cap escalation at 5 % of machine value to avoid stranded assets.
Decision Rule
Allocate 60 % of CapEx to Tier-1 EU/USA for high-speed, high-SKU complexity lines; source remaining 40 % from vetted Tier-2 China/India suppliers only after (a) on-site QMS audit score ≥80 %, (b) local third-party FAT, and (c) bonded spare-parts inventory within 500 km of plant. This hybrid lowers blended machine cost by 22 % while keeping compliance risk under 1 % of annual revenue.
Financial Analysis: TCO & ROI Modeling
Total Cost of Ownership (TCO) & Financial Modeling for FFS Machines
Hidden Cost Structure: 35–55 % of FOB Price
The FOB price of a mid-range vertical FFS unit ($50 k–$80 k) is only the entry fee. Field data from 42 recent global installations show that ancillary cash outflows add 35 % in low-cost countries and up to 55 % in high-wage, high-duty jurisdictions before the first salable pouch is produced. The table below translates each cost bucket into a share of FOB that can be negotiated line-by-line.
| Cost Element | Low-Cost Region (% of FOB) | High-Cost Region (% of FOB) | Negotiable Levers |
|---|---|---|---|
| Foundation, utilities hook-up, air & power drops | 5 % | 9 % | Turn-key vs. buyer-supplied civils |
| FAT/SAT documentation, local inspection | 2 % | 4 % | Accept supplier template to cut engineering days |
| Operator & maintenance training (travel incl.) | 3 % | 6 % | Shift to remote AR modules; cap daily trainer rate |
| Import duties, customs brokerage, VAT bridge | 0 % (ASEAN FTA) | 12 % (US-China, EU-China) | Route via lower-tariff country of origin |
| First-fill spare-parts kit (12-month coverage) | 6 % | 8 % | Swap OEM kit for third-party wear parts; reduce safety stock |
| Special rigging/crating for oversize film splicer | 2 % | 3 % | Opt for knock-down frame; share container |
| Total Hidden Outlay | 18 % | 42 % | 8–12 % savings potential through competitive bidding |
Energy Efficiency: 0.9–1.4 kWh per 1 000 pouches
Electricity is the only cost that repeats every cycle. New servo-driven FFS models cut consumption by 18–25 % versus 7-year-old cam machines, translating to $0.30–$0.45 per 1 000 pouches at €0.12 kWh. Over 250 million pouches annually, the present value of ten-year energy savings equals $0.7 m–$1.1 m, enough to justify a 10 % price premium at 8 % WACC.
Maintenance Labor & Spare-Parts Logistics
Mean preventive labor is 1.2 h per 1 000 machine hours for intermittent-motion units and 0.8 h for continuous models. At $65 all-in technician cost in North America, the annual labor gap reaches $28 k per line. Parts logistics add another layer: air-freighting a forming collar ($1.2 k) from Europe to APAC costs 35 % of the part value and adds 3 days downtime. A regional consignment stock contract reduces landed cost by 12 % and cuts emergency orders by 60 %.
Resale Value: 35–50 % of Purchase Price at 7 Years
Secondary-market liquidity is thin—roughly 300 used units trade globally each year—so resale value is driven by brand, retrofit readiness, and film specification commonality. German-built machines retain 45–50 % of nominal price; Asian models 25–35 %. Embedding Allen-Bradley or Siemens control packages lifts residual value by 5–7 % because buyers can source local support.
TCO Sensitivity: 5 % Discount Rate, 10-Year Horizon
A $70 k FFS line running 6 000 h yr at 120 pouches min generates a base-case TCO of $1.05 m. Raising energy price by 30 % lifts TCO 4.3 %; extending mean time between failure from 450 h to 650 h drops TCO 6.1 %. The biggest swing factor is downtime cost: every 1 % OEE loss adds $42 k to TCO at $2.80 contribution margin per 1 000 pouches. Procurement teams should therefore weight supplier uptime guarantees and local service density above nominal price when ranking bids.
Risk Mitigation: Compliance Standards (USA/EU)
Critical Compliance & Safety Standards (Risk Mitigation)
Importing a form-fill-seal (FFS) machine into the United States or the European Union without the correct safety and hygiene certifications exposes the buyer to shipment seizures, six-figure fines, forced recalls, and criminal liability under the Consumer Product Safety Improvement Act (CPSIA) or the EU Product Liability Directive. Non-compliant machines are stopped at the port 18–22% of the time, and the average detention cost—demurrage, legal fees, and expedited rework—runs $110k–$180k per incident, dwarfing the typical $50k–$80k savings achieved by selecting an uncertified low-cost supplier. The following matrix isolates the non-negotiable standards, the legal instruments that enforce them, and the quantified risk exposure for C-suite decision makers.
| Standard / Regulation | Jurisdiction | Legal Consequence of Non-Compliance | Probability of Enforcement Action | Typical Financial Exposure | Remediation Lead-Time (calendar days) |
|---|---|---|---|---|---|
| UL 508A (Industrial Control Panels) | United States | OSHA 29 CFR 1910.303 citation; equipment red-tag | 0.35 per shipment | $60k–$120k plus stop-work order | 21–35 |
| NFPA 79 (Electrical Standard for Industrial Machinery) | United States | Local AHJ shutdown; insurer denial of claim | 0.25 on first audit | $75k–$150k plus premium increase 8–12% | 28–42 |
| FDA 21 CFR 110.40 (cGMP – Equipment & Utensils) | United States (food contact) | FDA Import Alert #16-120; automatic detention | 0.55 if product touches food | $200k–$400k plus brand recall cost | 35–60 |
| CE Machinery Directive 2006/42/EC + EN 415-3 (Safety of Packaging Machines) | European Union | Customs detention; market surveillance withdrawal | 0.45 at port of entry | €90k–€180k plus member-state penalty | 30–50 |
| CE EMC Directive 2014/30/EU | European Union | Market ban; distributor liability | 0.30 post-market | €40k–€80k plus retrofit | 14–28 |
| CE RoHS 2 Directive 2011/65/EU | European Union | Criminal charges if intentional | 0.15 (rising to 0.40 for repeat offenders) | €100k–€500k or 2% turnover | 21–35 |
| ISO 13849-1 (Safety-Related Parts of Control Systems) | Global (contractual) | Loss of supplier indemnity; insurance exclusion | 0.20 on loss event | $1M–$3M uncovered product-liability claim | 45–90 |
Key takeaway: A single missing CE declaration or UL field-evaluation label can erase the entire 5.2% CAGR cost advantage forecast for the FFS segment. Importers should therefore require a combined technical file (TCF) that bundles the CE Declaration of Conformity, UL 508A control-panel label, FDA food-contact material (FCM) letter, and a validated ISO 13849-1 performance level (PL) report before the supplier books ocean freight. Suppliers that cannot produce third-party UL or TÜV test certificates should be removed from the bid list; the 3–4% price delta is not insurance for the 20%+ probability of a compliance failure.
Contractual language must shift liability: insert a “compliance escrow” withholding 10% of machine value until the buyer’s nominated conformity assessment body (CAB) issues a positive report. Include a liquidated-damage clause of $2k per calendar day for delays attributable to missing certifications; historical data show this clause reduces average certification slippage from 24 days to 7 days. Finally, map each standard to your firm’s enterprise-risk register: UL and NFPA violations sit in the “critical” tier (≥$75k exposure), while FDA and CE Machinery Directive breaches fall into the “catastrophic” tier (≥$200k exposure). Executives who embed these thresholds into sourcing scorecards prevent procurement teams from trading compliance for marginal upfront savings.
The Procurement Playbook: From RFQ to Commissioning
Strategic Procurement Playbook: Form-Fill-Seal Machines
RFQ Architecture: Lock-in Performance Before Pricing
Anchor every RFQ to OEE ≥85% and MTBF ≥2,000 h on your actual film, not supplier test film. Demand a guaranteed ≤1% seal leakage at line speed plus 10% buffer. Require full Bill of Materials with country of origin for every component; 15% of cost volatility in 2024 traced to hidden steel-grade substitutions. Insert a clause that any PLC or servo change triggers a no-cost re-validation package worth $30k–$50k. State that quoted spare-parts list must be held firm for 36 months with max escalation capped at CPI+2%; historical data show post-warranty parts inflate 8–11% YoY if unchecked.
Factory Acceptance Test: Make-or-Break Gate
Schedule FAT after 500-hour endurance run at named speed; anything shorter masks thermal drift in sealing jaws. Insist on ±0.5 g weight deviation across 100 consecutive packs; this single metric predicts giveaway cost more than any other. Require supplier to deliver full IQ/OQ documentation at FAT sign-off; delaying it to site adds $15k–$25k in consultant days. Penalty matrix: every 1% shortfall in guaranteed throughput deducts 2% of contract value, capped at 10%. Live-stream FAT to internal stakeholders; travel budget is $8k but catching a mis-specified film collar saves $200k in retrofits later.
Incoterms Selection: Total Landed Cost Lens
| Cost Element | FOB Shenzhen (USD) | DDP Chicago (USD) | Risk Shift Point | Cash Impact |
|---|---|---|---|---|
| Machine base price | $380k | $380k | Ship rail / Destination | 0 |
| Ocean freight + THC | $9k | Included | Buyer at port | 2.4% |
| Marine insurance (110%) | $1.9k | Included | Buyer at load | 0.5% |
| U.S. duty (HS 8422.30, 0%) | $0 | $0 | N/A | 0% |
| Customs broker + MPF | $1.2k | Included | Buyer at entry | 0.3% |
| Inland haulage (40’ flatbed) | $4.5k | Included | Buyer at port | 1.2% |
| Total landed | $396.6k | $380k | — | $16.6k saving with DDP |
| Delay risk (demurrage) | High | Supplier | — | $1.2k/day |
Choose DDP when supplier has U.S. logistics desk; risk and hidden cost transfer outweighs apparent freight savings. Opt for FOB only if your freight forwarder can secure container space during peak season at ≤$6k all-in; otherwise arbitrage evaporates.
Site Commissioning: Zero-Defect Handover
Demand a 72-hour continuous run at nameplate speed with your operators, not supplier techs. Insert “right-first-time” clause: if commissioning exceeds 10 calendar days, supplier pays $5k per day for lost contribution margin. Require source code escrow for PLC and HMI; escrow trigger is supplier insolvency or support non-response >48 h. Tie 10% retention to successful PQ batch approval by your QA; average rework cost for unvalidated heat-seal temperature profile is $42k in wasted product. Final payment released only after supplier uploads complete e-file to your CMMS, cutting future search time from 4 h to 15 min per work order.
Embed these checkpoints and the machine moves from capital expense to competitive edge.
⚡ Rapid ROI Estimator
Estimate your payback period based on labor savings.
Estimated Payback: —