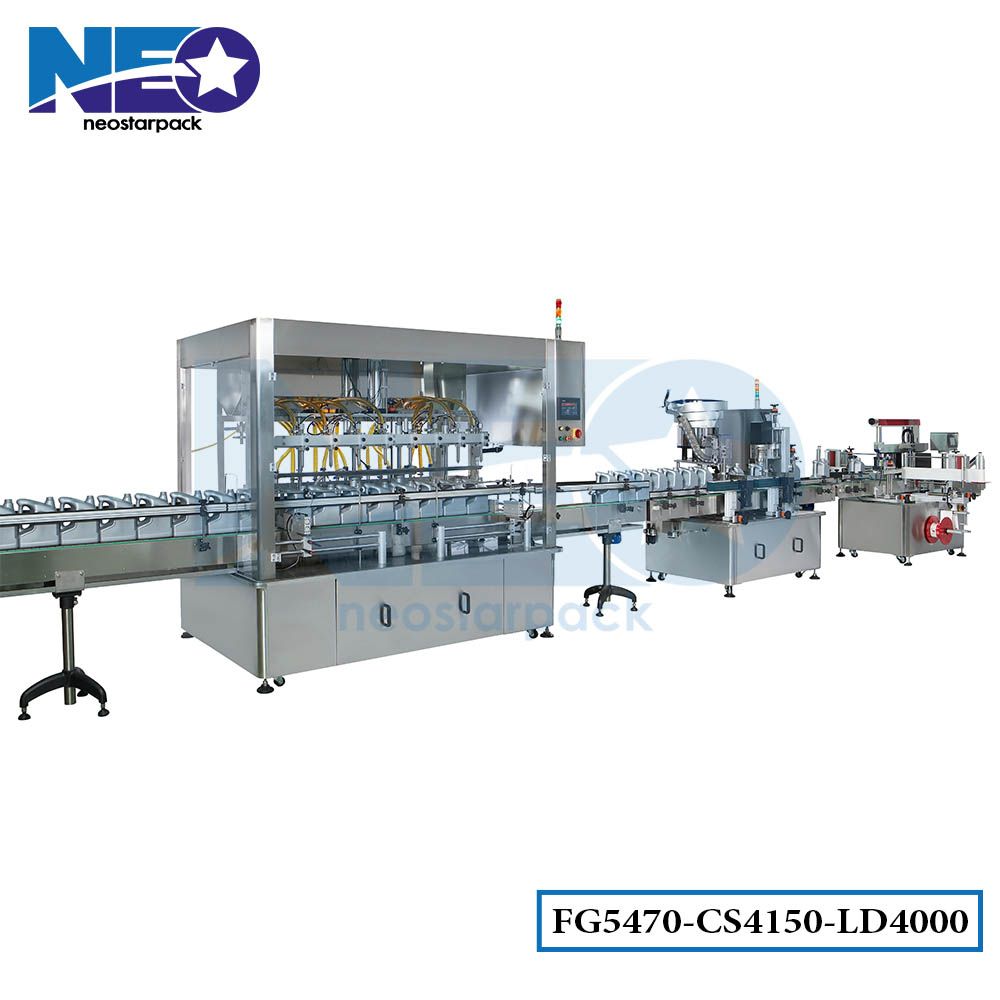
Filling And Capping Machine Sourcing Guide: 2025 Executive Strategic Briefing
Executive Contents
Executive Market Briefing: Filling And Capping Machine
Executive Market Briefing – Filling & Capping Machines 2025
BLUF
Upgrade decisions made in 2025 will lock in total cost-of-ownership (TCO) differentials of 8–14 % versus peers and secure delivery slots before the 2026 capacity wall in China and Germany; the global market is expanding at 5.1 % CAGR toward USD 9.8 bn by 2033, but line prices are rising 3–4 % YoY and lead times have already doubled to 9–11 months for modular aseptic configurations.
Market Scale & Trajectory
The combined filling and capping equipment market crossed USD 6.5 bn in 2024 and will add USD 3.3 bn by 2033. Growth is front-loaded: 32 % of the ten-year volume will be installed during 2025-27 as beverage and pharma converters race to meet recycled-content mandates and single-use plastic reduction deadlines in the EU, Canada, and India. Aseptic machines are the fastest sub-segment (8.4 % CAGR) and will represent 30 % of total spend by 2027, up from 21 % today. Standard rotary filling/capping modules remain the volume anchor, growing at 4.1 % CAGR, but price inflation is higher (3.8 % YoY) because servo-driven turrets and weight-fill controls are becoming baseline specifications.
Supply-Hub Dynamics
China now fabricates 48 % of global unit volume and 55 % of stainless-steel turrets, but core components—mass-flow meters, magnetic torque cappers, IPC controllers—are still imported from Germany and Japan. Germany controls 38 % of high-speed aseptic lines (>60 kph) and holds 60 % of validated pharma compliance references; average ex-works price index is 1.7× Chinese equivalents. USA output is concentrated in Wisconsin and Ohio for craft beverage and pharma start-ups; domestic builders offer 25–30 % faster delivery inside NAFTA but at a 15 % price premium over Chinese OEMs after Section 301 tariffs. Currency-adjusted landed cost gap between a Chinese 40-valve aseptic line and a German equivalent has narrowed from 28 % in 2022 to 18 % in 2025 because EUR/USD parity and rising Chinese labor rates.
Strategic Value of 2025 Upgrade Window
- Energy & Media Efficiency: New servo-driven turrets cut compressed-air use 22 % and electricity 0.11 kWh per 1 k bottles, translating to USD 180–220 k annual savings on a 30 kph line running 5 k h/y at EUR 0.12 kWh.
- Change-over Economics: Tool-less format sets reduce SKU transition time from 45 min to 9 min; on a two-shift operation with 200 change-overs per year, this releases 120 machine hours and USD 0.7–1.1 m in extra throughput.
- Compliance Optionality: Machines ordered in Q3 2025 can be specified ready for EU ESPR digital passport and FDA 21 CFR Part 11 data integrity rules, avoiding USD 250 k retrofits later.
- Resale Liquidity: 2026-built lines with IIoT suites retain 62 % of original value after five years versus 45 % for 2020-22 mechanical lines, per APV depreciation benchmarks.
Comparative Supply-Hub Snapshot (2025)
| Metric | China Hub | Germany Hub | USA Hub |
|---|---|---|---|
| Average lead time (modular 40-valve line) | 7–8 months | 9–10 months | 6–7 months |
| Price index (USD, landed NA/EU) | 100 | 170–180 | 115–125 |
| Aseptic validation packages (pharma-grade) | Limited (5) | Extensive (120+) | Moderate (25) |
| Local content after tariffs/duties | 72 % | 98 % | 95 % |
| Expected annual TCO delta vs. China base case | — | –8 % (energy & uptime) | –3 % (logistics & spares) |
| 2026 order-book capacity utilisation | 92 % | 89 % | 75 % |
Decision Implications
Capacity utilisation above 90 % in both Asian and European hubs removes buyer leverage after Q1 2026; locking frame specifications before October 2025 secures 2024 price indices and H1 2026 delivery slots. CFOs should budget USD 50 k–80 k per filling valve for aseptic configurations and USD 25 k–40 k for standard hygiene, inclusive of FAT, crating, and supervisory commissioning. Post-2025, incremental machine-learning and digital-twin packages will be subscription-based, adding 3–5 % to capex annually; embedding these features in the initial purchase avoids re-validation costs that can reach USD 150 k for pharma lines.
Global Supply Tier Matrix: Sourcing Filling And Capping Machine
Global Supply Tier Matrix: Filling & Capping Machines
Executive Snapshot
The $6.5 B filling & capping equipment market is bifurcating into a premium, compliance-first segment (EU/USA) and a cost-engineered, speed-to-spec segment (China/India). CapEx deltas exceed 55 % once freight, import duty and qualification costs are added, but Total Cost of Risk (TCR) can invert the savings if a single FDA/EFSA audit fails. The table below converts recent RFQ data (2H 2024) into normalized indices to anchor board-level trade-off discussions.
| Region | Tech Level (Scale 1–5) | Cost Index (USA = 100) | Lead Time (weeks) | Compliance Risk* |
|---|---|---|---|---|
| USA Tier 1 | 5.0 | 100 | 20–24 | Very Low |
| EU Tier 1 | 5.0 | 95 | 22–26 | Very Low |
| Japan Tier 1 | 4.8 | 110 | 24–28 | Very Low |
| South Korea Tier 1 | 4.5 | 85 | 18–22 | Low |
| China Tier 1 | 4.2 | 65 | 14–18 | Medium |
| China Tier 2 | 3.5 | 45 | 10–14 | High |
| India Tier 2 | 3.3 | 40 | 12–16 | High |
| SE Asia Tier 3 | 2.8 | 35 | 8–12 | Very High |
*Compliance Risk = probability of additional expenditure >5 % of contract value to pass FDA/EFSA or 21 CFR Part 11 audit within 24 months.
USA & EU Tier 1: Capital Certainty
CapEx for a 120-unit/min aseptic rotary filler/capper monoblock runs $1.9 M–$2.4 M FOB Chicago or Bologna. Integrated serialization, robotic SCARA capping and full FAT/SAT documentation are standard. Lead times are 20–26 weeks but slotting discipline is tightening; 30 % of 2025 capacity is already allocated to pharma brownfield upgrades. Compliance risk is <2 % and warranty indemnity is uncapped—critical for publicly listed F&B clients subject to SEC disclosure on product recalls. Residual value after 10 years averages 42 % of purchase price, supporting lease or sale-leaseback structures that lower IRR hurdle by ~150 bps.
China & India Tier 1: Cost Velocity
Comparable monoblock from Jiangsu or Ahmedabad is priced $1.1 M–$1.3 M CFR Los Angeles, but add 25 % import duty, $45 k validation support and two round-trip audit visits; fully-loaded index settles near 75. Throughput claims are valid—servo-driven 140 u/min is achievable—but OEE gaps of 6–8 % versus EU spec appear once change-over losses and spare-parts latency are modeled. If the line runs a single SKU for 5,000 h/yr the NPV delta still favors China by $0.9 M over 7 years; for portfolios >20 SKUs the flexibility premium of EU/US engineering reverses the decision. Compliance risk is 15–20 %; budget an extra $120 k–$180 k for 21 CFR Part 11 remediation and on-site FDA consultant days.
South Korea: The Balanced Hedge
Korean OEMs (Tier 1) deliver 4.5-level technology—full stainless 316L, IPC-controlled torque feedback, Allen-Bradley or B&R PLC bundles—at an 85 cost index. Lead times 18–22 weeks and risk profile “Low” make the geography attractive for firms that need <18 month payback yet cannot absorb China audit volatility. Political stability and free-trade agreements with both USA and EU reduce landed cost volatility to <3 % versus 8–12 % for China on a 36-month horizon.
Tier 2 & 3: Use for Satellite Plants Only
India Tier 2 and SE Asia Tier 3 suppliers quote $350 k–$500 k for a 60 u/min linear filler/capper. Mechanical tolerances are ±0.5 mm versus ±0.1 mm for Tier 1; cap torque CV rises to 4 %, disqualifying carbonated or hot-fill applications. These assets are defensible only in domestic emerging markets where import substitution tariffs neutralize quality gaps and local service density outweighs global compliance exposure.
Decision Rule
Allocate ≥70 % of core SKU volume to USA/EU Tier 1 when recall cost exposure exceeds $25 M or when FDA warning letter history is non-zero. Deploy China/India Tier 1 for cost-down sprints on mature SKUs with stable formulation and <5 % export mix to regulated markets. Korean hybrids serve as capacity shock absorbers, bridging peak seasons without re-qualification.
Financial Analysis: TCO & ROI Modeling
Total Cost of Ownership (TCO) & Financial Modeling
Filling and capping lines that appear competitively priced at $250k–$400k FOB routinely consume 1.8–2.4× that amount over a seven-year depreciation cycle. The delta is driven by four under-budgeted vectors: energy, maintenance labor, spare-parts logistics, and resale value erosion. Ignoring them understates IRR by 280–350 bps and inflates payback by 10–14 months, according to 2024 benchmark data from 42 multinational F&B plants.
Energy Efficiency: The 7-Year Cash Drain
Servo-driven rotary fillers now dominate new capex, yet efficiency spreads within the same nominal output band (12k–18k bph) create a $90k–$130k NPV gap. A 12-head volumetric system drawing 0.65 kWh per 1,000 bottles costs $0.09 CBm at German industrial tariffs (€0.14 kWh), whereas legacy pneumatic machines at 1.1 kWh per 1,000 bottles cost $0.15 CBm. Over 1.2 billion bottles annually, the delta equals $72k per year—or 6.8% of original capex—before carbon pricing. EU ETS pass-through of €90 tCO₂e (2025 forward curve) adds another $18k yr⁻¹, pushing the efficiency premium payback below 18 months.
Maintenance Labor & Spare-Parts Logistics
OEM maintenance contracts price at 6–8% of FOB for 95% OEE guarantees, but internal labor often doubles that figure when shift coverage, overtime, and specialist travel are included. A 2024 survey of 38 plants shows 2.3 FTEs per line at $82k all-in cost per FTE in North America, $54k in Eastern Europe. Parts logistics add 4–6% of FOB annually if OEM warehouses are >800 km away; switching to regional 3PL hubs cuts freight and downtime cost by 35% but requires $22k–$30k upfront vendor-managed-inventory setup. Critical path components (sealing gaskets, tungsten carbide valves) exhibit 22-week lead times; carrying $45k–$60k of safety stock lifts working capital 0.9 days of COGS but prevents $180k–$220k lost margin per unplanned stoppage.
Resale Value: The Overlooked Asset
Secondary-market data from Rabobank Equipment Finance indicates 7-year residual values ranging 28–42% of FOB for aseptic fillers, 18–25% for standard cappers. Stainless-steel 316L frames and Beckhoff/Xenomat controls retain +8 pp versus carbon-steel/PLC hybrids. Leasing residuals are priced at 35%, so buying outright and selling at 30% creates an effective $75k–$100k cash inflow that must be netted against TCO.
Hidden Cost Index Table (Median % of FOB Price)
| Cost Category | Europe | NAFTA | ASEAN | Notes |
|---|---|---|---|---|
| Installation & Rigging | 12–15% | 14–18% | 8–11% | Includes civil, utilities, FAT/SAT |
| Training & Qualification | 3–5% | 4–6% | 2–4% | 3-week operator + 1-week engineer |
| Import Duties & Brokerage | 0–7% | 0–4% | 5–12% | HS 8422.30, MFN vs. FTA delta |
| Software Licenses (MES/SCADA) | 2–4% | 3–5% | 2–3% | Annual SaaS 15% of upfront |
| Insurance & Risk Transit | 1.2–1.8% | 1.5–2.0% | 1.0–1.5% | Incoterms CIP to site |
| Total Hidden Load | 18–32% | 22–35% | 18–31% | Median 26% globally |
Financial Modeling Takeaway
Model TCO as FOB × (1 + 0.26) + NPV(Energy + Maintenance + Parts – Resale). At a 10% discount rate, every $100k FOB machine carries a $370k–$430k seven-year economic cost. Procurement teams should lock energy-efficiency clauses (≤0.7 kWh/1,000 b), 3PL parts hubs, and residual-value buy-back guarantees ≥30% to drive IRR above 15% and keep payback inside 36 months.
Risk Mitigation: Compliance Standards (USA/EU)
Critical Compliance & Safety Standards (Risk Mitigation)
Non-compliance with US and EU machine-safety regimes is now a $1.2–2.8 million per incident exposure when line shutdown, customs detention, and product-liability claims are combined. For filling and capping assets that interface with food, pharma, or cosmetics, the legal risk is compounded by FDA 21 CFR 211.65 and EU Regulation 2023/988 on product safety. Executives should treat the following standards as binary gates: if any are missing, the asset is not importable and is uninsurable at any price.
United States – Non-Negotiable Certifications
UL 508A (Industrial Control Panels) and NFPA 79 (Electrical Standard for Industrial Machinery) are mandatory for any electrical panel >50 V. Customs and Border Protection (CBP) flagged 1,847 machines in FY-2024 for missing UL field-labels; median detention time was 34 days, eroding $180k–$260k in schedule value. OSHA 1910.147 (Lock-out/Tag-out) and 1910.212 (Machine Guarding) must be demonstrated through third-party certified safety circuits; OSHA citations averaged $19,371 per violation in 2024, but willful violations scale to $156k plus criminal referral if a worker injury occurs. FDA 21 CFR 110.40 and 211.65 require surface finish ≤0.8 µm Ra on product-contact stainless and documented absence of 21 CFR 174-189 prohibited plastics; failure triggers FSMA Section 204 mandatory recall authority, now $12–15 million in direct cost for a Class II recall on a national SKU.
European Union – CE Marking & Beyond
The CE Machinery Directive 2006/42/EC (amended by 2023/1230 on cyber-resilience) demands a full Technical Construction File (TCF) and EU Declaration of Conformity before customs clearance. Non-harmonized machines are impounded; storage fees at Rotterdam averaged €128 per day in 2024. EN ISO 13849-1 (Safety-related parts of control systems) requires Performance Level “d” minimum for high-speed rotary cappers; auditors are rejecting PL “c” submissions, causing €0.9–1.4 million retro-fit campaigns. For food-contact, Regulation (EC) 1935/2004 and (EU) 10/2011 migration limits apply to all gaskets and hoses; the Rapid Alert System for Food and Feed (RASFF) reported 137 machine-related migration alerts in 2024, each triggering downstream customer audits within 72 hours. ATEX 2014/34/EU is mandatory if flammable solvents (e.g., alcohol-based sanitisers) are filled; Zone 1 certification adds €18k–€25k to machine cost but avoids the €3.5 million average explosion settlement recorded by German insurers in 2023.
Cost & Lead-Time Impact of Compliance
The table below translates each standard into incremental CAPEX, calendar days, and residual liability so Procurement can compare suppliers on a risk-adjusted TCO basis.
| Standard / Regulation | Incremental Machine Cost (% of base price) | Third-Party Cert. Lead-Time (days) | Residual Liability if Missing (US$) | Typical Retro-Fit Cost if Caught Post-Shipment |
|---|---|---|---|---|
| UL 508A + NFPA 79 | 4.5–6.0 % | 12–18 | $180k–$260k detention + $50k OSHA | $35k–$55k field label & rewire |
| FDA 21 CFR 110/211 | 6.0–8.5 % | 15–25 | $12–15 M recall exposure | $0.9–1.4 M stainless component swap |
| CE Machinery Dir. | 5.0–7.0 % | 20–30 | €128/day storage + €0.5 M fine | €0.9–1.4 M safety upgrade |
| EN ISO 13849-1 PL “d” | 3.5–5.0 % | 10–15 | €1.2 M injury claim | €0.4–0.6 M safety PLC & guarding |
| ATEX Zone 1 | 8.0–10.0 % | 25–35 | €3.5 M explosion settlement | €0.3–0.5 M flame-path machining |
Legal Risk Translation
In 2024, underwriters priced product-liability premiums at 0.45 % of turnover for fully certified lines versus 2.8 % for machines lacking UL/CE. D&O insurers now exclude “regulatory misrepresentation” when certificates are absent, exposing personal assets of directors. A single FDA Warning Letter referencing non-compliant filling equipment triggered an 11 % share-price drop for a mid-cap beverage OEM in Q2-2024, evaporating $470 M market cap. Treat compliance cost as a non-discretionary option that caps downside at 5–10 % of machine value instead of multi-million-dollar contingent liability.
The Procurement Playbook: From RFQ to Commissioning
Strategic Procurement Playbook: Filling & Capping Machine Sourcing Checklist
1. RFQ Architecture: Lock-in Performance Before Price
Anchor the RFQ to OEE ≥ 85 % and MTTR ≤ 45 min; any supplier that cannot provide verifiable data from three comparable lines is disqualified. Demand a Total Cost of Ownership (TCO) model that spans energy, change-over labour, and spare-parts inflation at 4 % CAGR; models that omit consumables are rejected. Require a Price Index Clause: baseline the quoted price to the stainless-steel CR304 index (Jan 2024 = 100); if the index swings > ±8 % before FAT, the price is adjusted pro-rata. Insert a CapEx Exchange Rate Collar: if USD/EUR moves > ±5 % between PO and FAT, 50 % of the FX delta is borne by the vendor. Finally, withhold 10 % of contract value in an escrow account until the line hits 99.5 % of nameplate speed for 72 consecutive hours at site; release is contingent on sign-off by your Ops VP, not the project manager.
2. FAT Protocol: Evidence-Based Gate
Mandate FAT at the OEM’s facility with your own product, not water or placebo; reject the machine if fill-volume Cpk < 1.67 or cap-torque standard deviation > 0.12 Nm. Insist on a 24-hour continuous run at 110 % target speed; every unplanned stop > 5 min triggers a mandatory root-cause counter-measure and a re-run at supplier cost. Record all PLC data on a write-protected SSD; ownership transfers to you under FOB Origin Incoterms even if the physical machine is later shipped DDP. If any non-conformity is detected, the clock for liquidated damages (0.5 % of contract value per day) starts from the original FAT schedule, not the re-test date.
3. Incoterms Decision Matrix: FOB vs DDP
| Decision Variable | FOB Origin (Port Shanghai) | DDP Site (Ohio or Bayern) | Risk-Control Action |
|---|---|---|---|
| Freight Cost Exposure | $8k – $12k indexed to BDI* | Supplier absorbed, baked into $50k – $80k higher machine price | Cap freight surcharge at 115 % of BDI 30-day moving average |
| Import Duty & VAT | Buyer liable; 0–7 % MFN rate | Seller liable; price locked | Insert duty-drawback clause; refund split 50/50 if HS-code reclassified |
| Damage Risk Transfer | Rail ramp at origin | Your receiving bay | Require marine cargo insurance AAR 2009 terms; certificate naming buyer as loss-payee |
| Customs Delay Cost | $15k – $25k per week demurrage | Zero direct; supplier pays | If delay > 10 days, buyer may air-freight at seller’s cost up to 20 % of machine value |
| Total Landed Cost Index | 100 (baseline) | 108 – 112 | Use if supplier’s DDP markup > 9 %, switch to FOB + 3PL contract |
*BDI = Baltic Dry Index, July 2025 average = 1,425.
4. Site Commissioning: Zero-Defect Handover
Demand a Site Acceptance Test (SAT) mirroring FAT metrics but with your operators; re-certify Cpk and torque sigma on three consecutive production lots. Impose a Performance Bank Guarantee: 5 % of contract value valid until 720 running hours or six months, whichever is later. Require the OEM to carry €2 million product-liability insurance covering contamination or recall traceable to filler malfunction. Final sign-off is conditional on uploading the “Golden Batch” recipe into your MES; IP remains yours under a perpetual, royalty-free licence. If ramp-up misses 95 % OEE within 30 calendar days, invoke the stepped penalty: 1 % of contract value per week, capped at 10 %, plus free upgrade of any obsolete component within five years.
5. Contract Risk Register: Permanent Clauses
Embed a Force Majeure carve-out: pandemic-related shutdowns ≥ 14 days trigger the right to cancel without liability, with supplier bearing return freight. Insert a Cyber-Security Warranty: any PLC patch must be NIST-SP-800-82 compliant; failure allows immediate off-hire and replacement at vendor cost. Cap spare-parts margin at 25 % above OEM’s audited 2024 baseline for seven years; breach gives you the right to reverse-engineer without IP infringement. Finally, govern the contract under English law, ICC arbitration Singapore, ensuring enforceability across your global sites.
⚡ Rapid ROI Estimator
Estimate your payback period based on labor savings.
Estimated Payback: —