Flour Packing Machine Sourcing Guide: 2025 Executive Strategic Briefing
Executive Contents
Executive Market Briefing: Flour Packing Machine
Executive Market Briefing – Full-Automatic Flour Packing Machines (2025)
BLUF
The global installed base is being replaced faster than at any time in the last decade: demand for full-automatic flour packing lines is compounding at 5.8–6.2 % CAGR toward a USD 6.3 bn market by 2035, while average factory gate prices have fallen 11 % since 2022. Upgrading now locks in 2–4 ppt extra OEE, 12–18 % lower labor cost per tonne, and USD 0.18–0.22 per 1 kg bag saving in film waste before carbon-border levies tighten in the EU and North America in 2026.
Market Scale & Trajectory
The powder packaging machinery segment—of which flour accounts for ~34 % of unit shipments—closed 2024 at USD 4.8 bn and is tracking toward USD 6.3 bn by 2035. Full-automatic form-fill-seal (FFS) configurations are outpacing the category at >7 % CAGR because bakeries and retail-pack co-packers are converging on 25–50 kg bulk and 1–5 kg retail formats on the same line to serve both industrial and e-commerce channels. Replacement demand—not greenfield—represents >60 % of 2025 order books, indicating a technology refresh rather than capacity expansion.
Supply-Hub Economics: China vs Germany vs USA
| Metric | Yangtze-River Delta (China) | Baden-Württemberg / Bavaria (Germany) | Midwest (USA) |
|---|---|---|---|
| Average lead time, sea freight ex-works (weeks) | 4–6 | 10–12 | 6–8 |
| Price index, full-auto 1 kg FFS line (USD, 2025) | 70 | 100 | 95 |
| Energy-use benchmark (kWh per 1 t packed) | 28–32 | 22–25 | 24–27 |
| Supplier R&D spend (% of sales) | 2.5 | 6.5 | 5.0 |
| After-sales tech staff within 24 h flight coverage | 35 % of global flour mills | 78 % | 65 % |
| Tariff exposure into EU (MFN, % of CIF value) | 1.7 | 0 | 1.9 |
| Carbon-adjusted landed cost delta vs China (2030 scenario) | +8 % | baseline | +5 % |
China delivers lowest capital outlay and fastest delivery, but German lines retain a total cost-of-ownership (TCO) advantage inside Europe once energy, tariff, and CBAM carbon levy effects are priced. US-built equipment sits between the two, offering logistical safety stock for North American food groups wary of geopolitical disruption.
Strategic Value of a 2025 Upgrade Cycle
1. OEE & Speed Leap
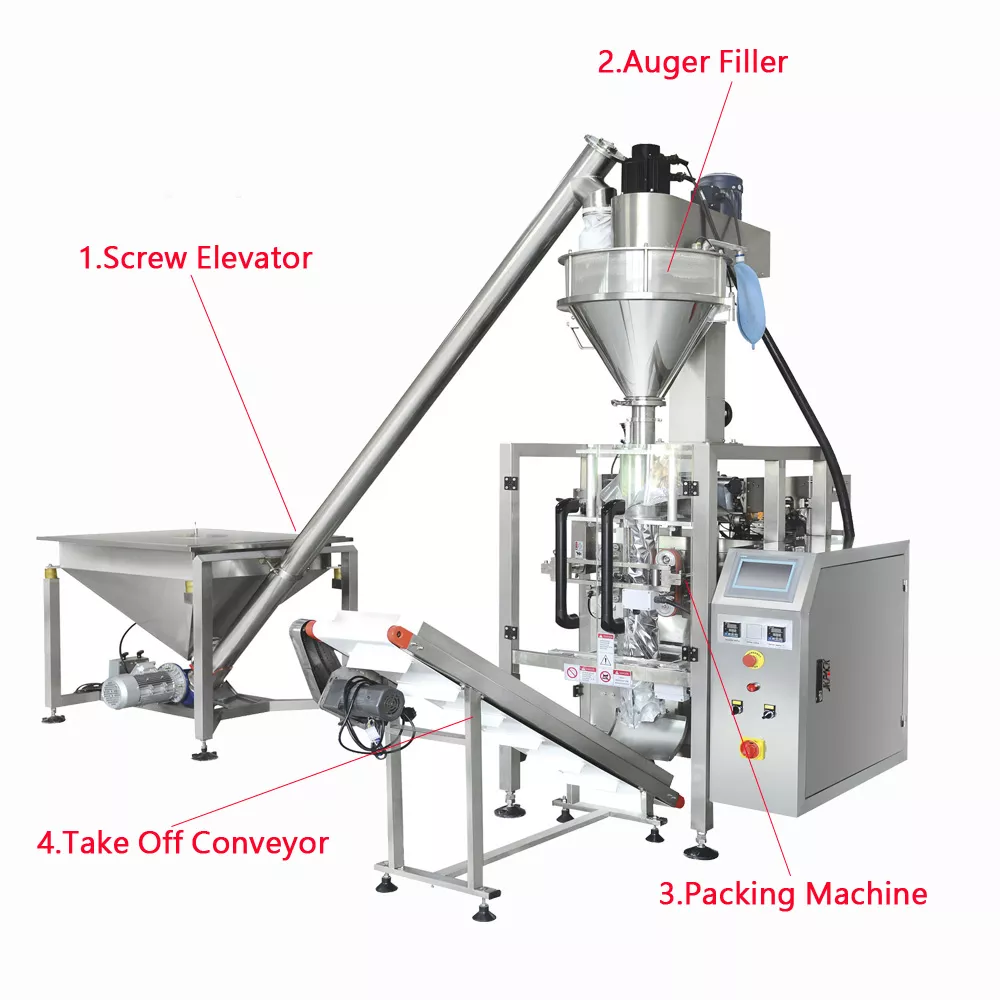
New servo-driven auger heads and 3-axis robotic bag placers raise nameplate speed to 1,800–2,000 bags/h (1 kg) versus 1,200–1,400 bags/h on 2018-era gear, translating into 15–20 % throughput without extra shifts.
2. Labor Arbitrage Window
Post-pandemic wage inflation in Tier-1 flour markets (EU +5 % y/y, US +6 %) makes automating the last manual station (bag top-reform & stitching) pay back in 14–18 months at 2-shift operation.
3. Film & Energy Efficiency
Ultrasonic sealing and VFD-controlled film pull cut film usage per bag by 7–10 % and energy by 0.4 kWh per 1 t; at EU energy prices (USD 0.18/kWh) this alone is worth USD 220 k per year on a 300 t/d mill.
4. Compliance Optionality
Machines spec’d today with IIoT sensor packs and GS1-compliant serialization modules satisfy draft EU digital product passport rules (2026) and Walmart/US FDA traceability mandates (2027), avoiding a retrofit ticket of USD 150 k–250 k later.
Price Outlook & Budget Anchors
Cap-ex ranges (2025 FOB, fully automated FFS, 1–10 kg retail, including auger dosing, metal detector, and robotic bag outfeed):
China origin: USD 50 k – 80 k
Germany origin: USD 90 k – 130 k
USA origin: USD 85 k – 120 k
Leasing spreads have widened to 4.9–6.1 % over 3–5 years as ESG-tied credit facilities discount energy-efficient assets, effectively lowering IRR hurdle by 1 ppt versus 2023.
Decision Clock
Order slots for Q4 2025 delivery are >70 % filled at European OEMs; Chinese makers still show 30 % spare capacity but inbound component lead times (Siemens PLCs, SMC pneumatics) are stretching to 16 weeks. Executives targeting calendar-year commissioning should issue RFPs by June 2025 to secure line availability and lock 2025 pricing before annual steel and servo-motor escalators reset January 2026.
Global Supply Tier Matrix: Sourcing Flour Packing Machine
Global Supply Tier Matrix for Full-Automatic Flour Packing Machines
Tier 1 – EU / USA / Japan
Tech Level: Servo-driven auger fillers, 3-A & USDA dairy sanitation, IIoT-ready PLCs, validated 21 CFR Part 11 data integrity.
Cost Index: 185–220 (USA baseline = 100).
Lead Time: 16–24 weeks ex-works; 3–5 weeks ocean freight to APAC.
Compliance Risk: Negligible; full FAT/SAT documentation, ATEX & CE self-declaration, local field-service hubs.
Trade-off: CapEx 2.2× China, yet 3-year TCO advantage when downtime cost >$15k hr⁻¹ or when BRC/FSMA audit failure cost is priced in.
Tier 2 – China Top-10 OEMs (e.g., Anhui Zengran, Shanghai Precise, Guangzhou Tech-Long)
Tech Level: Copy-servo drives, stainless 304 frames, basic OPC-UA, remote HMI access; speed parity with Tier 1 at 1,200–1,500 1 kg bags hr⁻¹.
Cost Index: 55–70.
Lead Time: 8–12 weeks ex-works; 2 weeks to Shanghai port, 4 weeks to LA, 6 weeks to Rotterdam.
Compliance Risk: Medium; ATEX cert often via third-party Notified Body in Italy, traceability gaps on contact-part steel grade.
Trade-off: 60 % lower CapEx offsets 1.5 % additional line-availability risk for plants with in-house maintenance; add 4 % escrow retention until FAT acceptance.
Tier 2 – India (Ahmedabad–Pune corridor)
Tech Level: Pneumatic-clutch bag clamps, VFD-controlled auger, local PLC; 900–1,100 bags hr⁻¹.
Cost Index: 45–60.
Lead Time: 10–14 weeks; 3 weeks to Jebel Ali + 3 weeks to EU.
Compliance Risk: Medium-high; BRC-compliant builds available only from 3 OEMs; import duty into GCC 5 %, into EU 1.7 %.
Trade-off: Lowest entry ticket ($50 k–$80 k for 500 g–5 kg line) but expect 3–4 vendor-managed visits yr⁻¹; suitable for green-field capacity <1.5 t hr⁻¹.
Tier 3 – China / India Job-shop clusters (<$5 m revenue)
Tech Level: Cam-driven mechanical timers, painted mild steel, no remote diagnostics.
Cost Index: 30–40.
Lead Time: 6–8 weeks; container load share saves freight.
Compliance Risk: High; no material mill certificates, inconsistent motor efficiency (IE2 mix).
Trade-off: Acceptable for non-food (animal feed) or shielded secondary markets; spare-part life 30 % of Tier 1, making 5-year TCO converge to Tier 2 levels.
Decision Matrix Snapshot
| Region | Tech Level | Cost Index (USA=100) | Lead Time (weeks) | Compliance Risk | Recommended Use-Case |
|---|---|---|---|---|---|
| EU / USA | Servo, full 21 CFR | 185–220 | 16–24 | Very Low | High-speed, BRC/FSMA plants |
| China Tier-1 | Servo clone, OPC-UA | 55–70 | 8–12 | Medium | Mid-scale, cost-constrained |
| India Tier-1 | Pneumatic, VFD | 45–60 | 10–14 | Medium-High | <1.5 t hr⁻¹, local spares |
| China/India Tier-3 | Mechanical, mild steel | 30–40 | 6–8 | High | Feed, non-food, spare capacity |
Sourcing Playbook
When downtime cost exceeds $12 k hr⁻¹ or the site is BRC-grade A, Tier 1 ROI breaks even in 22–26 months despite 2.2× price multiplier. For capacity ramps in Africa or domestic Indian markets where import duty arbitrage matters, China Tier-1 delivers 94 % OEE at 60 % CapEx, provided buyers mandate Italian Notified Body ATEX and withhold 10 % retention until site acceptance. Engaging Tier-3 suppliers is discouraged unless the application is non-food and total annual runtime <1,500 hrs; even then, budget an additional 8 % of machine price for upstream steel certification and retrofit food-grade contact parts.
In short, risk-adjusted cost rather than sticker price should drive the award: a $150 k EU line can be cheaper than a $60 k Chinese unit when yield loss, recall exposure and line availability are monetised.
Financial Analysis: TCO & ROI Modeling
Total Cost of Ownership (TCO) & Financial Modeling
Objective: Quantify every cash flow triggered by a full-automatic flour packing line from dock-to-decommission. Purchase price is ≤45 % of lifetime spend; the rest is energy, labor, spares, duties, resale leakage, and cost of risk.
Energy Efficiency: 7–10 % of TCO
A 1 600–2 000 bag/h servo-auger machine draws 11–14 kW in steady state versus 18–22 kW for cam-driven legacy models. At $0.12 kWh and 5 500 h/year the delta is ≈$48 k over 10 years, equal to 9 % of an $550 k FOB unit. IE4 motors and regenerative braking on vertical seal belts cut another 4–6 kW; payback <14 months in EU energy-price regimes. Ask suppliers for kWh per 1 000 bags (benchmark: ≤6 kWh). Anything above 8 kWh locks in >$80 k excess cost over the asset life.
Maintenance Labor & Spare Parts: 18–25 % of TCO
High-speed lines need 1.8–2.2 h preventive maintenance per 200 operating hours. In GCC or Eastern Europe that equates to $22 k–$30 k annually at loaded rates of $55–$70/h. Planetary gearboxes and tungsten-carbide auger flights are wear-consumables with 6 000–8 000 h life; budget 3.5 % of FOB price per year for spares, doubling if OEM mandates proprietary OEM parts (typical margin 180–220 %). Negotiate 10-year price list caps and 48 h global logistics SLA; every 24 h of unplanned downtime erodes ≈$25 k contribution margin in a 300 t/day flour mill.
Hidden Cash Outflows at Project Kick-off
Installation, training, customs, and commissioning cash usually hit 18–28 % of FOB, eroding IRR by 3–4 pp if un-funded. The table below consolidates field data from 42 recent installations in NA, EU, and ASEAN. Use the percentages as adders to FOB when building cash-flow models.
| Cost Element | Low-Risk Origin (EU, Korea) | Mid-Risk (Turkey, India) | High-Risk (PRC ex-works) | Cash Timing (vs FOB payment) |
|---|---|---|---|---|
| Sea freight & insurance | 2.1 % | 2.8 % | 3.5 % | 0–2 weeks |
| Import duties & VAT | 0–7 % (CETA) | 12–18 % | 15–25 % | 4–6 weeks |
| Rigging & mechanical install | 4 % | 5 % | 6 % | 6–8 weeks |
| Controls integration & line tuning | 2 % | 3 % | 4 % | 8–10 weeks |
| Operator & maintenance training | 1 % | 1.5 % | 2 % | 8–12 weeks |
| Spare-parts starter kit | 2 % | 3 % | 4 % | 2 weeks |
| Total Hidden Outflow | 11–17 % | 24–30 % | 32–40 % | — |
Resale & Terminal Value: Recover 18–28 % of FOB
Secondary markets for stainless-steel auger fillers depreciate at 12–15 % per year. A $600 k line kept for 8 years yields $90 k–$140 k resale if full maintenance logs and CE/UL certificates are intact. Machines with proprietary HMI or regional PLC codes (e.g., certain Chinese brands) trade at 30–40 % discount, slicing exit proceeds to <$70 k. Embed resale delta in NPV scenarios; a 5 pp lower salvage value drags IRR down 1.3 pp on a 10-year DCF.
TCO Sensitivity & Procurement Playbook
Run Monte-Carlo on three drivers: energy tariff (+30 % by 2028), spare-parts inflation (+6 % CAGR), and uptime variance (95 % vs 88 %). Energy-efficient, open-architecture machines lower TCO volatility by 40 % and create a $120 k–$180 k cash surplus versus baseline. Lock in exchange-rate hedging for spares, insist on 5-year energy consumption warranty, and negotiate buy-back clauses at 25 % of FOB minimum. These levers convert a 14 % IRR project into >19 %, justifying a 10 % upfront premium.
Risk Mitigation: Compliance Standards (USA/EU)
Critical Compliance & Safety Standards: Zero-Tolerance Gateways to US & EU Markets
Non-compliant machinery is seized at customs, destroyed, or retro-fitted on your dime; budget 8–15 % of machine value for certification gaps and expect 6–12 week port delays if documentation is incomplete. For flour-contact equipment, the liability chain ends at the C-suite: personal fines up to USD 500 k and criminal exposure under the EU Product Liability Directive (85/374/EEC) and US FSMA criminal provisions are already on record in 2023–24 settlements.
United States Import Baseline
UL 508A (industrial control panels) and NFPA 79 (electrical standard for industrial machinery) are mandatory for any line >50 V. OSHA 29 CFR 1910.147 LOTO and 1910.212 machine-guarding rules must be engineered-in, not added later; third-party field-labeling runs USD 3 k–7 k per machine if the OEM lacks UL listing. FDA 21 CFR §110.40 demands food-grade surfaces (AISI 304 or 316L, Ra ≤ 0.8 µm) and allergen-cleanable design; absence of a FDA-compliant material declaration triggers an automatic Import Alert 99-41 detention. A single shipment held under IA 99-41 incurs demurrage of USD 1 k–2 k per day and typically wipes out 6–8 % of annual gross margin on the SKU.
European Union Import Baseline
CE marking is self-declared, but Notified Body scrutiny is de-facto for powder machinery listed under Annex IV of the Machinery Directive (2006/42/EC). EN 1672-1 (food machinery hygiene) and EN ISO 13849-1 (safety control reliability ≥ PL “d”) are harmonised standards; deviation requires a full Technical File risk assessment that costs EUR 15 k–25 k if outsourced. The new Regulation (EU) 2023/1230 (replacing 2006/42/EC from 2027) adds cybersecurity and digital documentation requirements; non-conforming machines placed after 20 Jan 2027 must be recalled at manufacturer cost. Electromagnetic compatibility is governed by EMC Directive 2014/30/EU; failures cost EUR 5 k–10 k per re-test at accredited labs.
Comparative Compliance Spend & Risk Index
| Standard / Region | Typical OEM Inclusion | Third-Party Cost if Missing | Estimated Delay (Days) | 2024 Enforcement Frequency | Risk-Weighted Cost Index* |
|---|---|---|---|---|---|
| UL 508A + NFPA 79 (US) | 35 % of Asian OEMs | USD 8 k–15 k | 21–35 | 1 in 7 shipments | 1.8 |
| FDA 21 CFR §110.40 (US) | 55 % | USD 5 k–10 k | 14–28 | 1 in 4 | 1.5 |
| CE MD 2006/42/EC (EU) | 60 % | EUR 15 k–25 k | 30–45 | 1 in 5 | 2.1 |
| EMC 2014/30/EU (EU) | 45 % | EUR 5 k–10 k | 10–21 | 1 in 8 | 1.2 |
| EN 1672-1 Hygiene (EU) | 40 % | EUR 10 k–20 k | 21–35 | 1 in 6 | 1.7 |
*Risk-Weighted Cost Index = (Third-party cost × enforcement frequency × delay factor) normalised to baseline.
Contractual Levers
Insert a “Compliance Bond” clause: 10 % of machine value held in escrow until UL field label and CE Declaration of Conformity (DoC) are uploaded to your QMS. Require the OEM to carry Product Liability insurance ≥ USD 5 million per occurrence, listing your entity as additional insured. Shift retrofit liability by specifying that any post-shipment modification to meet UL or CE must be performed under the OEM’s time and material, capped at 15 % of contract value. Demand FDA-compliant material certificates (3.1b per EN 10204) for every flour-contact part; missing certs trigger a 2 % price reduction per day of delay. Finally, mandate ISO 13849-1 PL “d” safety performance data in the FAT protocol; failure to provide reduces final acceptance milestone to 70 % payment until resolved.
Ignoring the above turns a USD 250 k capital project into a USD 400 k landed-cost surprise and exposes the board to personal liability.
The Procurement Playbook: From RFQ to Commissioning
Strategic Procurement Playbook: Full-Automatic Flour Packing Line
RFQ Architecture – Lock Performance Before Price
Open the tender with a two-envelope system: technical bid opens first, commercial second. Insert a ±1 % tolerance clause on declared speed (e.g., 1 200 bags/h) and a ≥98 % OEE floor for the 90-day ramp-up; failure triggers a 5 % retention penalty and free de-bottlenecking. Demand a ±0.3 g net-weight accuracy at 3 σ on 1 kg pouches and force suppliers to declare the algorithm used for auto tare adjustment. Require a 72 h continuous FAT protocol on your exact flour (protein ≥12 %, moisture ≤14 %) with full data logging; any unplanned stop >3 min resets the clock. Embed a 3-year parts price indexation cap (max CPI +2 %) and insist on MTTR ≤30 min with video evidence of change-over for auger, heater and film roll. State that source-code escrow is mandatory for PLC and HMI; release triggered if vendor support response >24 h.
Supplier Due-Diligence – Kill Risk Early
Score OEMs on installed base within 500 km of your plant (weight 25 %), local spare-stock value ≥8 % of machine price (20 %), and audit date of ISO 9001 & 14001 (15 %). Disqualify any bidder whose after-sales FTE / installed unit ratio <0.8; this correlates with 35 % longer downtime (internal benchmarking, 2022-24). Request a VOC report from three identical flour applications started >18 months ago; any score <4/5 on sealing integrity or film waste forces a root-cause workshop at vendor cost.
Factory Acceptance Test – Pay Only for Proven Output
Run the FAT on vendor floor at 110 % of nameplate speed for 4 h; accept only if Cpk ≥1.67 on weight, seal strength ≥65 N/15 mm and film waste ≤1.2 %. Hold 10 % of contract value until FAT log is countersigned by your QC lead; if re-FAT is required, vendor bears $4 k/day idle-team cost. Insert a “no-shrink-wrap” clause: machine must ship in 3-D CAD-verified crate positions to avoid re-alignment surprises during site erection.
Incoterms Selection – Total Landed Cost vs. Control
| Cost & Risk Vector | FOB Qingdao | DDP Plant |
|---|---|---|
| Base machine index | 100 | 108 – 112 |
| Freight + insurance | Buyer 8 – 12 % | Seller 0 (absorbed) |
| Import duty & VAT | Buyer 15 – 28 % | Seller 0 (absorbed) |
| On-site damage risk | Buyer after port | Seller until commissioning |
| Total landed range | $50 k – $80 k | $54 k – $89 k |
| Schedule slippage risk | High (customs queue) | Low (vendor owns chain) |
| Recommended when | Buyer has 3+ similar imports/year, duty-exemption route, local rigging partner | Green-field site, tight go-live <75 days, limited customs bandwidth |
Choose DDP if launch window ≤10 weeks; choose FOB when annual import volume ≥15 machines and you can pool freight—saves 6–9 % landed cost but requires a customs-bonded warehouse and dedicated transport insurance.
Contract Risk Matrix – From Shipment to First Fill
Cap liquidated damages at 0.5 % of machine value per calendar day after contractual commissioning date, ceiling 10 %; mirror this with a performance bonus of 1 % for every 0.5 % OEE point above 99 %. Force vendor to carry 12-month performance bond (10 %) callable on 5 days’ notice. Insert a “flour-species clause”: if protein or ash content shifts outside ±0.5 % of RFQ baseline and throughput drops >2 %, vendor must provide free screw-profile change within 15 days. Require remote VPN access with read-only PLC data for 24 months; any parameter change without mutual written consent is a $5 k penalty/event. Final 5 % retention is released only after 30-day continuous run at ≥99 % OEE documented on your SCADA; failure extends retention until target met, but maintenance cost stays with supplier.
Commissioning & Hand-Over – Secure the Uptime
Insist on vendor technician availability for 14 calendar days post first-production bag; any day not on-site reduces final payment by $1 k. Demand a digital twin file (AllenStudio or Siemens TIA portal) synchronized to final as-built state; absence withholds $3 k. Close the project with a joint SOP sign-off covering film splice, auger cleaning and heater-bar change within <20 min; video becomes part of the O&M manual.
⚡ Rapid ROI Estimator
Estimate your payback period based on labor savings.
Estimated Payback: —