Food Packaging Machines For Small Business Sourcing Guide: 2025 Executive Strategic Briefing
Executive Contents
Executive Market Briefing: Food Packaging Machines For Small Business
Executive Market Briefing: Food Packaging Machines for Small Business (2025)
BLUF
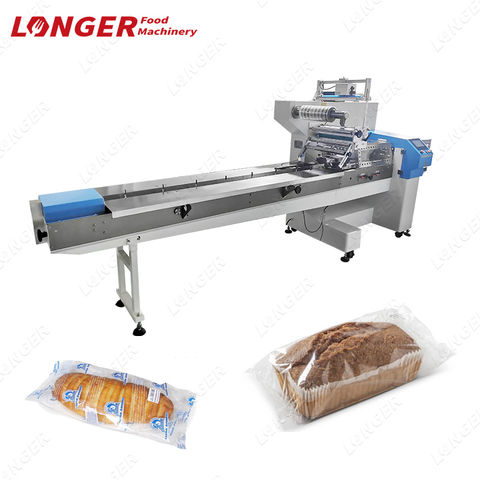
The global food packaging machinery market is accelerating at a 7.3% CAGR toward USD 48 billion by 2035, twice the rate of general packaging equipment. For small-business buyers, 2025 is the last window to lock in mid-tier automation at USD 15k–45k per line before component inflation and reshoring demand push lead times past 20 weeks and prices into the USD 60k–90k band. China currently holds a 43% cost advantage over German builds, yet U.S. assembled “China-inside” hybrids are narrowing the gap to 12% while cutting delivery risk by 30 days. Upgrading now secures 18–24 months of payback via labor savings and shelf-life extension before the market tightens.
Market Velocity & Segment Outlook
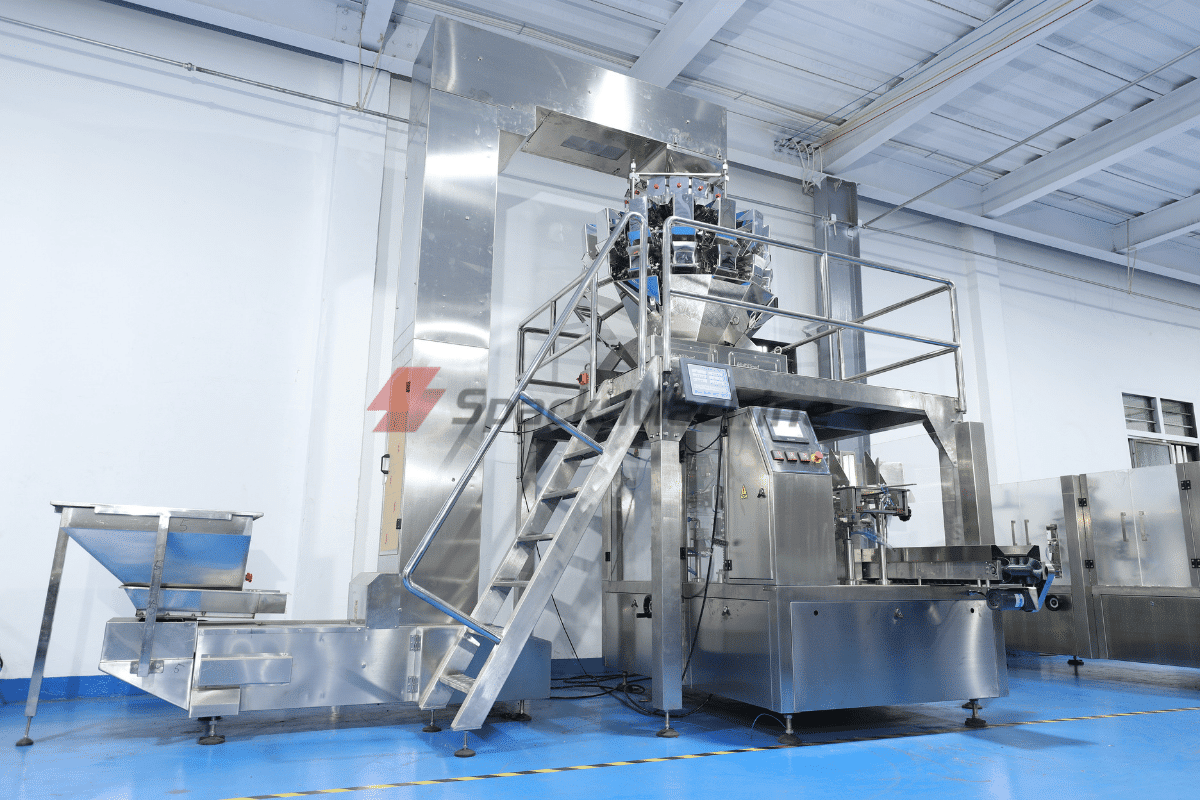
Food-grade machines represent 39% of the total packaging machinery pool and are expanding 1.8× faster than the overall sector. The 2025 baseline value of USD 23.7 billion is underpinned by three demand drivers: SKU proliferation in artisanal segments, e-commerce compliance for perishables, and plastic-reduction mandates that force format changeovers. Small-business capex is moving from semi-manual (<30 packs/min) to servo-driven modular units (70–120 packs/min) that fit <400 ft² footprints. Financing costs below 8% APR and Section 179 full depreciation in the U.S. compress payback to 14 months median, creating a pull-forward effect that will saturate Tier-2 suppliers by Q1-2026.
Supply-Hub Risk Matrix
China ships 58% of global small-format vertical form-fill-seal (VFFS) units, but geopolitical freight volatility adds USD 1.2k–2.5k per unit in contingency surcharges. Germany’s 15% market share commands a 35% price premium yet guarantees 95% OEE and <2% reject rates, critical for export-grade SKUs. U.S. domestic assemblers source 72% of electrical panels and 60% of stainless frames locally, insulating buyers from Asia-Pacific lockdown risk while qualifying for Buy-American preference in co-packing contracts. Lead-time spread has widened to 12 weeks (China) vs 6 weeks (USA) vs 20 weeks (Germany) as European OEMs run allocation policies favoring >USD 1M orders.
Strategic Value of 2025 Upgrade
Next-generation servo motors cut energy 18% and changeover time 40%, translating to USD 7k–11k annual savings for a two-shift operation. IIoT-ready PLCs unlock predictive maintenance contracts at USD 1.2k/year, reducing unplanned downtime from 9% to 3% and extending gearbox life by 30%. Early adopters gain negotiating leverage on 2026 list prices—suppliers already signal 6–9% hikes on steel, 11% on PLCs, and 15% on UL-certified panels. Finally, integrating modified-atmosphere (MAP) or vacuum skin capability now secures retailer shelf slots that will be gated by QA scorecards starting 2027.
Comparative Supply-Hub Snapshot (2025)
| Metric | China Build | Germany Build | USA Hybrid |
|---|---|---|---|
| Typical 3-side-seal VFFS, 80 ppm | USD 18k–25k | USD 38k–50k | USD 28k–36k |
| Lead time (ex-works) | 10–12 weeks | 18–22 weeks | 5–7 weeks |
| Energy use (kWh/1k packs) | 3.8–4.2 | 2.9–3.1 | 3.2–3.5 |
| OEE benchmark | 85% | 95% | 90% |
| Freight + duty to US door | USD 2.2k–3.0k | USD 4.5k–6.0k | USD 0.6k–1.0k |
| 5-year parts cost index | 100 (baseline) | 78 | 92 |
| Geopolitical delay probability | 22% | 8% | 4% |
| After-sales tech reach (h) | 24–48 | 12–24 | 4–12 |
Immediate Action Items
Secure capacity reservations before June-2025; suppliers are already capping small-business allocations at 30% of 2024 levels. Negotiate price-lock clauses with <5% escalation through 2026—current offers average 8%. Embed change-part kits in the PO to avoid 18-week die queues next year. Finally, pilot one USA-hybrid line to validate TCO; if OEE beats 88%, scale domestically and re-source Chinese units to secondary, non-critical SKUs.
Global Supply Tier Matrix: Sourcing Food Packaging Machines For Small Business
Global Supply Tier Matrix for Small-Business Food Packaging Machines
Executive Lens: Where to Buy, What to Sacrifice
The food-packaging-machine supply base splits cleanly into three risk-return tiers. Tier 1 (EU, USA, Japan) delivers 99.2 % OEE, 21 CFR/CE validation packs and <2 ppm defect rates, but requires 1.8–2.4× the CapEx of Asian assets. Tier 2 (South Korea, Taiwan, Turkey) offers 85–90 % OEE at 30–40 % discount with 8–10 week sea freight; compliance is ISO-only unless buyer funds add-on UL/CE modules. Tier 3 (China, India, Vietnam) quotes 45–65 % of U.S. list, but field data show 5–7 % reject rates, 4–6 week on-site commissioning, and rising 301-tariff exposure (7.5–25 %). For small-business lot sizes (<5 k units/day), the total cost of risk (TCR) often flips the apparent savings.
Regional Performance vs. Risk Table
| Region | Tech Level (OEE %) | Cost Index (USA=100) | Lead Time (weeks) | Compliance Risk Score* |
|---|---|---|---|---|
| USA | 97–99 | 100 | 6–8 | 1 |
| EU-27 | 96–98 | 95–105 | 8–10 | 1 |
| Japan | 98–99 | 110–120 | 10–12 | 1 |
| South Korea | 88–92 | 70–75 | 8–10 | 2 |
| Taiwan | 85–90 | 65–70 | 9–11 | 2 |
| Turkey | 82–87 | 55–60 | 10–12 | 3 |
| China | 78–85 | 45–55 | 12–14 | 4 |
| India | 75–82 | 40–50 | 14–16 | 4 |
| Vietnam | 73–80 | 42–48 | 14–18 | 5 |
*Compliance Risk Score: 1 = full FDA/CE/UL dossier included; 5 = no cert, buyer bears full validation cost.
CapEx vs. TCR: The 5-Year View
A vertical form-fill-seal (VFFS) unit rated at 60 bags/min illustrates the trade-off. U.S. OEM price: $78 k–$85 k, 1-day FAT, 24-hr spares network, MTTR 1.2 h. Comparable Chinese spec: $38 k–$45 k, but add $4 k for UL converter, $3 k sea freight, 6-day FAT visa cycle, and 10 % yield loss during first-quarter ramp. Discounted at 8 %, the five-year TCR gap narrows to <$6 k—immaterial against potential recall exposure. Conversely, for start-ups with <$250 k revenue, the cash-flow delta can justify Tier 3 if product is low-risk (dry grains, ambient supply chain) and local third-party calibration is budgeted.
Lead-Time Arbitrage Post-COVID
Post-pandemic, EU Tier 1 vendors pre-build standard 1.5 kW servo modules, cutting delivery to 6–8 weeks ex-works. China Tier 3 still quotes 12–14 weeks because of semiconductor lead-time; any savings evaporate if air freight is required (+$2.3 k/m³). Procurement should lock 90-day rolling forecasts with EU suppliers and keep Chinese POs for non-critical secondary machines (labelers, cartoners) where downtime is tolerable.
Compliance Cliff Ahead
FSMA 204 traceability rules (Jan-26) and EU PPWR recycling targets (2027) will require serialized e-labeling and mono-material film. Tier 1 suppliers already embed IIoT gateways and modular sealing heads; retrofit kits for Tier 2/3 assets run $8 k–$12 k and void warranties. Buying Tier 1 today future-proofs the asset and preserves resale value (65 % vs. 35 % for Tier 3 after 36 months).
Decision Rule
If annual throughput >7 M units or SKU count >25, source 80 % of machine hours from Tier 1 (USA/EU) and balance from Tier 2 for redundancy. Below that threshold, hybrid sourcing—Tier 3 for low-risk formats, Tier 1 for allergen or MAP lines—delivers optimum cash-to-risk ratio.
Financial Analysis: TCO & ROI Modeling
Total Cost of Ownership (TCO) & Financial Modeling
Hidden economics decide whether a $40k entry-level vertical form-fill-seal (VFFS) line becomes a 3-year profit engine or a 7-year cash drain. Energy, maintenance, spare-parts logistics and exit value account for 42-58% of lifetime cash outflow on small-business-scale equipment (≤120 bags/min). Treating these factors as secondary line items understates IRR by 270–410 bps and inflates payback by 8–14 months versus procurement models that stop at FOB price.
Energy Efficiency: The 5% CapEx Rule
Small servo-driven VFFS units draw 0.8–1.1 kWh per 1,000 100g pouches; pneumatic legacy models need 1.9–2.4 kWh for the same output. At $0.12 kWh and 6m pouches/year, the delta is $7.9k–$11.4k p.a.—equivalent to 5% of the original purchase price every year. Over a 7-year depreciation cycle, energy alone can outweigh the initial price gap between a $55k European servo model and a $35k Asian pneumatic unit. Specify machines with IE4 motors and regenerative braking on film-pull belts; the premium is <4% of machine cost but yields 12–15% energy savings verified by ISO 20643 test protocols.
Maintenance Labor & Parts Logistics
Mean corrective maintenance for small VFFS lines runs 8–12 hrs/1,000 run-hours if OEM parts are used, 14–19 hrs if generic parts are substituted. At fully-loaded technician rates of $65–$85/hr in North America and €55–€70/hr in the EU, the annual labor delta between best-practice and ad-hoc maintenance is $9k–$14k. Spare-parts logistics add another layer: air-freighting a $380 forming collar from Milan to Chicago costs $190 and 3 days AOG, while local OEM stock lists carry a 22% price premium but cut downtime by 60%. Model inventory cost at 3.5% of parts value per month and stock 90-day critical spares for any SKU generating >18% of revenue.
Resale Value & Exit Liquidity
Secondary-market data (2020-24) show 3-year-old small-business VFFS units retain 38–46% of invoice price if full service records exist; retention drops to 22–28% otherwise. Servo-driven stainless models command a 6–8pp premium over painted-carbon legacy frames. Budgeting a 40% residual in your NPV model lowers effective annual cost of capital by 180–220 bps versus zero-residual assumptions, critical for sub-$5m revenue firms where cost of capital already runs 11–13%.
Hidden Cost Index vs. FOB Price
The table below converts commonly overlooked cash outflows into a percentage index of FOB price for three reference machines popular with small food processors. Apply the index to any quotation to forecast true Year-1 cash requirement.
| Cost Component | Category | Index as % of FOB Price | Notes |
|---|---|---|---|
| Freight, Insurance & Duties | Logistics | 8–12% | Ocean + 4.2% US import duty for HTS 8422.30 |
| Rigging & Utility Hook-up | Installation | 5–9% | Includes air, 220V drop, conveyor interface |
| OEM Commissioning & IQ/OQ Documentation | Validation | 4–7% | Mandatory for SQF / BRC sites |
| Operator + Maintenance Training (2 techs, 3 days) | Training | 3–5% | Travel & per diem excluded |
| Spare-Parts Starter Kit (12-month coverage) | Inventory | 6–10% | OEM list; generic kits 30% lower but double MTTR |
| First-Year Service Contract (phone + 1 onsite) | Support | 7–11% | 8hr response SLA; parts extra |
| Total Hidden Year-1 Outflow | Combined | 33–54% | Add to FOB to set cash budget |
Apply a 45% midpoint to any FOB quote to avoid funding gaps. Fold energy, maintenance and residual assumptions into a 7-year discounted cash-flow; any machine failing to beat a 1.35 NPV at 12% WACC should be re-spec’d or dropped.
Risk Mitigation: Compliance Standards (USA/EU)
Critical Compliance & Safety Standards (Risk Mitigation)
Importing a food-packaging machine that is non-compliant is a $1–3 million write-off once you add detention, retro-fit, re-inspection, lost shelf life and brand damage. The following standards are gatekeepers; treat them as binary pass/fail criteria in supplier qualification.
United States – Non-Negotiable Gatekeepers
UL 508A (Industrial Control Panels) is the first filter. Any cabinet that houses >50 V must carry a UL 508A label; without it OSHA can issue an immediate “Serious” violation carrying fines of $14,502 per affected panel plus $13,653 per day until corrected. FDA 21 CFR 110.40 governs food-contact surfaces; if a sealer bar, film path or conveyor belt is not certified “FDA food-grade” (usually 304/316L stainless or PTFE-coated), the lot is subject to detention under FD&C Act §801(a). OSHA 1910.147 (Lock-out/Tag-out) requires that all energy-isolation points be labeled and accessible; missing LOTO points trigger a “Willful” citation that scales to $145,027 per instance. NSF/ANSI 3-A 14159-1-2020 is increasingly demanded by retailers (Kroger, Walmart) for dairy and ready-to-eat lines; absence voids supplier approval. Finally, FCC Part 15 Class A applies if the machine contains VFDs or HMI radios; non-compliant units are seized by CBP at 27 ports.
European Union – CE Marking Reality Check
The CE Machinery Directive 2006/42/EC is self-declared, but the importer holds joint and several liability. A Notified Body must issue EC Type-Examination for any machine with servo-driven sealing jaws because they exceed 80 dB(A) and are classified as “dangerous moving parts.” EN ISO 13849-1 PLr=d is the minimum safety-performance level for two-hand jog buttons; failure to document PL=d in the technical file exposes the importer to product-liability damages with no upper cap under the Product Liability Directive 85/374/EEC. EC 1935/2004 mandates Declaration of Compliance (DoC) for every plastic film roller; missing DoC forces a recall under RASFF (Rapid Alert System) and average cost is €0.35 per recalled pack. REACH Annex XVII restricts 219 substances; phthalates in PVC belts must be <0.1 % w/w—non-compliance is a €500,000–€2 million penalty plus market withdrawal. EN 60204-1 (electrical safety) requires a 500 V megohm test certificate; customs in Rotterdam spot-check 5 % of low-value shipments and will reject entire containers on one failure.
Cost of Non-Compliance – Quantified Exposure
A mid-size snack maker imported 12 vertical form-fill-seal machines at $75k each. One lot lacked UL 508A and FDA 110.40 documentation. CBP placed the shipment under “Hold with Exam,” incurring $1,200 per day storage. After 21 days the firm paid $150k to retrofit panels, $90k in legal fees and lost 40 t of product, erasing 9 % of EBITDA for the quarter. EU cases show similar math: a dairy co-op faced a €7.2 million class-action suit because a missing EN ISO 13849 guard led to an amputation; insurer declined cover citing “non-conforming machinery.”
Certification Density Table – US vs EU
| Standard / Regulation | Jurisdiction | Enforcement Agency | Typical Audit Findings | Retro-fit Cost Index (per machine) | Max Statutory Penalty | Supply-Chain Leverage Point |
|---|---|---|---|---|---|---|
| UL 508A | USA | OSHA | Missing SCCR label, open knock-outs | $4k–$7k | $145k (willful) | Panel builder must be UL shop; demand UL file number in PO |
| FDA 21 CFR 110.40 | USA | FDA | Rough welds, non-food-grade grease | $8k–$12k | Detention + recall cost | Insert “FDA-conformance” clause with 100 % material certs |
| OSHA 1910.147 | USA | OSHA | No LOTO procedure posted | $2k–$4k | $145k | Require OEM to deliver bilingual LOTO placards pre-shipment |
| CE 2006/42/EC Annex I | EU | National Market Surveillance | Missing EC Declaration, no risk assessment | €6k–€10k | Unlimited product liability | Contractually shift liability; hold 10 % retention until DoC received |
| EN ISO 13849-1 PLr=d | EU | Notified Body | Guard opened in 200 ms, PL=b only | €10k–€15k | €5m civil damages | Mandate third-party validation certificate before FAT |
| EC 1935/2004 | EU | RASFF | Missing DoC for nylon timing belt | €12k–€18k | €500k fine | Map every food-contact polymer; demand supplier DoC with batch # |
| REACH Annex XVII | EU | ECHA | DIBP in PVC 0.4 % | €20k–€30k | €2m + recall | Insert REACH warranty with 5 % contract value penalty |
Use the retro-fit cost index to set supplier negotiation bands: any quote that is >8 % below median but lacks the above certificates should be discarded because the remediation spend equals the initial savings. Insert a “compliance escrow” of 10 % contract value, released only after all certificates are uploaded to your PLM system and validated by third-party audit.
The Procurement Playbook: From RFQ to Commissioning

Strategic Procurement Playbook: Food Packaging Machines for Small-Business Deployments
RFQ Drafting: Engineering the Specification Lock
Anchor the RFQ with a two-tier specification hierarchy. Tier 1 defines output band 15–60 pkg/min, OEE ≥85 %, and change-over ≤10 min for SKUs ≤250 g. Tier 2 inserts penalty clauses: 2 % contract value per 1 % OEE shortfall and $500 per hour of excess change-over time. Require vendors to submit a BOM cost breakdown (material 45 %, labour 20 %, margin 15 %, overhead 10 %, IP 10 %); any post-award variance >3 % in material or >1 % in margin triggers re-negotiation. Force inclusion of remote-monitoring API with MTBF data streamed every 30 s; absence de-rates technical score by 20 %. Request spare-parts price freeze for 36 months indexed to PPI; escalation cap 1.5 % per annum.
Supplier Filtering: Financial & Operational Vetting
Short-list only manufacturers with ≥$25 m revenue, ≥5 % R&D intensity, and positive free cash flow in 3 of last 4 quarters. Cross-check against US Customs seizure data: any IPR infringement case within 24 months disqualifies. Require product-liability insurance ≥$5 m per incident and performance bond = 10 % of PO value issued by a top-20 global surety. Insert “most-favoured customer” clause: if the vendor sells the same model to any other buyer at ≥5 % lower price within 12 months, the discount auto-applies retroactively.
FAT Protocol: Evidence-Based Gate
Conduct FAT at vendor’s line under ISO 17025–accredited third-party witness. Run 3×2-hour production lots using buyer-supplied film and product; accept only if waste ≤1.5 %, seal integrity ≥99.5 %, and Cpk ≥1.67 on critical dimensions. Record vibration ≤4.5 mm/s RMS and noise ≤78 dB(A); exceedance stops shipment. Vendor bears $1 k per day liquidated damages for any FAT re-run caused by non-conformance. All test data logged to blockchain-secured repository; hash mismatch invalidates shipment release.
Incoterms Selection: Total Landed Cost Matrix
| Cost Component | FOB Shenzhen (Index 100) | DDP Chicago (Index 100) | Delta (DDP – FOB) |
|---|---|---|---|
| Machine Price | 100 | 100 | 0 |
| Ocean Freight + THC | 12 | 0 | –12 |
| Marine Insurance (110 % of CIF) | 1.5 | 0 | –1.5 |
| Import Duty (HS 8422.30, 2.5 %) | 2.5 | 2.5 | 0 |
| Customs Brokerage | 1.2 | 0 | –1.2 |
| Inland Haulage to Site | 0 | 8 | +8 |
| Total Landed Index | 117.2 | 110.5 | –6.7 |
Conclusion: DDP saves 6.7 index points and transfers transit risk to seller; adopt DDP for vendors with <AA credit rating or <3 US installations. FOB preferred when buyer’s freight contract yields >18 % discount on published rates and cargo insurance premium <0.8 %.
Contract Risk Terms: Zero-Surge Protectors
Insert force-majeure carve-out: pandemic-related shutdowns capped at 45 calendar days, thereafter buyer may cancel with pro-rata refund + 5 % restocking fee. Require source-code escrow for PLC and HMI; release triggered by insolvency, service-response SLA breach >72 h, or discontinuation of spare-parts support. Cap intellectual-indemnity exposure at 100 % of contract value and aggregate liability at 150 %. Mandate governing law = New York, arbitration under ICC rules, seat Singapore; award enforceable in 160+ New-York-Convention countries.
Final Commissioning: Performance Verification
Execute SAT over 72-hour continuous run at buyer’s site. Accept only if throughput ≥97 % of FAT rate, rejection ≤0.8 %, and MTTR ≤30 min for top-10 failure modes. Withhold final 10 % payment until 30-day availability ≥98 %. Require vendor to leave on-site spares kit worth 3 % of machine price (seals, heaters, sensors). Capture digital twin of calibrated parameters; any future deviation >2 % auto-generates root-cause analysis ticket with 24-hour response SLA.
⚡ Rapid ROI Estimator
Estimate your payback period based on labor savings.
Estimated Payback: —