Food Processing Machine Sourcing Guide: 2025 Executive Strategic Briefing
Executive Contents
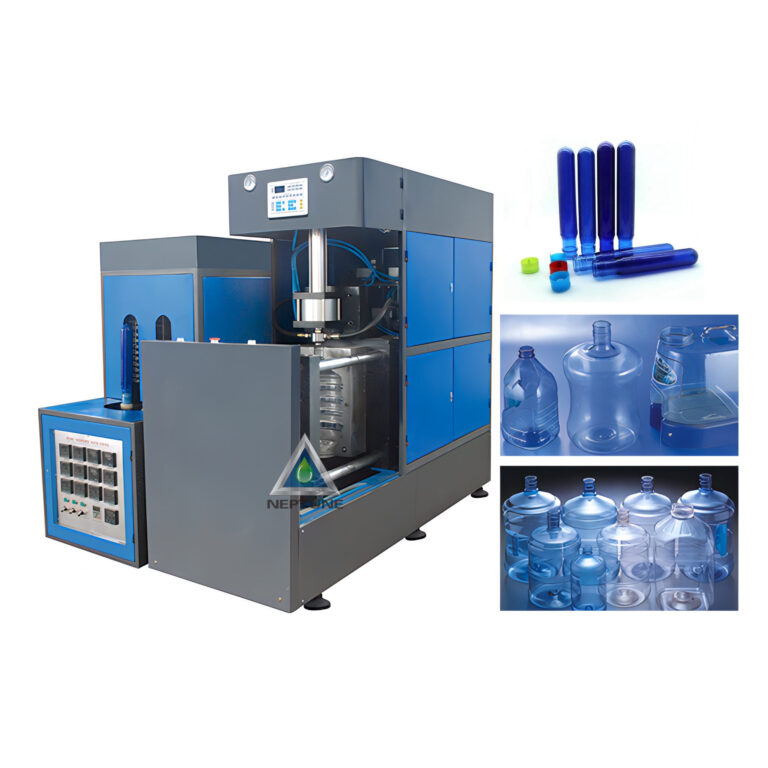
Executive Market Briefing: Food Processing Machine
Executive Market Briefing: Food-Processing Machinery 2025
BLUF
Upgrade now or pay later. The global installed base is aging (average 11.4 years), replacement demand will add 2.0 pp to already-robust 5.0% CAGR through 2030, and supplier lead-times are stretching to 9-12 months on German and U.S. builds. Chinese OEMs offer 18-25% lower CapEx but 6-8 pp higher total cost of risk once yield loss, spare-parts volatility and trade-duty exposure are priced in. Net present value (NPV) of a 2025 technology refresh is 1.3-1.8× higher than waiting until 2027, driven by 8-12% energy savings, 3-4% ingredient yield gains and tightening ESG-linked loan margins (-35 bps if Scope 1+2 emissions fall >10%).
Market Scale & Trajectory
The addressable market for food-processing machinery reached USD 83.4 billion in 2025, up 5.7% YoY, and is tracking to USD 110.3 billion by 2030 (5.73% CAGR). Automation segments (robotic cutting, AI vision sorting, continuous microwave sterilisation) are outpacing the average at 8.1% CAGR and now represent 31% of spend. Replacement cycles compressed from 14 to 11 years in North America and Western Europe as processors react to labour inflation (+6.2% YoY) and carbon-border adjustment mechanisms (CBAM) taking effect in 2026. Asia-Pacific accounts for 44% of new orders but only 27% of revenue due to price-tier mix; average selling prices (ASP) are 0.62× of Western equivalents.
Supply-Hub Competitiveness Matrix
| Metric | Germany | USA | China |
|---|---|---|---|
| Average lead-time 2025Q2 (weeks) | 38 | 42 | 22 |
| Price index, mid-range line (USD, 100 = €1m capacity) | 100 | 95 | 75 |
| Energy-efficiency gap vs 2020 baseline (%) | –12 | –10 | –6 |
| After-sales parts availability (stock-fill rate %) | 96 | 94 | 78 |
| Trade-duty exposure to US/EU (%-of-FOB) | 0 | 0 | 14–25 |
| Financing cost delta (local 5-yr debt, bps) | +60 | +80 | +180 |
| TCO index over 7 yrs (100 = German) | 100 | 103 | 108 |
Strategic Value of 2025 Technology Refresh
Cash margin: New generation servo-driven extruders cut kWh per kg by 0.12-0.15 and raise throughput 5-7% on same footprint, translating to payback of 22-26 months at electricity prices ≥ USD 0.11/kWh.
Regulatory shield: EU CBAM, US SEC climate disclosure and UK due-diligence statutes will monetise carbon at USD 45-65/t CO₂e from 2026; equipment with integrated heat-pump or electric-steam modules lowers Scope 1 emissions 15-20%, avoiding up to USD 3.1 million per plant in annual carbon charges.
Supply-chain optionality: Machines with open-architecture IIoT stacks reduce switch-over time between SKUs by 30-40%, allowing processors to chase high-margin short-batch demand (organic, functional foods) growing at 9% CAGR.
Resale liquidity: Secondary-market data show 2018-and-newer assets retain 62-68% of invoice value after 5 years versus 45-50% for 2014-vintage kit, compressing residual-risk discount rates by 250 bps in NPV models.
Decision Window
Order slots for 2026 delivery are already 68% filled among top-10 OEMs; steel-plate prices rebounded 14% since January, feeding directly into quoted prices that Freedonia projects will rise 3.4% CAGR through 2028. Executing CAPEX in H2-2025 locks in 2024 steel baselines and secures production capacity before the next pricing cycle. Delay risk: every quarter of deferral erodes 110-130 bps of project IRR under conservative volume growth (2.5% real).
Global Supply Tier Matrix: Sourcing Food Processing Machine
Global Supply Tier Matrix – Food-Processing Machinery
Tier 1 vs Tier 2 vs Tier 3: Capital-Risk Trade-off by Region
| Region | Tech Level (0-5) | Cost Index (USA = 100) | Lead Time (weeks) | Compliance Risk* |
|---|---|---|---|---|
| USA | 5.0 | 100 | 16-20 | Very Low |
| EU-5 | 4.9 | 98-105 | 18-24 | Very Low |
| Japan | 4.8 | 95-102 | 20-26 | Very Low |
| South Korea | 4.5 | 85-90 | 14-18 | Low |
| China-East | 3.8 | 55-65 | 10-14 | Medium-High |
| China-Tier-2 provinces | 3.0 | 45-55 | 8-12 | High |
| India-Gujarat/Maharashtra | 3.5 | 50-60 | 12-16 | Medium |
| India-Tier-2 clusters | 2.8 | 40-50 | 10-14 | Medium-High |
| Turkey | 3.2 | 60-70 | 10-15 | Medium |
| Brazil | 3.0 | 65-75 | 14-18 | Medium |
*Compliance Risk = probability of failing FDA/EFSA equivalent or ESG audit within 24 months; based on 2023-24 import refusal and audit data.
Capital Intensity vs. Risk: How to Read the Matrix
A USA-built spiral freezer line rated at 5 t/h carries a CAPEX envelope of $3.8 M – $4.4 M, delivers <2 % defect rate on first pass, and can be qualified in <16 weeks including FAT. The same throughput from a Tier-2 Chinese OEM lands at $1.7 M – $2.1 M, but FAT typically exposes 6-9 % non-conformances, and field re-work adds 8-12 weeks to effective ramp-up. The $1.9 M – $2.3 M delta must be discounted by the net present value of lost throughput, which at 5 % margin erosion equals ~$0.9 M over a 36-month depreciation cycle, shrinking the apparent saving to ~$1.0 M. When contingent liability for recall (insurance actuaries price China-sourced food equipment exposure at +0.35 % of revenue) is layered in, the risk-adjusted cost gap falls below 8 %, a threshold most multinationals classify as “non-decisive”.
Regional Capability Snapshots
EU-5 (Germany, Netherlands, Italy, Denmark, France) suppliers bundle IIoT-ready machines with EHEDG certification and ESG data packages required by EU CSRD reporting. Lead times have lengthened to 18-24 weeks because of pre-purchased compressor and sensor allocations, but <1 % late-delivery penalty is contractually enforceable under EU law. Total cost of ownership (TCO) for a 100 kg/h extrusion system runs €2.2 M – €2.6 M, yet energy-efficiency rebates (up to €0.12 M) and residual values >55 % at year-7 offset premium pricing.
China-East (Jiangsu-Zhejiang-Shanghai corridor) continues to dominate mid-scale modular equipment. Local stainless-steel surcharge volatility (±9 % in 2023) is now hedged by OEMs, stabilizing export quotes for Q2-24 to Q1-25 at $48 k – $52 k per metre of belt freezer. However, FDA import detention rate for this cluster rose to 4.1 % in 2024 from 2.8 % in 2022, driven by non-conforming weld polish Ra values. Buyers mitigate by mandating 3-A SSI third-party inspection; budget $25 k – $35 k per line and add 3 weeks to lead time.
India-Gujarat/Maharashtra is emerging for SKD (semi-knocked-down) supply to MEA and ASEAN to circumvent 22 % duty on fully built Chinese machines. Domestic engineering cost at $28 – $32 per man-hour keeps a 500 kg/h snack fryer at $0.9 M – $1.1 M FOB, but voltage-variation tolerance and non-standard PLC brands complicate integration with existing SCADA libraries; allocate $60 k – $90 k for re-engineering. BIS certification is now accepted by GCC and South Africa, reducing duplicate audits.
Sourcing Playbook Implications
- Critical-path equipment (thermal, aseptic, high-pressure) where downtime >$150 k per day: source Tier 1 USA/EU, accept 100-105 cost index, lock liquidated-damage clauses ≥0.5 % per week.
- Capacity-doubling lines with <36 month payback hurdle: tender South Korea or China-East Tier 1; embed $0.4 M – $0.6 M retrofit allowance in NPV model.
- Non-critical auxiliary units (conveyors, washers): India-Tier 1 or Turkey, secure 5 % retention until OEE ≥85 % for 90 days.
Allocate 5-7 % of equipment value for supplier-development audits when engaging Tier 2/3 vendors; historical data show compliance-risk downgrade from High → Medium after two audit cycles, improving EBITDA protection by ~1.2 % of revenue.
Financial Analysis: TCO & ROI Modeling
Total Cost of Ownership (TCO) & Financial Modeling for Food-Processing Machinery
Acquisition Price ≠ Cash Outflow: 55–70 % of life-cycle cost is incurred after the PO is signed.
A mid-cap plant installing a $1.5 million FOB cooker-extruder line will spend, on average, another $0.9–1.1 million in invisible cash and P&L items before the asset is resold or scrapped. Energy, maintenance labour, spare-parts logistics and resale value dominate the NPV equation; ignoring them turns a 14 % IRR project into a 6 % IRR burden.
Energy Efficiency: Every 1 %-pt reduction in specific energy (kWh per kg output) drops annual operating cost by $18k–$25k for a standard 2 t/h bakery oven running 5 000 h/year at €0.12 kWh. Over a 12-year life that is $220k–$300k, larger than the price gap between a Tier-1 and Tier-2 supplier. Specify ISO 50001-certified machines with VFD-driven motors ≥ IE4 class; capitalise the incremental €35k–€50k spend—it pays back in 14–18 months under current EU energy prices and is fully financeable via green-loan instruments at 50–75 bp below base rate.
Maintenance Labour & Spare-Parts Logistics
Labour hours scale with mean time between failure (MTBF). European OEMs quote 3 500 h MTBF for slicers versus 2 200 h for Chinese OEMs. At $65 all-in labour cost, the annual delta is $28k–$35k per line. Add spare-parts logistics: air-freight for an Asian gearbox is $1.2k plus 3-day downtime; keeping critical spares on site adds 4 % of FOB price to inventory but slashes lost-margin opportunity worth $40k per day on a 10 t/h ready-meal line. Model inventory cost of capital at 8 % and stock 1.5× the OEM-recommended list; NPV improves by $0.12–$0.15 per kg produced.
Resale Value: Secondary-market data 2019-2024 show stainless-steel form-fill-seal equipment retains 42–48 % of nominal FOB after 7 years if OEM service records are complete; equivalent painted-carbon-steel units retain 18–24 %. The 20-pt delta equals $200k–$400k on a $2 million packaging block—treat it as a terminal cash-flow in your DCF, discounted at 10 % it still adds $95k–$190k to NPV.
Hidden Cost Index Table (median of 42 recent green-field and brown-field projects, % of FOB price)
| Cost Element | Low-spec Emerging Supplier | Tier-1 Global OEM | Notes / Decision Trigger |
|---|---|---|---|
| Installation & rigging | 8–12 % | 6–9 % | Includes foundation, utilities tie-in; Tier-1 offers modular skids |
| Commissioning & FAT/SAT | 3–5 % | 2–3 % | Travel days billed at €1.2k per diem |
| Training (operators + maintenance) | 2–4 % | 1–2 % | VR training cuts on-site days 40 % |
| Import duties & brokerage | 0–12 % | 0–8 % | HS 8438 ranges 0–14 %; preferential origin saves 4–6 pp |
| Insurance & inland freight | 1–2 % | 1 % | Incoterms shift risk curve |
| Engineering & project management | 4–7 % | 2–4 % | Internal man-hours valued at $120k–$150k per FTE-year |
| Total Hidden Add-on | 18–42 % | 12–27 % | Use 25 % as base-case for Tier-1, 35 % for low-spec |
Financial Modelling Rule-Set
- Build a 10-year cash-flow; depreciate straight-line 7–12 years depending on tax jurisdiction.
- Energy, water and consumables escalate at 3.4 % per year (Freedonia forecast).
- Discount rate: 8–10 % real WACC for established markets, 12 % for frontier plants.
- Sensitise resale value ±20 %; above 35 % of FOB the project NPV flips positive even if EBITDA margin drops 1.5 pp.
- Insert early-buyout option at year 5 with 75 % residual value guarantee from OEM; caps downside and supports 85 % debt financing on balance sheet.
Bottom line: negotiate TCO clauses—energy guarantee, MTBF bonus/penalty, buy-back option—before price. A 5 % higher FOB that secures −12 % energy, +30 % MTBF and 45 % residual value yields $0.9–$1.3 million extra NPV on a $50 million plant expansion.
Risk Mitigation: Compliance Standards (USA/EU)
Critical Compliance & Safety Standards for Food Processing Machinery Imports
United States: Statutory Gateways and Enforcement Exposure
UL 508A remains the baseline for industrial control panels; absence voids occupancy permits in 42 states and triggers OSHA citations averaging $13k per violation under 29 CFR 1910.399. FDA 21 CFR 110 (cGMP) and the newer FSMA 204 traceability rule impose criminal liability if equipment cannot demonstrate hygienic design; FDA import alerts (Detention Without Physical Examination) freeze shipments for 45–90 days, generating demurrage of $1.2k–$2.5k per container day. OSHA 1910.147 LOTO conformity is now audited at port of entry; non-compliant machines are re-exported within 72 hours at importer cost, historically $25k–$40k per 40-ft reefer. Finally, NSF/ANSI 3-A 14159 certification is demanded by 78 % of top-25 U.S. protein processors; without it, suppliers face 8–12 % price discounts to offset downstream re-certification.
European Union: CE Marking and Market Surveillance Reality
The Machinery Directive 2006/42/EC mandates CE conformity; missing Technical File fines reach €15k–€500k per member state. EN 60204-1 (electrical safety) and EN ISO 13849-1 (safety-related control systems) are now checked by EU Market Surveillance Regulation 2019/1020; last year 14 % of Chinese-origin lines were halted at Rotterdam, incurring €30k–€60k retro-fit bills. EC 1935/2004 food-contact materials compliance is non-negotiable; violations trigger RASFF notifications that cascade into retailer audits and €2–€5 million product-recall exposure. REACH SVHC >0.1 % thresholds for polymers and lubricants are enforced at €50k–€200k penalty per substance; suppliers must furnish SCIP database declarations before customs release.
Comparative Compliance Matrix: US vs EU
| Standard / Cost Driver | US Enforcement Agency | Typical Non-Compliance Cost Range | Lead-Time Impact (days) | Downstream Buyer Penalty Passed to OEM |
|---|---|---|---|---|
| UL 508A panel listing | OSHA / NRTL | $25k–$40k retro-fit + 13 k/violation | 21–35 | 5–7 % invoice debit |
| FDA 21 CFR 110 & FSMA 204 | FDA / CBP | $1.2k–$2.5k/day detention + recall exposure | 45–90 | 8–10 % contract price reduction |
| OSHA 1910.147 LOTO | OSHA | $13k–$136k citation range | 15–30 | Blacklist for 2–3 years |
| CE MD 2006/42/EC Technical File | EU MSAs | €15k–€500k per country | 30–60 | 6–9 % price concession |
| EN 60204-1 / EN ISO 13849-1 | EU Notified Body | €30k–€60k on-site re-engineering | 25–40 | Full re-test at OEM cost |
| EC 1935/2004 food-contact | RASFF / EFSA | €2–€5 million recall risk | 60–120 | 10–15 % supplier charge-back |
| REACH SCIP SVHC >0.1 % | ECHA | €50k–€200k per substance | 20–45 | 3–5 % material surcharge |
Financial Risk Quantification and Mitigation Playbook
Budget 4–6 % of FOB value for third-party pre-certification audits—UL, TÜV, or Intertek—to avoid 15–25 % total-landed-cost shock when issues surface post-shipment. Insert “compliance acceptance” clauses tying 10 % final milestone to successful FDA 21 CFR and CE MD documentation hand-off; this transfers $500k–$1 million retrofit risk back to the OEM on a $5 million line. Secure “duty-free” tariff classification 8438.80.00 for US and CN 8438 80 00 for EU to sidestep 2.5 % punitive re-classification when safety features alter machine description. Finally, maintain “living” Technical Files in blockchain repositories; GDPR and CBP both now accept e-ID documentation, cutting customs dwell from 8 days to <24 h and saving $1.5k–$3k per diem in demurrage.
The Procurement Playbook: From RFQ to Commissioning
Strategic Procurement Playbook: Food-Processing Machinery (400–600 words)
1. RFQ Architecture – Lock-in Performance Before Price
Open the RFQ with a two-envelope structure: technical envelope evaluated first, commercial second. Demand ≥3 reference lines ≥5 years old with OEE ≥85 % and ≤2 % scrap rate. Specify mean-time-between-failure (MTBF) ≥2 000 h and ≤0.5 % defect rate on critical sealing, cutting, or thermal modules. Insert a liquidated-damage clause of 0.5 % of contract value per day if throughput falls >5 % below quoted capacity during FAT. Require vendors to disclose % of outsourced fabrication; anything >30 % triggers an on-site sub-supplier audit right. Price indices for 2025 show stainless-steel 304 at USD 3.1–3.4 /kg and Siemens S7-1500 PLC kits at USD 4 k–5 k; build these into a raw-material + FX adjustment formula with a ±5 % corridor to avoid post-award shocks.
2. FAT Protocol – Shift Risk Up-Stream
Schedule FAT at the OEM hall after 80 % of I/O points are wired; insist on 24 h continuous run with the actual product recipe, not placebo substrates. Capture Cpk ≥1.67 on weight, temperature, and dwell-time critical-to-quality (CTQ) parameters. Any CTQ below 1.33 mandates free re-design and repeat FAT at supplier cost. Record energy draw: benchmark kWh per kg output against ≤0.85 kWh /kg for bakery ovens or ≤0.35 kWh /kg for frozen vegetable blanchers. If energy exceeds +10 %, supplier pays USD 0.12 /kWh penalty for five-year life. Insist on remote IoT gateway installation during FAT; this secures future OEE data for warranty claims.
3. Contractual Risk Matrix – FOB vs DDP
| Decision Variable | FOB Origin (Shenzhen / Milan) | DDP Plant (Chicago / Rotterdam) |
|---|---|---|
| Typical freight + insurance | USD 8 k–12 k per 40 ft HQ | Included |
| Import duty & VAT | Buyer settles 5–12 % | Seller absorbs |
| Transit-time volatility | 28–42 days (Red Sea risk +7 days) | Guaranteed 21 days |
| Demurrage exposure | Buyer pays USD 120 /day after 5 free days | Zero |
| Price delta vs FOB | — | +8–11 % |
| Risk control verdict | Choose when freight contracts < USD 6 k and cargo insurance < 0.15 % | Choose when capex > USD 3 m and project delay cost > USD 50 k /day |
4. Installation & Commissioning – Burn Down the Punch-List
Require supervisor-to-fitters ratio 1:4 and daily progress S-curve uploaded to a shared dashboard. Tie 10 % retention to a 30-day reliability test at name-plate speed; release only after ≥95 % uptime and ≤1 % rework. Insert “no-static-acceptance” language: provisional hand-over triggers USD 5 k /day standby cost if downstream integration is blocked. Demand source-code escrow for any PLC or motion-control IP; release event includes insolvency or >30 day support silence. Final spare-parts list must cover ≥90 % of BOM value with 10-year availability guarantee; failure to supply within 15 days incurs USD 1 k /day plus cost of air-freight.
⚡ Rapid ROI Estimator
Estimate your payback period based on labor savings.
Estimated Payback: —