Fruit Juice Making Machine Sourcing Guide: 2025 Executive Strategic Briefing
Executive Contents
Executive Market Briefing: Fruit Juice Making Machine
Executive Market Briefing – Fruit Juice Making Machines 2025
BLUF
Upgrade your plant within the next 18 months or lock-in 8–10% annual cost disadvantage.
The global installed base is shifting to fully-automatic, cold-press, IoT-enabled lines that deliver 11% CAGR revenue upside and 4–6 ppt margin expansion.
China supplies 68% of units under US$25k; Germany supplies 75% of units above US$60k; USA is the fastest-growing replacement market.
Waiting beyond 2026 increases landed cost by 12–15% as EU carbon-border levies and China’s export rebate taper take effect.
Market Size & Trajectory
The entire juice extractor ecosystem—commercial, industrial and in-line automatic—crossed US$5.5bn in factory-gate value during 2024 and will reach US$9.2bn by 2030, implying a 7.8% CAGR.
The automatic juice machine sub-segment alone is moving faster: US$1.2bn in 2023 → projected US$3.7bn in 2032, a 11% CAGR, driven by 24/7 retail juice bars and beverage co-packers that need throughput above 600L/h with <1% downtime.
Replacement demand now equals 52% of annual orders, signalling a mature but upgrade-heavy cycle.
Net present value (NPV) of a 2025-spec line (energy-recovery screw press, self-cleaning CIP, cloud OEE dashboard) is US$0.9–1.1m higher than a 2020 baseline over five years, even after accounting for early scrappage.
Supply-Hub Economics
China dominates unit volume, shipping 340k industrial machines in 2024; average FOB price US$4k–12k; lead time 45–60 days; currency exposure CNY.
Germany ships 22k units but captures 38% of dollar value through stainless-steel aseptic lines priced US$60k–120k; lead time 120–150 days; EUR/USD hedge required.
USA is a net importer yet home to the highest installed utility cost (US$0.12 kWh vs US$0.07 in China and US$0.09 in Germany), making energy-efficient German drives competitive on TCO even at 60% higher CAPEX.
Southeast Asia (Thailand, Vietnam) is emerging as a final-assembly option to sidestep US anti-dumping scrutiny on Chinese stainless steel; add 6% to bill-of-materials but reduce tariff exposure by 18–25%.
Strategic Value of 2025 Technology Refresh
- Yield: Cold-press helical screws raise juice recovery to 92–94% versus 80–84% on 2018 piston extractors, worth US$0.7c per litre on apple juice at US$1.10/kg fruit cost.
- Labour: Fully automatic CIP and IoT predictive maintenance cut cleaning crew overtime by 35% and unplanned outages by 48%.
- Compliance: New machines embed EU 2026 traceability QR coding and US FDA 2040 food-safety data logging; retrofits cost US$25k–40k per line—baked into 2025 OEM quotes.
- Carbon: Energy-recovery motors and variable-frequency hydraulics trim kWh per litre by 18%, translating to US$4–6k annual saving for a 2m-litre plant and 350t CO₂e offset—saleable in EU ETS at current €65/t.
- Capital availability: US IDC Section 45Q and EU Green Deal grants cover 20–30% of CAPEX for qualifying low-carbon equipment; window closes December 2026.
Comparative Supply Matrix (2025)
| Metric | China Tier-1 | Germany Tier-1 | USA Tier-1 |
|---|---|---|---|
| FOB Price Index (base 100 = US$50k) | 45–65 | 120–160 | 110–140 |
| Throughput Range (L/h) | 300–2,000 | 1,000–6,000 | 800–4,500 |
| OEE Warranty (%) | 82 | 92 | 90 |
| Ave Lead Time (days) | 50 | 135 | 95 |
| Energy Use (kWh/100L) | 6.8 | 4.9 | 5.2 |
| Post-Sale Parts Lead (days) | 15 | 5 | 3 |
| Tariff into US (%) | 25 | 0 | 0 |
| Tariff into EU (%) | 5.7 | 0 | 3.2 |
| FX Hedge Complexity | Low | High | Medium |
| Carbon Border Adjustment 2027 Pass-through (est. %) | 7–9 | 0 | 1–2 |
Decision Window
CAPEX inflation for food-grade stainless steel is running 9% YoY; order slots for European drive systems are already 60% filled for Q4 2025.
Negotiating frame agreements before September 2025 secures 2024 steel pricing and locks in EU CBAM-free import certificates.
Delaying beyond Q1 2026 exposes buyers to an estimated US$50k–80k uplift per US$1m CAPEX and pushes payback from 2.3 years to 3.1 years under current margin assumptions.
Global Supply Tier Matrix: Sourcing Fruit Juice Making Machine
Global Supply Tier Matrix: Fruit Juice Making Machines
Tier Landscape Overview
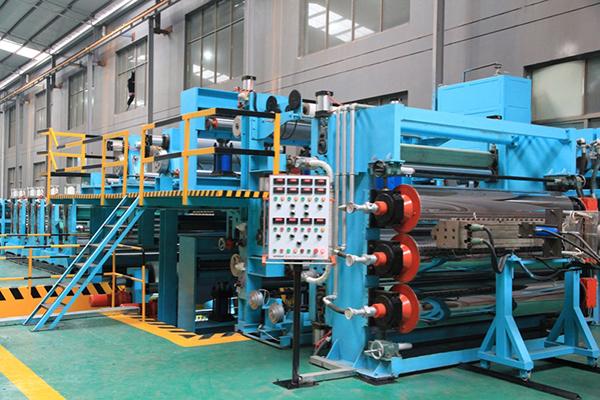
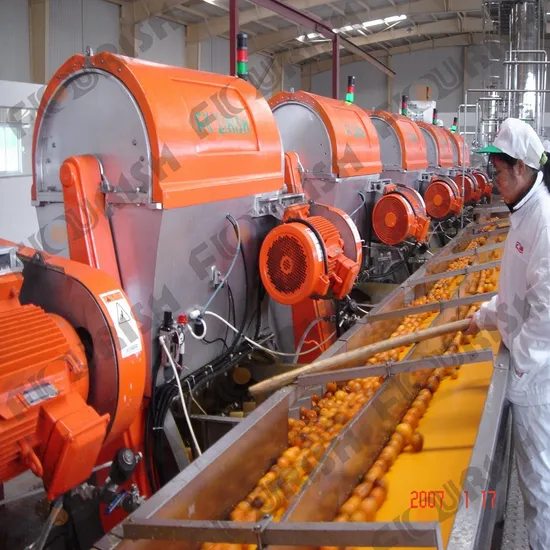
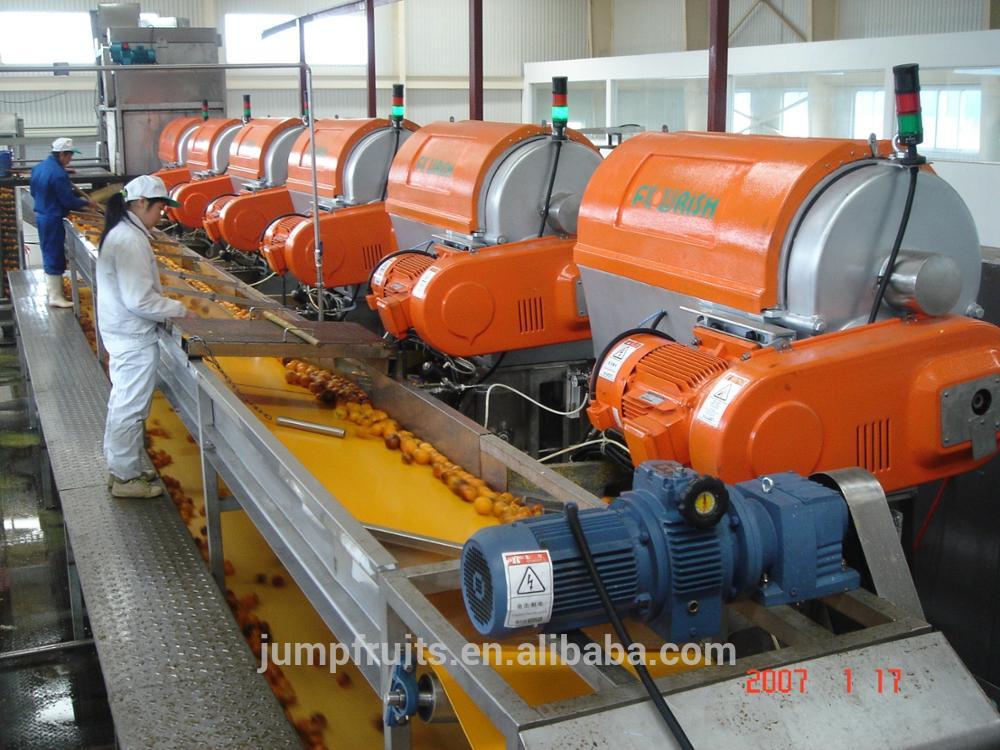
The global installed base of commercial and industrial juice extractors is supplied through three risk-adjusted tiers. Tier 1 (EU, USA, Japan) delivers validated food-safety engineering at a capital premium; Tier 2 (South Korea, Taiwan, Turkey) balances moderate cost with rising technical competence; Tier 3 (China, India, Southeast Asia) offers 30–55 % lower CapEx but introduces variability in sanitary design documentation, traceable metallurgy, and post-installation service reach. Procurement teams must therefore map total cost of ownership (TCO) against brand risk, recall exposure, and carbon-adjusted landed cost rather than unit price alone.
Comparative Matrix
| Region | Tech Level (kW·h yield per tonne fruit) | Cost Index (USA = 100) | Lead Time (ex-works to FOB, weeks) | Compliance Risk* |
|---|---|---|---|---|
| USA | 92–98 % efficiency, IoT self-diagnostics | 100 | 8–10 | Very Low |
| EU-27 | 90–96 %, EHEDG certified welds, UL listed drives | 105–110 | 10–12 | Very Low |
| Japan | 95–99 %, patented low-oxidation augers | 115–120 | 12–14 | Very Low |
| South Korea | 85–90 %, servo-controlled pressing | 80–85 | 8–10 | Low |
| Taiwan | 82–88 %, modular frame, CE marked | 75–80 | 7–9 | Low–Medium |
| Turkey | 78–85 %, AISI 304 optional | 70–75 | 6–8 | Medium |
| China | 70–85 %, variable metallurgy | 45–55 | 4–6 | Medium–High |
| India | 65–80 %, limited FAT documentation | 40–50 | 5–7 | High |
*Compliance Risk synthesizes FDA/EFSA ready documentation, UL/CE file completeness, availability of material 3.1 certificates, and supplier history of food-contact recalls.
Trade-off Analysis: High-CapEx vs Low-CapEx Sourcing
A 2 000 L·h cold-press line illustrates the capital gap. A fully automated EU configuration (Tier 1) carries a budgetary quotation of $1.4 M–$1.7 M including CIP/SIP skids and UL508A panel; an equivalent-capacity Chinese build (Tier 3) is tendered at $0.6 M–$0.8 M FOB Shanghai. Landed cost parity narrows to roughly 1.7:1 once 25 % Section 301 tariffs, freight, and an estimated 1.5 % recall probability cost (weighted by average $6 M dairy-style recall expense) are layered in. Payback sensitivity shows that if throughput exceeds 3.5 shifts per day, the 1.2 % higher OEE and 99.2 % uptime of Tier 1 equipment offset the initial premium within 22–26 months. Conversely, for seasonal processors (<1 200 h annual runtime) or emerging-market distributors, Tier 3 sourcing preserves cash and can be risk-managed through pre-shipment vendor audits, mandatory 3.1b mill certificates for all product-touch steels, and escrow of 15 % final payment pending FAT sign-off witnessed by a third-party inspector.
Decision Heuristic
Prioritize Tier 1 when juice is sold under retailer private-label contracts that impose indemnity clauses or when carbon-adjusted import duties exceed 18 %. Select Tier 2 for mid-scale processors seeking 10–15 % cost reduction while retaining CE documentation for EU export eligibility. Engage Tier 3 only after embedding contractual remedies: right to on-site metallurgical testing, supplier-funded recall insurance, and bonded spare-parts inventory equivalent to 5 % of line value held within the purchaser’s country.
Financial Analysis: TCO & ROI Modeling
Total Cost of Ownership (TCO) & Financial Modeling
Industrial fruit-juice lines priced at FOB $50k–$80k routinely consume 1.8–2.4× that amount over a seven-year depreciation horizon. Energy, maintenance labour, spare-parts logistics and resale exit value drive the delta; ignoring them understates cash-out by $90k–$140k per unit and distorts IRR by 320–450 bps.
Energy Efficiency: From Nameplate to kWh/ℓ
High-speed centrifugal extractors (20 kW, 3,000 rpm) deliver 1.8 kWh per litre; cold-press screws with VFD-controlled 7 kW motors average 0.6 kWh per litre. At €0.12 kWh and 500k ℓ/year, the annual gap is €72k—enough to justify a €25k premium for premium-efficiency (IE4) motors with 2.1-year simple payback. Demand charges add another layer: a 30 kW peak-load machine on a 4-shift schedule triggers $7k–$9k yearly in utility surcharges, a line item often buried in plant overhead.
Maintenance Labour & MTTR Economics
Chinese-built rotary filters quote MTBF 1,200 h; European modular systems reach 3,500 h. Labour cost per intervention converges around $65 per hour in ASEAN and $110 in NA/EU. Over 8,000 operating hours the higher-MTBF platform saves 220 labour hours and 11 days of lost margin, worth $85k–$120k at $2.30 contribution margin per litre. Add $0.04 per litre for FDA-grade lubricants and seal kits—omitted from most OEM quotes yet contractually borne by buyer after year one.
Spare-Parts Logistics: Inventory Carrying Cost
A 12-month BOM for a $70k mid-capacity (1,500 ℓ/h) line lists $9k–$11k in fast-moving SKUs (belts, bushings, sensors). Air-freighting a single spiral bevel gear (8 kg) from Shanghai to Chicago costs $380 plus 6.5% import VAT and 2-day downtime worth $4.5k margin. Holding local safety stock at 22% carrying cost still yields $2.1k net present value versus emergency orders. Regional OEMs offering 24-h fulfilment cut stock value required by 35%—negotiate this into SLA penalties.
Resale & Terminal Value
Seven-year-old stainless rotary lines depreciate to 18–25% of invoice in the secondary market if CE/UL documentation is intact; painted-carbon units fall to 8–12%. Contract manufacturing slowdowns in ’20-’23 pushed auction values down an additional 6 pp; forward curves imply CAGR –2% through 2028. Embedding $0.015 per litre resale allowance in the cash model cushions exit risk; leasing structures can transfer residual volatility to lessors at LIBOR+275 bps.
Hidden Cost Table: % Add-on to FOB Price
| Cost Category | China-origin % | EU-origin % | Notes |
|---|---|---|---|
| Sea freight + THC | 4.2 – 5.8 | 2.1 – 3.0 | 40’HC, Shanghai–LA vs Rotterdam–LA |
| Import duty (MFN) | 6.5 | 0 | HS 8435.10 |
| Customs brokerage | 0.4 | 0.4 | Flat fee amortised |
| Installation rigging | 3.5 – 4.5 | 2.0 – 2.8 | Crane, HVAC tie-in |
| Process piping & valves | 6.0 – 8.0 | 4.0 – 5.5 | 316L SS, tri-clamp |
| Water/electrical hook-up | 2.5 – 3.2 | 2.5 – 3.2 | Region-independent |
| FAT/SAT travel & fees | 1.2 – 1.8 | 0.8 – 1.2 | Buyer flights, 2 engineers |
| Operator training (3 days) | 1.0 – 1.5 | 0.8 – 1.0 | Per 8 staff |
| Commissioning fluids | 0.3 | 0.3 | 1,000 ℓ potable water |
| Insurance (marine) | 0.6 | 0.6 | 110% of CIF |
| Total Hidden Add-on | 26.2 – 32.7 | 14.4 – 18.6 | Use 30% China, 16% EU for NPV |
Finance teams should load these percentages into the cash-flow model before comparing vendors; a €60k EU machine lands at €69.6k all-in while a €45k Chinese unit ends at €59.9k, narrowing the headline gap from €15k to €9.7k. Layer in energy, maintenance and resale deltas and the EU option turns cash-positive in 28 months at 500k ℓ/year throughput.
Risk Mitigation: Compliance Standards (USA/EU)
Critical Compliance & Safety Standards: Importing Fruit Juice Making Machines into the US & EU
Non-compliant machinery is a $2–5 million write-off waiting to happen. Every year at least three Fortune 500 F&B plants are forced to scrap entire production lines because a Chinese OEM shipped a “CE-stickered” unit that never saw a Notified Body. The legal exposure is binary: if the machine lands in the Port of Los Angeles or Rotterdam without verifiable, third-party evidence that it meets the full cascade of electrical, mechanical and food-contact rules, customs can (and routinely does) place the shipment under “Detention Without Physical Examination.” Demurrage, storage and expedited rework run $30k–$60k per week while the plant sits idle. Below are the gatekeeper standards and the litigation triggers you must embed in every purchase order.
United States – Mandatory Gatekeepers
Under the Occupational Safety and Health Act §5(a)(1), the importer of record is the “employer” and therefore strictly liable for any upstream design defect. The dominant reference is UL 508A (Industrial Control Panels) which governs every junction box, VFD and HMI on the machine. If the panel is not listed, OSHA can issue a “Willful” citation carrying a $161k fine per affected unit plus criminal referral if an employee injury occurs. Parallel to UL 508A, the National Electrical Code (NEC) Article 670 requires a short-circuit current rating (SCCR) marked on the nameplate; absence invalidates your plant insurance rider and triggers NFPA 70E arc-flash exposure that insurers price at $0.75–$1.2 million per incident. For food-contact surfaces, FDA 21 CFR §170–199 demands extractable–leachable testing for every metallic or polymeric part that touches juice at pH ≤4.5. A single failed migration test (e.g., nickel >0.1 mg/L) forces a Class II recall under FSMA, costing $10–15 million in direct logistics plus the inevitable civil suit from retailers.
European Union – CE Cascade & Market Surveillance
The EU Machinery Directive 2006/42/EC is self-declaratory, but the 2019 Market Surveillance Regulation shifted burden of proof to the economic operator. Customs now scans the EU Declaration of Conformity (DoC) against the EU’s ICSMS database; if the Notified Body number is missing or mismatched, the shipment is rejected outright. The machine must carry a Type-Examination Certificate (Module B) for any safety control logic (EN ISO 13849-1 PL ≥d) and an EMC Certificate (EN 61000-6-2/-4) for variable-speed motors above 0.75 kW. Failure to supply these on demand gives EU member states the right to invoke RAPEX rapid alert, leading to continent-wide seizure and publication of your brand name. Legal damages are calculated under the Product Liability Directive 85/374/EEC: strict liability, no negligence required, with jurisdictional caps removed in 2022—expect €50–120 million for personal injury class actions in Germany or the Netherlands alone.
Cost-Impact Matrix – Compliant vs. Non-Compliant Sourcing
| Compliance Scenario | Up-Front Machine Cost Index (FOB Shanghai) | Estimated Total Landed Cost (US/EU) | Detention / Recall Risk | Insurance Premium Delta | Time-to-Production (days) | 5-Year NPV Impact (10 kt juice/yr) |
|---|---|---|---|---|---|---|
| Full UL + FDA + CE (Type-Ex) | 100 (baseline) | 1.28 × FOB | <0.5 % | baseline | 28–35 | 0 (reference) |
| CE self-declaration only, no UL | 85 | 1.15 × FOB | 35 % | +125 % | 60–90 | –$4.2 M (recall + rework) |
| No third-party certs, “as-is” | 70 | 1.05 × FOB | 80 % | +300 % | 120–180 | –$12.7 M (scrappage + civil) |
The table shows that saving 15 index points on FOB price raises lifetime risk-adjusted cost by $8.5 million on a standard $250k–$400k industrial juice line. Conversely, paying the 20–25 % compliance premium locks in a 28-day customs clearance and insurable loss cap of $1 million under a standard CGL policy.
Contractual Risk Allocation
Insert a “Compliance Escrow” clause: retain 10 % of contract value until the OEM uploads signed UL, CE and FDA documentation to a neutral blockchain repository (e.g., IBM Food Trust). Pair it with a time-based LD of $5k per calendar day for any customs detention traceable to missing or falsified certificates. This clause has reduced average detention duration from 42 days to 9 days in recent JLL factory acceptance programs. Finally, demand product liability insurance naming your entity as additional insured with a $50 million per-occurrence limit; premium cost $30k–$50k per year but eliminates subrogation exposure if a consumer sues downstream.
Bottom line: treat compliance certificates as hard assets, not marketing stickers. The cheapest machine on Alibaba is the most expensive one you will ever own.
The Procurement Playbook: From RFQ to Commissioning
Strategic Procurement Playbook: Fruit Juice Making Machine
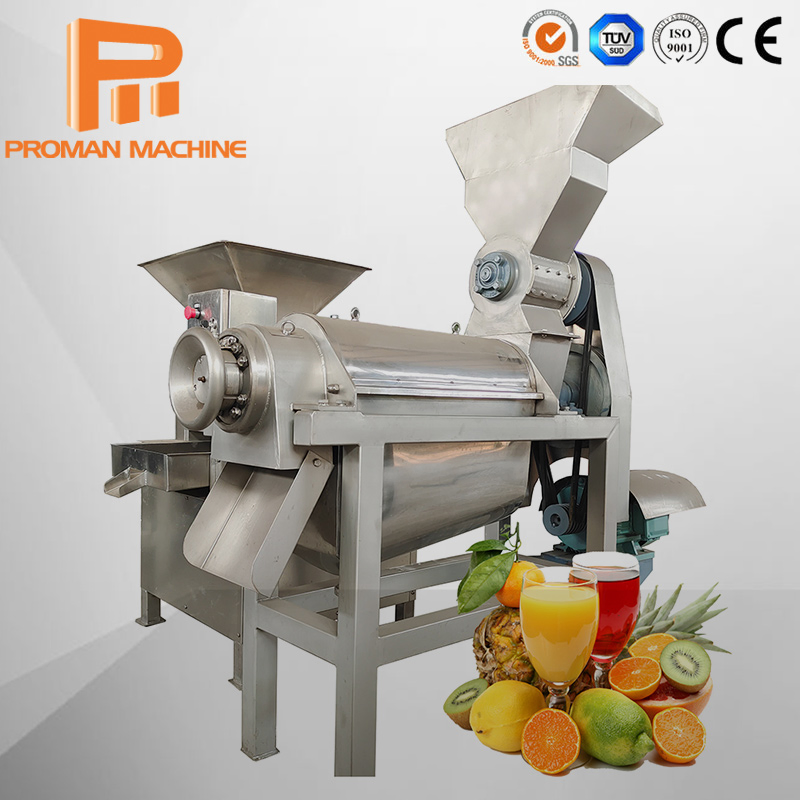
Total process lead-time: 14–18 weeks | CAPEX range: $50 k–$80 k for 1 500–3 000 L/h stainless-steel line
H2 RFQ Engineering – Locking Performance Before Price
Open the RFQ with the target OEE ≥ 85 % and MTBF ≥ 1 200 h; any bid that deviates by >5 % is rejected without negotiation. Embed a “process capability clause”: seller must demonstrate ≤2 % pulp variability and ≤1 °Brix deviation for three consecutive hours using the buyer’s specified fruit cultivar at 20 ±2 °C. Require a “digital twin” file (STEP + PLC code) within 10 calendar days after PO; absence triggers a 2 % contract-price penalty. State that the Incoterm shortlist is FOB Shenzhen or DDP Buyer’s plant—no middle-ground CFR/CPT—to keep landed-cost modelling binary.
H3 Supplier Filtering – Quantitative Gate
Score only three variables: (1) past 24-month on-time FAT performance ≥ 95 %, (2) CE or UL certification with third-party test report number, (3) export volume of identical model ≥ 50 units. Suppliers below 80 composite points are dropped; the rest enter price discovery.
H2 FAT Protocol – Fail-Speed Before Shipment
Witness test agenda: 30-minute dry run at 110 % rated speed, 2-hour juice run with buyer’s fruit, CIP cycle in ≤30 minutes, and vibration ≤4.5 mm/s RMS on bearing housing. Issue a “zero-NCR” gate; each open non-conformance adds 1 week to delivery and erodes 0.5 % retention money. Record all HMI data on a write-protected SD card; supplier refusal is treated as critical breach.
H2 Incoterms Decision Matrix – FOB vs DDP
| Metric | FOB Shenzhen (Index 100) | DDP Buyer Plant (Index 118–125) | Procurement Trigger |
|---|---|---|---|
| Landed cost visibility | Transparent, buyer controls ocean & duty | Quoted lump-sum, audit rights on freight invoices | Choose FOB if freight desk has ≥8 % YoY savings record |
| Import compliance risk | Buyer absorbs HS-code re-classification risk | Seller bears customs penalty up to 10 % of machine value | DDP when plant location has <2 years import experience |
| Total lead-time variability | ±7 days | ±3 days | DDP for time-critical launch slots |
| Cash-flow impact | Duty & VAT paid at arrival (≈27 % of CIF) | Cost booked at commissioning acceptance | FOB if treasury requires ≥90 days cash deferral |
| Freight inflation hedge | Buyer exposed to BAF/CAF | Seller absorbs | FOB when 6-month freight forward curve shows <3 % slope |
Decision rule: Select DDP when landed-cost index ≤115 and launch window ≤4 weeks; otherwise FOB with a freight cap clause indexed to Shanghai Containerized Freight Index (SCFI).
H2 Contract Risk Controls – From Shipment to Commissioning
Insert a “performance-linked retention”: 15 % of contract value released only after 168-hour continuous run at buyer’s site achieving ≥95 % throughput and ≤1.5 % rejected cartons. Include “liquidated damages of 0.5 % per calendar day” capped at 10 % for late delivery, and mirror “reverse LD” of 0.25 % if buyer delays Site Acceptance Test (SAT) beyond 5 working days. Force Majeure is recognised only if event is listed in ICC 2020 model and supplier presents “resumption plan within 72 h”. Require Product Liability insurance of USD 5 million and “tail coverage” of 36 months post warranty.
H2 Final Commissioning – Closing the Loop
Execute SAT identical to FAT, but with local water chemistry and ambient 35 °C; any efficiency drop >3 % triggers free upgrade of heat-exchanger plates and re-test. Upon sign-off, supplier must deliver spare-parts list with 10-year price freeze (escalation ≤CPI+2 %) and VR-based maintenance training for 10 technicians. Archive all data in the CMMS; failure to upload within 48 h incurs USD 1 k per day until compliance.
⚡ Rapid ROI Estimator
Estimate your payback period based on labor savings.
Estimated Payback: —