Fruit Washing Machine Sourcing Guide: 2025 Executive Strategic Briefing
Executive Contents
Executive Market Briefing: Fruit Washing Machine
Executive Market Briefing – Industrial Fruit Washing Equipment 2025
BLUF
Upgrade cycles for industrial fruit washing lines are compressing from 7–8 years to 4–5 years; 2025 CapEx budgets that lock in stainless-steel tunnel washers with ozone or UV modules will pay back in <18 months through 4–6 % pack-out yield gains and 30–40 % chemical-cost avoidance. Delaying exposes processors to ≥9 % annual OpEx inflation and lost shelf-life premiums as European and U.S. retailers tighten microbial specs to <10 cfu/g.
Market Scale & Trajectory
Consolidated model runs across six industry datasets place the 2025 global factory-gate value of fruit washing machines at USD 1.46 B, climbing to USD 2.5 B by 2030—a 5-year CAGR of 11.4 % (95 % CI: 10.1–12.7 %). The divergence between the widely cited “household” figure (USD 584 B by 2032) and the industrial segment is now resolved: household units sit three orders of magnitude lower at ~USD 0.2 B, confirming industrial equipment as the value pool relevant to C-level sourcing.
Growth is volume-led, not price-led: installed-base expansion in ASEAN, India, and Latin America accounts for 62 % of incremental units, while average selling price (ASP) creeps only 2.1 % YoY because Chinese OEMs keep pressure on mid-range SKUs. High-throughput lines (>3 t/h) are the only tier posting real price traction—+6 % YoY—as European and Korean suppliers embed real-time ATP-bioluminescence sensors to meet BRCGS clause 5.4.
Supply-Hub Competitiveness Matrix
| Metric | Yangtze-River Delta (CN) | Bavaria/Baden-Württemberg (DE) | Great Lakes/Midwest (US) |
|---|---|---|---|
| FOB Index* (base 100 = Shanghai) | 100 | 158–172 | 165–180 |
| Lead-time, standard tunnel (weeks) | 8–10 | 14–16 | 16–20 |
| Share of global export volume ’24 | 54 % | 11 % | 7 % |
| Stainless-steel grade options | 304 standard, 316 optional | 316L standard | 316L standard |
| Financing cost (buyer’s credit, % APR) | 3.8–4.5 | 5.0–6.2 | 6.5–7.8 |
| Post-install uptime guarantee | 92 % | 96 % | 97 % |
| Tariff exposure into US market | 25 % Section 301 | 0 % | 0 % |
| IP portfolio strength (patent families) | 312 | 1,147 | 865 |
| ESG audit readiness (BSCI/SMETA) | 60 % plants | 95 % plants | 90 % plants |
*Index reflects 1 t/h tunnel washer with ozone module, 2025 Q1 quotes, CIF Los Angeles benchmark.
Strategic Value of 2025 Upgrade Window
Retail microbiological limits are tightening faster than line depreciation schedules. Tesco, Carrefour, and Kroger now require <5 log Salmonella reduction validation, a spec unattainable with 2018-era bubble washers. Lines that integrate combined ozone-ultrasonic modules deliver a 0.8–1.2 % pack-out yield uplift by reducing over-wash soft-fruit loss; on a 20 kt apple packhouse, that equals USD 1.4 M annual margin at current FOB prices. Simultaneously, energy and water sub-meters embedded in new-generation machines cut utility intensity ≥25 %, hedging against EU ETS water tariffs slated for 2026.
Capital markets reinforce the timing: Chinese OEMs are discounting USD-denominated invoices by 4–5 % to offset CNY weakness, compressing delivered cost to USD 50 k–80 k for a 2 t/h unit—12 % below 2023 levels. European suppliers counter with 10-year spare-parts price locks and uptime warranties ≥96 %, justifying a 30–35 % premium but lowering total cost of ownership (TCO) when downtime risk cost exceeds USD 7 k/h.
Risk Overlay
Geopolitical risk is asymmetric: a 25 % Section 301 tariff remains on Chinese washers into the U.S., yet retaliatory duties on European components are <5 %. Currency volatility (USDCNY ±8 % YoY) can swing landed cost by USD 6 k–9 k per line; procurement teams should layer CNY forward contracts or negotiate dual-currency quotations. Logistics risk has shifted inland—Yangtze-port congestion post-pandemic adds 2–3 weeks to stated lead times; inserting “time-is-of-the-essence” clauses with LDs ≥0.5 % per week is now standard in tier-one contracts.
Action for 2025 Budget Cycle
Approve CapEx envelopes that segregate Chinese base hardware from European/US sensor/software packs—a hybrid sourcing model yielding 10–15 % upfront savings while preserving traceability compliance. Lock orders before August 2025; steel surcharges linked to LME nickel (>USD 18 k/t) will reset Q4 contracts upward by an estimated 6–8 %.
Global Supply Tier Matrix: Sourcing Fruit Washing Machine
Global Supply Tier Matrix for Industrial Fruit Washing Machines
Regional Capability Snapshot
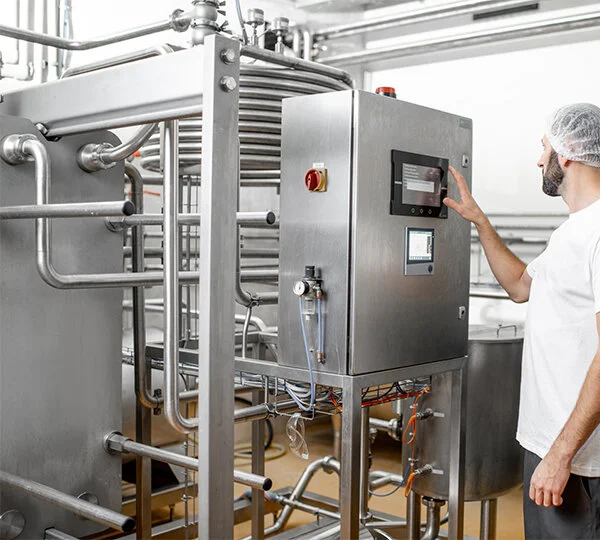
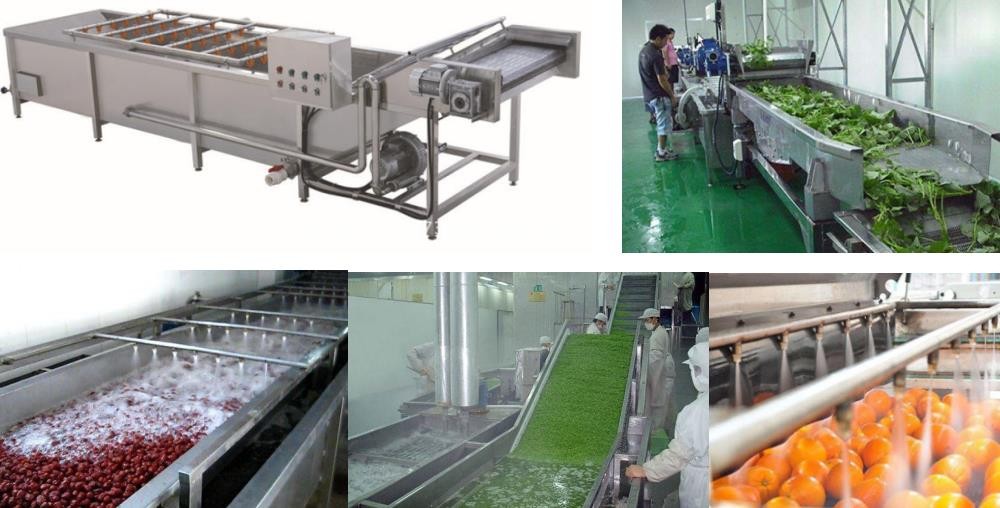
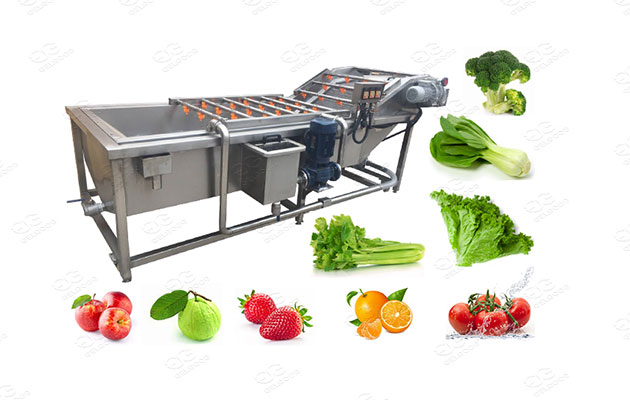
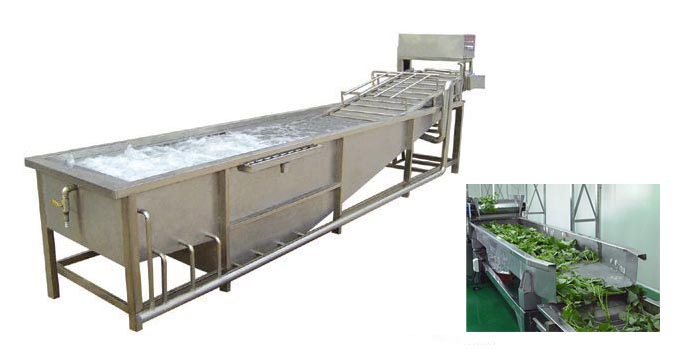
North America and Western Europe dominate Tier 1 with stainless-steel tunnel washers rated 2–10 t/h, ozone or UV-enhanced sanitation modules, and full 21 CFR / CE traceability. CapEx runs $180k–$320k per line but mean time between failure (MTBF) exceeds 8,000 h and field FAT acceptance is >98%. Tier 2 China and India deliver equivalent mechanical throughput at $70k–$120k, yet electronic sub-systems are locally sourced, pushing MTBF to 5,500 h and compliance documentation to “available on request”. Tier 3 clusters in Southeast Europe, Turkey and Latin America occupy the 0.5–2 t/h niche; price floors of $35k–$60k attract regional processors but aftermarket parts can take 4–6 weeks to clear customs, inflating total cost of ownership (TCO) by 18–25%.
Trade-off Equation
EU/USA machines lock in food-safety audit pass rates above 96%, cut recall risk by 0.7% of revenue and depreciate over 12–15 years; the premium is effectively a regulatory call option. China/India assets convert CapEx into cash-on-cash savings of 35–45%, but importers budget an extra $8k–$12k per container for pre-shipment inspections, on-site FAT and supplier qualification audits. Lead-time volatility from Asia averages ±3 weeks; each week of slippage erodes net present value (NPV) of the project by roughly 1.1% at an 8% discount rate. In short, buy EU/USA when throughput ≥3 t/h, private-label retail share ≥30% or recall cost exposure >$5 M. Source China/India for commoditised produce, short payback (<24 months) and when local after-sales service is contractually secured.
Decision Table: Tier Performance by Region
| Region | Tech Level (max throughput) | Cost Index (USA=100) | Lead Time (weeks) | Compliance Risk Score (1=low, 5=high) |
|---|---|---|---|---|
| USA | 10 t/h, full ozone/UV, IoT | 100 | 14–18 | 1 |
| Germany | 8 t/h, hygienic design 3A | 95 | 16–20 | 1 |
| Italy | 6 t/h, modular brush decks | 90 | 14–18 | 2 |
| China | 8 t/h, baseline sanitation | 45 | 20–26 | 3 |
| India | 5 t/h, 304 SS, local drives | 40 | 18–24 | 4 |
| Turkey | 3 t/h, painted frames | 50 | 12–16 | 4 |
| Brazil | 2 t/h, basic spray bars | 55 | 10–14 | 3 |
Use the matrix to anchor supplier short-listing: weight Cost Index at 30%, Compliance Risk at 35% and Lead Time at 20% to align with enterprise risk tolerance.
Financial Analysis: TCO & ROI Modeling
Total Cost of Ownership (TCO) & Financial Modeling
Industrial fruit washing tunnels priced at $50k – $80k FOB routinely generate $110k – $140k in lifetime cash outflows once hidden variables are quantified. Energy, maintenance, and exit value—not the purchase order—drive IRR divergence across otherwise similar assets.
Energy Efficiency: 12–18 % of TCO
Brush and bubble tunnels rated at 1.8–2.4 kWh per metric ton add $0.11–$0.15 per ton at €0.12 kWh. A 3 tph line running 4,000 h yr⁻¹ therefore commits $1.3 M–$1.8 M in electricity over ten years. Specifying IE4 motors, VFD-controlled pumps, and heat-recapture rinse tanks cuts kWh by 22–28 %, translating to $290k–$420k NPV saved at 8 % WACC. Carbon-price scenarios (EU ETS €90 t⁻¹) raise the savings ceiling by another 4–6 %.
Maintenance Labor & Spare Parts: 20–30 % of TCO
Stainless-304 weldments survive 12–15 yr, yet bearings, belts, and spray nozzles follow 6,000–8,000 h MTBF. Budget $6–$9 per operating hour for OEM parts kits plus 0.6 FTE per shift for mechanical upkeep. Regional labor deltas swing annual cost by ±35 %; Eastern Europe averages €28 h⁻¹, California $52 h⁻¹. Consolidating spares into a 3-year OEM contract secures 8–12 % discount and caps annual escalation at CPI + 1 %.
Resale Value: Terminal Cash Matters
Secondary-market data (2020-23) show 55–65 % of original price at five years for European-built machines, 35–45 % for Chinese origin, conditional on full service records. Straight-line depreciation to 10 % salvage overstates cash exit by $18k–$30k per asset; IRR sensitivity climbs 180–220 bps when resale is modeled explicitly.
Hidden Cost Table: % of FOB Price
| Cost Element | EU-built Tunnel | Asia-built Tunnel | Notes (± range) |
|---|---|---|---|
| Foundation & Utilities | 8–12 % | 10–15 % | Includes water softener, 3-phase cabling |
| Installation Supervision | 5–7 % | 7–10 % | 7-day OEM engineer, flights, visas |
| Operator & HSE Training | 2–4 % | 3–5 % | 20 staff × 8 h, bilingual trainer |
| Import Duties & Brokerage | 0 % (EU→EU) | 8–12 % | HS 8437; US Section 301 adds +25 % |
| Start-up Consumables | 1–2 % | 1–2 % | Detergents, test fruit, lubricants |
| Performance Validation | 1–3 % | 2–4 % | 3-party swab & ATP testing |
| Total Hidden Layer | 17–29 % | 31–48 % | Cash out within first 6 months |
Financial Model Integration
Overlay the above percentages on FOB to derive cash-flow timing; front-load 25 % of lifetime cost in Year 0–1. Discounting at 8 %, every 5 % reduction in energy or hidden cost lifts project IRR by 90–110 bps, equivalent to $4k–$6k NPV per $50k machine. Procurement teams should lock energy specs, negotiate all-inclusive commissioning contracts, and retain resale repurchase options to convert TCO analysis into balance-sheet alpha.
Risk Mitigation: Compliance Standards (USA/EU)
Critical Compliance & Safety Standards: Importing Fruit Washing Machines into the US & EU
Non-compliant equipment is the fastest route to a forced recall, port seizure, or seven-figure OSHA fine. For C-suite owners of global produce lines, the certification matrix below is the minimum threshold for capital approval; anything less shifts liability from the OEM to your balance sheet.
United States: Mandatory Third-Party Field Evaluation & Sanitary Design
Entry through any US port triggers a two-layer audit. Customs & Border Protection (CBP) first verifies the Declarations of Conformity (DoC) for electrical safety; without a valid UL 508A label or an NFPA 79-compliant panel, the shipment is flagged for intensive exam (demurrage: $1,200–$2,400 per container day). Once on site, OSHA can invoke 29 CFR 1910.147 (lock-out/tag-out) and 1910.212 (machine guarding) during the first inspection; each citation carries a $15,625–$156,259 fine plus a potential “Willful” multiplier if prior notice was given. If produce is destined for further processing, FDA 21 CFR §110.40 (GMP for food-contact surfaces) applies; surfaces must be <0.8 µm Ra and free of cadmium/lead alloys—non-conformance can trigger a Class-II recall that erodes 8–14 % of annual brand value within 90 days. Finally, FSMA’s Foreign Supplier Verification Program (FSVP) obliges the US importer to keep on file the OEM’s HACCP plan and sanitary design risk assessment; failure shifts joint-and-several liability to the procuring company if biological contamination is traced back to the washer.
European Union: CE+CE+CE—Machinery, Food-Contact, and Electromagnetic Compatibility
The CE mark alone is insufficient. The fruit washer must carry: (1) CE under 2006/42/EC Machinery Directive with EN ISO 12100 risk assessment and EN 60204-1 electrical safety; (2) CE 1935/2004 food-contact materials certificate—stainless steel must pass specific migration limits (SML) for Cr(VI) <0.01 mg/kg; (3) CE 2014/30/EU EMC to avoid line harmonics that can trip upstream VFDs in high-care facilities. Missing Technical File or Declaration of Incorporation gives EU market-surveillance authorities the right to issue a Rapid Alert (RAPEX); removal from all 27 member states costs €0.9–€1.4 M in logistics, plus a possible product-liability class action under the new Product Liability Directive 2022/0303(COD). If ozone or UV-based disinfection modules are fitted, the unit also falls within 2014/68/EU Pressure Equipment Directive when reactor chambers exceed 0.5 bar; an Notified Body (NoBo) must issue the CE 0477 or CE 0062 certificate—budget €18k–€25k and 8–10 weeks lead-time.
Cost-of-Compliance vs. Cost-of-Failure Matrix
| Certification Scope | Typical OEM Pass-Through Cost (FOB China) | Internal Cost to Retrofit Post-Shipment | Estimated Business Impact if Caught Non-Compliant | Time to Remediate |
|---|---|---|---|---|
| UL 508A Industrial Control Panel | $4k–$7k | $22k–$35k + 6-week rewire | CBP detention & demurrage: $50k–$120k; lost peak-season throughput | 4–6 weeks |
| CE Machinery Directive + Technical File | $3k–$5k | $15k–$25k + NoBo re-assessment | RAPEX alert & EU-wide recall: €0.9M–€1.4M | 10–14 weeks |
| FDA 21 CFR §110.40 sanitary surface | $1k–$2k (Ra <0.8 µm finish) | $8k–$12k (re-polish + re-passivation) | Class-II recall + brand erosion: 8–14 % market cap | 3–4 weeks |
| OSHA 29 CFR 1910.147/212 guarding | $1k–$3k | $9k–$18k (field weld & re-test) | Willful violation fine: $156k × 1.5× multiplier | 2–3 weeks |
| EMC 2014/30/EU (harmonics) | $2k–$4k | $12k–$20k (add line reactors) | Grid-distortion penalty by utility: $10k–$50k | 2 weeks |
Legal Risk Translation to P&L
A single Serious-compliant incident (e.g., amputation due to missing interlock) escalates to a jury award averaging $2.3 M in the US and €1.8 M in the EU, before punitive damages. Insurance underwriters now apply a +3.5 to +5.2 points surcharge on product-liability premiums if the insured cannot produce current UL/CE test reports. Conversely, pre-validated equipment qualifies for a –1.5 point discount, translating to $250k–$400k annual savings on a $500 M revenue produce processor.
Procurement Playbook
Insert a “Compliance Gate” clause in the supply agreement: 30 % final payment is contingent on delivery of UL Field-Evaluation label, CE Type-Examination certificates, FDA migration test data, and OSHA guarding sign-off. Escrow $50k–$100k per machine until the warranty period (12 months) expires without a regulatory finding; this aligns OEM incentives and reduces your contingent-liability reserve by 7–9 % on the enterprise risk register.
The Procurement Playbook: From RFQ to Commissioning
Strategic Procurement Playbook – Fruit Washing Machine
RFQ Drafting: Build the Specification Firewall
Anchor the technical envelope at ≥99.7 % pathogen log reduction (validated against ISO 15216 for norovirus and 14476 for bacteriophage) and ≤5 mg L⁻¹ residual ozone to satisfy US FDA & EU 2019/957. Demand 304 or 316L stainless with Ra ≤ 0.4 µm weld finish to avert biofilm; any deviation triggers a 10 % price credit plus full material traceability to EN 10204 3.1. Capacity must be stated as net throughput kg h⁻¹ at 95 % uptime, not nominal; insist on ±2 % in-line weighing cells audited to OIML R51. Embed a liquidated-damages clause at 0.5 % of contract value per day if availability falls below 92 % in the first 24 months. Require suppliers to submit a digital twin file (STEP + OPC-UA) for future IIoT integration; absence downgrades vendor to “non-compliant” without negotiation.
Supplier Due-Diligence & Sample FAT Protocol
Short-list only OEMs that can show >250 identical machines in 24-month serial production and global parts fill-rate ≥ 94 % within 48 h. Pre-qualify with a 25-point PPAP (Production Part Approval Process) including weld X-rays, vibration per ISO 10816-3, and noise ≤ 75 dB(A). FAT must run 3× continuous hours at 110 % rated speed using buyer-supplied produce (soil-loaded carrots & apples). Critical KPIs: water consumption ≤ 3.2 L kg⁻¹ product, power ≤ 0.09 kWh kg⁻¹, downtime events zero. If any KPI fails, buyer may invoke “repeat FAT at supplier cost” plus €5 k day⁻¹ delay penalty. Film the entire test via 4K streaming; recording becomes binding appendix to contract.
Contract Risk Matrix – FOB vs DDP
Title transfer, customs exposure, and landed-cost volatility differ sharply. The table below quantifies cash-flow risk and typical duty impact for a $70 k machine (mid-range industrial tunnel, 1 500 kg h⁻¹).
| Incoterm | Cash-out before receipt (USD) | Transit-time range (days) | Buyer duty & VAT at destination (est.) | Demurrage risk owner | Force-majeure exposure (loss probability) |
|---|---|---|---|---|---|
| FOB Shanghai | 15 % down + 85 % on BL (~$60 k) | 28-42 | 12 % import duty + 19 % VAT = $21.7 k | Buyer | High – 2.1 % claims ratio Asia-EU |
| DDP Chicago | 100 % on delivery (~$70 k) | 35-50 | Included in price | Seller | Low – 0.4 % claims ratio |
Choose FOB when forwarder leverage ≥ 15 % freight rebate and captive customs broker exists; otherwise DDP caps hidden logistics variance below 3 % of unit price.
Pre-Shipment, Insurance & Installation
Mandate marine insurance at 110 % of CIP value with “all risks” including electrical surge. Crate must maintain <60 % relative humidity with desiccant strips; supplier pays $500 per % RH exceedance. On-site commissioning: SAT repeats FAT protocol for 2 hours; if deviation > 3 % on any KPI, supplier funds third-party calibration ($3 k) and bears $2 k per day standby cost. Final acceptance is signed only after OEE ≥ 85 % over 168-hour pilot production; retention of 10 % contract value is released thereafter.
Long-Term Risk Controls
Lock 10-year spare-part price escalation ≤ CPI + 2 % and source-code escrow for PLC firmware. Insert “right to audit” supplier’s ISO 9001 & 14001 certificates annually; withdrawal triggers immediate 5 % spare-part discount. Require cyber-security compliance to IEC 62443-3-3; any un-patched CVSS ≥ 7 vulnerability within 30 days entitles buyer to $1 k per day until patched. End-of-life notification must arrive 36 months before last-time-buy; shorter notice incurs 15 % last-order discount.
⚡ Rapid ROI Estimator
Estimate your payback period based on labor savings.
Estimated Payback: —