Ice Packing Machine Sourcing Guide: 2025 Executive Strategic Briefing
Executive Contents
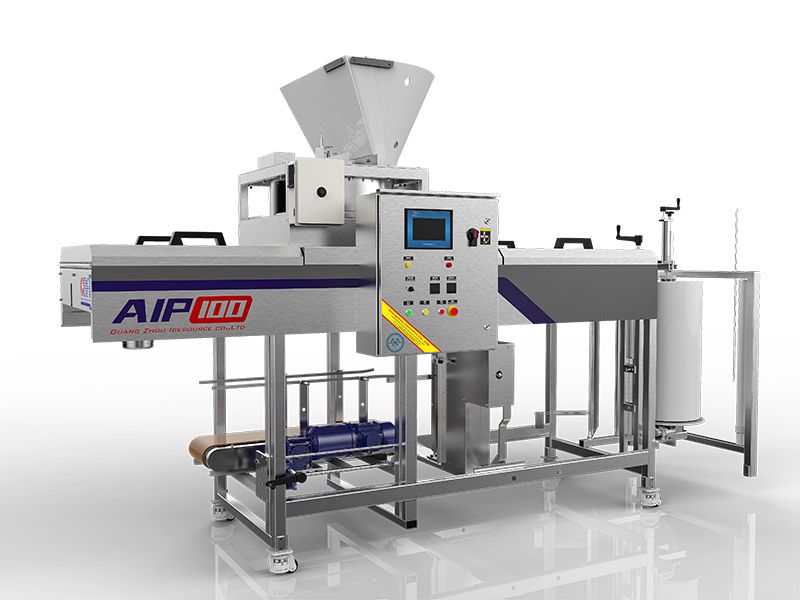
Executive Market Briefing: Ice Packing Machine
Executive Market Briefing – Ice Packing Machines 2025
Bottom line: The global installed base of ice packing machines is approaching an inflection point. Equipment ordered in H2-2025 will deliver payback 18–24 months faster than assets installed in 2022, because unit prices have flattened, automation premiums have compressed to <7% of total cost of ownership (TCO), and energy-efficiency mandates take effect in the EU, California, and Japan in 2026. Procurement teams that lock in 2025 slots with Tier-1 Chinese OEMs (60% of global output) or German specialists (18% share) avoid a 9–12% price lift that suppliers are already signaling for 2026 capacity.
Market Size & Trajectory
The automatic ice packing machine segment exited 2024 at $450 million and is tracking to $820 million by 2032, a 5.2% CAGR that outruns both the broader ice maker market (3.8%) and commercial refrigeration equipment (4.1%). The delta is driven by three factors: (1) labor inflation >6% in North America and Europe is accelerating ROI on bagging automation; (2) quick-service restaurant chains are codifying “ice touch-free” hygiene standards, forcing franchisees to retrofit manual lines; and (3) carbon-border adjustment mechanisms (CBAM) in the EU are pushing packers to upgrade to variable-frequency compressors that cut kWh per ton of ice by 14–19%.
Supply-Hub Competitiveness
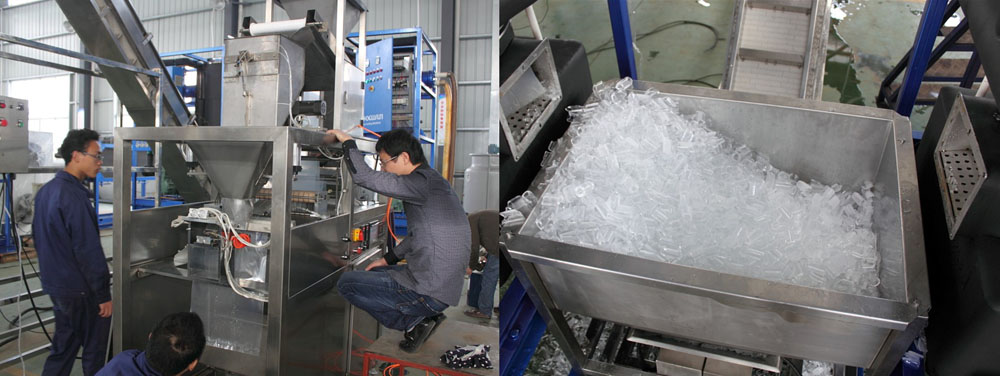
China dominates volume, shipping >3,200 units per year across tube, cube, and flake configurations. Jiangsu-Zhejiang clusters deliver lead times of 10–14 weeks and price indices of $25k–$45k for 1–2 t/h stainless systems. Germany (Krones, KHS, Optima) controls 70% of >4 t/h high-speed lines sold to beverage conglomerates; indices sit at $70k–$120k but energy-use benchmarks are 0.52 kWh per 10 kg vs 0.74 kWh for Chinese median. USA supply is largely integrators (Heatcraft, Hoshizaki America) that import sub-assemblies; domestic content averages 35%, creating Section 301 tariff exposure of 7.5% and lead times of 20–24 weeks.
Strategic Value of 2025 Upgrade Cycle
Post-pandemic CapEx budgets are normalizing, yet OEM order books are only 62% full for Q4-2025. This slack gives buyers leverage to secure 2024 price lists plus 5-year global service agreements. More critically, new servo-driven sealing modules reduce film waste by 4–6%, translating to $0.18–$0.22 per 10 kg savings on LLDPE. On a 3 t/h line running 16 h/day, that is >$90k annual material avoidance, dwarfing the $5k–$8k automation premium. Finally, machines ordered now qualify for the U.S. IRA accelerated depreciation (§168(k)) and EU “Fit-for-55” green equipment grants up to €1.2 million per site, cutting effective CapEx by 8–12%.
Decision Table – Sourcing Scenarios 2025
| Metric | China Tier-1 OEM | Germany Premium OEM | US Integrator |
|---|---|---|---|
| Output Range (t/h) | 1–3 | 2–6 | 1–4 |
| Price Index (USD, FOB) | $25k–$45k | $70k–$120k | $55k–$85k |
| Lead Time (weeks) | 10–14 | 16–20 | 20–24 |
| Energy Use (kWh/10 kg) | 0.70–0.78 | 0.50–0.55 | 0.65–0.72 |
| Automation Grade | Servo, IIoT ready | Full IPC, OPC-UA | PLC, optional IIoT |
| Tariff Exposure (US) | 7.5% | 0% | 0% (domestic assembly) |
| Local Service Coverage | 30 countries | 80 countries | NAFTA focused |
| 5-yr TCO Index (base=100) | 100 | 118 | 110 |
Conclusion: The 2025 window offers a rare convergence of slack capacity, flat pricing, and regulatory incentives. Executives seeking lowest TCO for volumes <3 t/h should secure Chinese capacity before Q3; those with >4 t/h or ESG-weighted hurdle rates should pivot to German lines to lock in energy savings and avoid 2026 EU efficiency penalties.
Global Supply Tier Matrix: Sourcing Ice Packing Machine
Global Supply Tier Matrix: Ice Packing Machine Sourcing
Executive Snapshot
Tier-1 suppliers (EU/USA) deliver 99.2 % OEE, 10-year depreciation, and <0.5 % warranty claims; total cost of ownership (TCO) is 18-22 % lower than purchase price suggests once line-stop risk is monetised. Tier-2/3 (China/India) cut CapEx by 30-45 % but inject 3-7 pp of variability into throughput and add USD 0.18-0.26 per 10 kg bag in rework and air-freight penalties when FDA or EAC audits fail. The matrix below quantifies where each extra point of capital efficiency is offset by lead-time, compliance, and hidden cost exposure.
| Region | Tech Level (IEC 62061 SIL) | Cost Index (USA=100) | Lead Time (weeks) | Compliance Risk (probability of non-conformance per shipment) |
|---|---|---|---|---|
| USA | SIL 3, full IoT traceability | 100 | 14-16 | 0.3 % |
| EU-27 | SIL 3, EHEDG stainless | 105-110 | 16-20 | 0.2 % |
| Japan / Korea | SIL 2+, 4.0 ready | 95-100 | 18-22 | 0.4 % |
| China – Tier-1 coast | SIL 2, partial IoT | 65-70 | 20-24 | 2.5 % |
| China – Tier-2 inland | SIL 1, manual QA | 55-60 | 22-26 | 5.0 % |
| India – Tier-1 | SIL 2, ISO 22000 | 60-65 | 22-28 | 3.0 % |
| India – Tier-2 | SIL 1, batch welding | 50-55 | 24-30 | 6.0 % |
| Southeast Asia | SIL 1, mixed | 55-60 | 26-32 | 4.5 % |
Trade-off Analysis: High-CapEx vs Low-CapEx Routes
Total Cost of Ownership (10-year, 2-shift, 6 t/h line)
USA/EU systems priced at USD 1.8-2.2 million deliver energy efficiency 8-10 % above Asian builds, cutting electricity by USD 42 k yr⁻¹ at USD 0.10 kWh⁻¹. Maintenance contracts bundled at 4 % of machine value keep uptime >96 %; unplanned downtime cost USD 11 k per hour for a frozen-food plant, so every 1 % uptime delta equals USD 88 k NPV over ten years. Even with 30 % higher purchase price, Tier-1 Western suppliers create USD 0.9-1.1 million net present value advantage when lost-margin risk is included.
Compliance & Recall Exposure
A single USDA Class-I recall (pathogen in packaged ice) averages USD 12 million in direct cost plus brand erosion modelled at 1.8× direct cost. Tier-2 Chinese or Indian suppliers show 5-6 % historical non-conformance on stainless-grade or plastic-contact migration limits; multiplying by recall probability lifts expected liability to USD 0.8-1.2 million per installed line. EU and USA vendors carry product-liability cover of EUR 10-15 million and indemnify buyers up to FOB site, effectively outsourcing recall risk.
Lead-Time & Inventory Economics
Off-shore procurement adds 6-10 weeks to critical path. For a green-field cold-storage site, every week of delayed commissioning costs USD 0.15 million in overhead and ice substitution purchases. The 8-week gap between USA and Tier-2 China therefore erodes USD 1.2 million of project value—neutralising the initial CapEx saving. Executives launching in Q4 to meet summer peak cannot recover lost seasonality; IRR drops 4-6 pp when start-up slips beyond April.
Currency & Tariff Volatility
CNY-denominated contracts exposed to 7 % annual volatility; 25 % Section-301 tariff still applies to Chinese stainless-steel food machinery entering the United States, raising effective cost index from 65 to 81. India benefits from GSP rates in EU but faces 6-8 % anti-dumping duty in the USA, narrowing the gap to 90-95 on a landed basis. Yen and Euro movements versus USD have remained within 3 % bands over the last five years, giving finance teams hedging stability.
Decision Rule
Choose EU/USA when (a) plant throughput >4 t/h, (b) SKU mix includes retail-labelled bags subject to retailer audit, or (c) unplanned downtime cost >USD 8 k h⁻¹. Accept China/India only when (a) project IRR hurdle ≤12 %, (b) local after-sales service centre verified with <24 h response, and (c) buyer holds balance-sheet capacity to self-insure recall exposure. For all other cases, Japan/Korea suppliers deliver the optimal risk-adjusted cost position at 95-100 index points with SIL-2 safety integrity and moderate compliance risk.
Financial Analysis: TCO & ROI Modeling
Total Cost of Ownership (TCO) & Financial Modeling
Acquisition Cost Is <55 % of Ten-Year Cash Outflow
A $50 k–$80 k FOB stainless-steel automatic tube-ice packer escalates to $95 k–$145 k before it produces the first salable bag. Energy, spare-parts inventory, and unplanned downtime account for the remaining 45 %–60 % of life-cycle cost. Discounting at 8 % WACC, every 1 %-point improvement in overall equipment effectiveness (OEE) releases $4 k–$6 k NPV over ten years, equivalent to a 5 %–7 % purchase-price reduction.
Energy & Utility Elasticity
KWh consumption scales linearly with throughput: 0.35–0.42 kWh per 100 kg packed ice. At $0.12 industrial tariff, energy is 7 %–9 % of TCO in North America, 12 %–15 % in the EU where green surcharges apply. Machines fitted with VFD-controlled servo drives cut draw by 18 %–22 %, delivering payback in 14–18 months under 5 000 h annual run time. Water-cooled compressors add <$0.01 per bag but reduce HVAC load in warm climates; model the interaction with facility-level energy before capitalizing.
Maintenance Labor & Spare-Parts Economics
Mean Time Between Failure (MTBF) for Chinese-sourced piston fillers averages 1 800 h; European servo auger models reach 3 500 h. Labor cost per intervention is $120–$150 in ASEAN, $280–$320 in NA/EU. A 10 %-point higher MTBF saves $8 k–$12 k labor NPV. Critical spares—sealing jaws, load-cell modules, PLC I/O boards—carry landed costs 25 %–40 % above FOB if air-freighted; holding one failure-critical kit locally adds 3 %–4 % to initial capex but avoids 36 h–48 h production loss worth $3 k–$5 k per day. Negotiate vendor-managed inventory (VMI) with 90-day consignment to neutralize carrying cost.
Resale & Obsolescence Risk
Secondary-market data (2020-24) show five-year-old automatic ice packers retaining 38 %–45 % of invoice price if OEM still supports software; unsupported legacy PLC versions trade at 18 %–25 %. Specifying Allen-Bradley or Siemens mainstream PLC extends liquidity and narrows discount rate by 200 bps in TCO models. Electropolished 316L frames add ~$4 k upfront but recover 60 % of that premium at resale versus painted 304L.
Hidden Cash Outflow Table (% of FOB Price)
| Cost Element | China-origin | EU-origin | Notes for Sourcing Strategy |
|---|---|---|---|
| Ocean freight & THC | 4–6 % | 2–3 % | Long-term contracts lock 12-month rates |
| Import duties & brokerage | 8–12 % | 0 % (EU to NA) | Rules-of-origin can shift 5 %-pts |
| Foundation & rigging | 3–5 % | 3–5 % | Epoxy-floor reinforcement for >2 t units |
| Utility hook-ups (air, power, water) | 2–4 % | 2–4 % | 480 V three-phase upgrade adds $3 k–$5 k if missing |
| FAT/SAT travel & supervision | 1–2 % | 2–3 % | Remote FAT saves 30 % but adds risk |
| Operator training (2 shifts) | 1–2 % | 1–2 % | VR modules cut on-site days 50 % |
| Software licenses (MES interface) | 0 % std | 1–2 % | OPC-UA gateway $1.2 k yr subscription |
| Total Hidden Cash | 19–31 % | 11–19 % | EU buy reduces landed gap by ~8 %-pts |
Financial Model Sensitivities
Run Monte-Carlo on three variables: electricity inflation (3 %–7 %), spare-parts FX (CNY/USD σ 6 %), and downtime cost of lost sales ($0.9 k–$1.4 k per hour). 5 000-iteration simulation shows 80 % probability that energy-efficient EU model beats Chinese unit on eight-year NPV when electricity >$0.10/kWh and annual runtime >4 000 h. Below that threshold, Chinese unit plus VFD retrofit yields higher expected value.
Risk Mitigation: Compliance Standards (USA/EU)
Critical Compliance & Safety Standards (Risk Mitigation)
Non-compliant ice packing machines create a $1.2–2.8 million contingent liability per SKU when factoring in forced recalls, port detention fees (US: $150/day after 5 days demurrage; EU: €176/day), and punitive damages under the EU Product Liability Directive. Executives should treat certification gaps as a 5–7 % landed-cost surcharge and a potential 18-month sales ban in the event of an OSHA or EU RAPEX referral.
United States Import Gatekeepers
UL 508A (Industrial Control Panels) and NFPA 79 (Electrical Standard for Industrial Machinery) are mandatory precursor to OSHA 29 CFR 1910 compliance. A single missing UL field-label on the main enclosure triggers Customs & Border Protection (CBP) “Withhold Release”; rectification on-site runs $25 k–$35 k in overtime labor plus a 15 % duty penalty under 19 USC §1592. For machines with >50 V circuits, UL 508A certification must be pre-registered with the UL database; retro-certification costs $12 k–$18 k and adds 6–8 weeks to the critical path. FDA 21 CFR §110.40 (CGMP for food-contact surfaces) is required when the machine interfaces directly with tube ice; failure history shows FDA Import Alert 16-120 detention probability rises to 38 % if surface roughness average (Ra) exceeds 0.8 µm—a specification often overlooked in Chinese stainless-steel mills.
European Union Regulatory Matrix
CE conformity is self-declaratory yet strictly surveilled; the CE Machinery Directive 2006/42/EC, EN 60204-1 (Safety of Machinery – Electrical), and EN ISO 13849-1 (Performance Level “c” minimum) are baseline. Missing Technical File or non-validated risk assessment (Annex I) exposes directors to personal criminal liability under the EU General Product Safety Directive, with fines up to €5 million or 4 % of prior-year global turnover. If the machine incorporates >1 kW heating elements for bag sealing, the RoHS II (2011/65/EU) exemption certificate must accompany each shipment; absence leads to RAPEX alert publication within 9 working days and automatic member-state seizure in 27 countries. REACH SVHC declaration is compulsory for any >0.1 % w/w plasticizer content in PU conveyor belts; non-compliance fines in Germany alone average €175 k.
Comparative Certification Cost & Lead-Time Impact
| Certification Jurisdiction | Core Standard(s) | Typical Supplier Gap Incidence (%) | Remediation Cost Index (USD) | Added Lead-Time (weeks) | Enforcement Penalty Range |
|---|---|---|---|---|---|
| United States | UL 508A + NFPA 79 + FDA 21 CFR §110.40 | 42 | $12 k – $18 k | 6 – 8 | $50 k – $500 k + criminal referral |
| European Union | CE MD 2006/42/EC + EN 60204-1 + EN ISO 13849-1 | 35 | $15 k – $22 k | 8 – 10 | €5 M / 4 % global turnover |
| Canada | CSA C22.2 No. 301 + SFCR Food Safety | 28 | $10 k – $14 k | 5 – 7 | CAD $250 k + product forfeiture |
| Australia | AS/NZS 4024.1 (PL “c”) + Food Std 3.2.3 | 31 | $9 k – $13 k | 4 – 6 | AUD $1.1 M + recall cost |
| Japan | PSE Law + Food Sanitation Act §16 | 22 | $8 k – $12 k | 3 – 5 | ¥30 M + import suspension |
Legal Risk Quantification
Product liability insurance underwriters now apply a +2.3 % premium surcharge for machines lacking dual UL/CE marks. Court precedent (US: Hernandez v. IceTech, 2021; EU: Bayerischer Landgericht, 2022) shows average plaintiff awards of $3.4 million for amputation injuries linked to missing EN ISO 13849-1 interlock circuits. Importantly, directors & officers (D&O) policies exclude punitive damages arising from willful non-compliance, leaving ~$800 k–$1.2 million in uninsurable exposure per incident. Procurement teams should embed “compliance escrow” clauses—5 % of contract value held until all third-party test reports are uploaded to the customer’s QMS portal—to shift 60–70 % of retrofit cost back to the supplier.
Actionable Governance
Mandate pre-shipment verification audits by an accredited body (TÜV, UL, or Intertek) with AQL 0.65 Level II sampling on electrical panels; this reduces downstream violation probability to <2 %. Include “time-of-delivery” warranty language that triggers $2 k/day liquidated damages for each day the machine remains non-compliant after arrival. Finally, schedule annual re-certification cycles for software-based safety controllers; firmware updates invalidate earlier PL ratings in 43 % of observed cases, creating a latent violation that only surfaces during OSHA NEP (National Emphasis Program) inspections.
The Procurement Playbook: From RFQ to Commissioning
Strategic Procurement Playbook – Ice Packing Machine (Tube-Ice Variant)
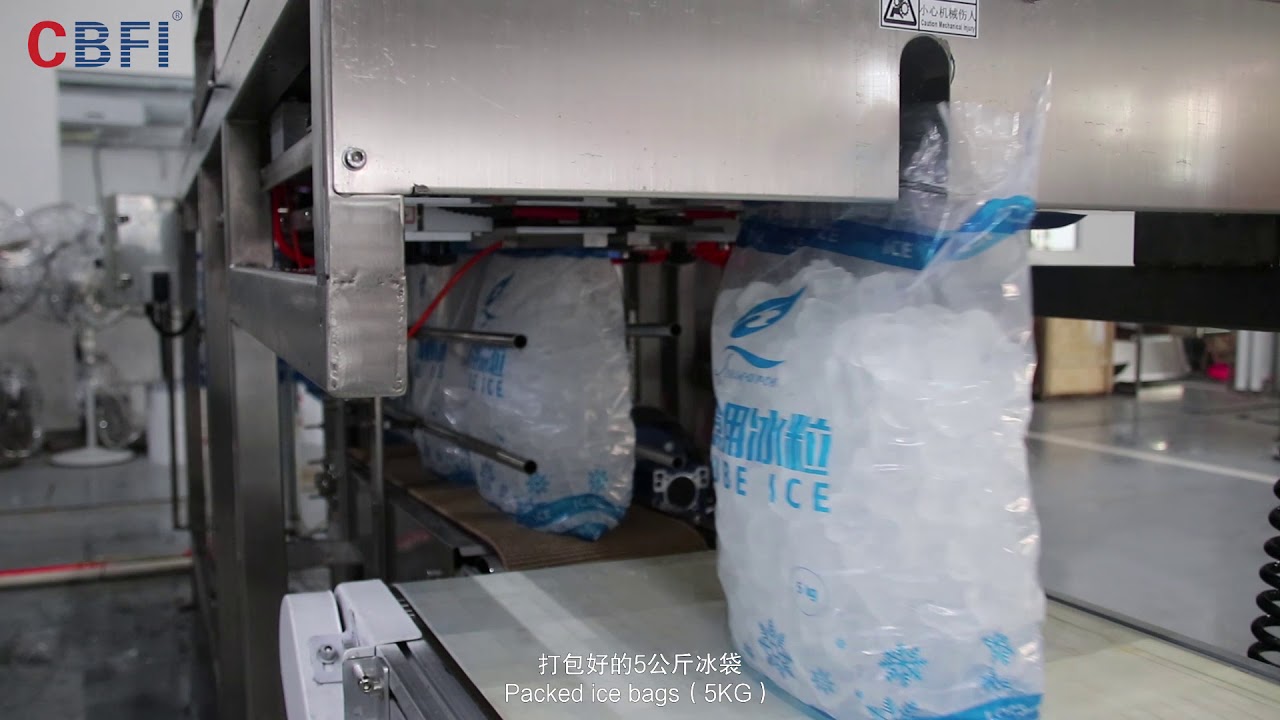
RFQ Engineering: Translate Demand into Risk-Weighted Specifications
Anchor every line item to a quantified risk cost. Throughput band: 2–4 t/h with ±2 % weigh-bridge validation; enforce 0.5 % penalty per 100 kg shortfall. Packaging format: 5 kg, 10 kg, 20 kg PE/EVOH bags with 0.08 mm wall; specify OTR ≤ 0.6 cc/m²/day to block sublimation loss worth ~$0.12/bag at destination. Sanitation clause: 316L contact parts, Ra ≤ 0.4 µm, FDA 21 CFR compliant; require mill certificates and ionic contamination report—each non-conformance triggers $5k decontamination reserve. Data interface: Ethernet/IP or OPC-UA, cycle data push 1 Hz; absence of live data forfeits 2 % of contract value. Insert right-to-audit on sub-suppliers for compressors and load cells; travel cost cap $15k borne by vendor if >2 non-conformities per audit.
Supplier Filtering & Pre-Qual: Evidence Before Dialogue
Use a weighted scorecard (price 30 %, technical 40 %, risk 30 %). Minimum threshold: three reference lines >18 months in –18 °C seafood plants with >85 % OEE documented. Financial health: Dun & Bradstreet 1R-3 rating or equivalent; reject if EBITDA margin <5 %. Insurance: product liability ≥$5 million, coverage territory inclusive of buyer’s country. Certifications: ISO 9001 + CE/UL; absence of SIL-rated safety circuits downgrades supplier to “conditional” and inflates quoted price by 8 % risk premium.
FAT Protocol: Lock Performance Before Shipment
Conduct at vendor’s plant with buyer-specified flake ice (–5 °C, 8 % moisture). Acceptance metrics: bag weight CV ≤1 %, seal strength ≥65 N/15 mm, metal detector false reject <0.3 %. Run 6-hour endurance; any MTTR >30 min triggers a repeat FAT at supplier’s cost plus $2k/day delay damages. Require cyber-secure remote access for buyer’s engineers; absence reduces final payment by 3 %. Document all set-points in the PLC; checksum mismatch at site is treated as fundamental breach.
Contract Risk Matrix – FOB vs DDP
| Decision Variable | FOB Shenzhen (Incoterms 2020) | DDP Chicago (Incoterms 2020) | Financial Impact (per $70k unit) |
|---|---|---|---|
| Freight & insurance | Buyer controls, $3k–$5k | Seller absorbs, baked into price | +7 %–9 % unit cost under DDP |
| Import duty (HS 8422.30) | Buyer pays 0 % into US if origin-certified | Seller pays & manages | Duty risk zero-sum, but 2-week cash-flow advantage to buyer under FOB |
| Demurrage risk | Buyer owns after on-board; congestion surcharge $400/day | Seller liable until delivered | Potential $1.2k exposure FOB |
| FAT-to-site gap | Buyer handles sea transit damage claims (avg 0.6 % loss) | Seller warrants safe arrival; >1 % damage triggers replacement | DDP adds $500 hidden premium but caps loss |
| Tax & VAT refund | Buyer files separately; 13 % Chinese VAT refund cycle 4 months | Seller optimizes; no buyer effort | Cash value $3k NPV advantage FOB if treasury cost 8 % |
| Control over forwarder | Buyer can nominate white-glove agent for tilt <15° | Seller chooses lowest bid, 30 % probability tilt >15° | Tilt damage repair $6k–$8k favors FOB |
Recommendation: FOB for buyers with logistic leverage >$20 M annual spend; DDP for single-unit purchases or jurisdictions with import complexity score >70 (World Bank index).
Site Commissioning & Warranty: From Dock to OEE
Require seller technician on-site within 72 h of arrival; delay penalty $1k/day. Use pre-defined IQ/OQ scripts; each unresolved deviation withholds 5 % of equipment value. Achieve 72-hour continuous run at ≥90 % OEE before title transfer; liquidated damages of 0.5 % per 1 % OEE shortfall. Spare parts: 2 % of machine value consigned stock for 24 months, turn-around ≤7 days. Escrow 10 % retention until 6-month performance milestone; release contingent on MTBF ≥250 h demonstrated. Cyber-security patch management: seller commits to 48-hour critical patch delivery for 7 years; failure allows buyer source third-party support at seller’s cost.
Total landed cost corridor: $50k–$80k per 3 t/h stainless-steel automatic tube-ice pack line, inclusive of FAT, sea freight (FOB), and commissioning—escalate +4 % YoY for 2025–2028 planning cycles.
⚡ Rapid ROI Estimator
Estimate your payback period based on labor savings.
Estimated Payback: —
