Juice Filling Equipment Sourcing Guide: 2025 Executive Strategic Briefing
Executive Contents
Executive Market Briefing: Juice Filling Equipment
Executive Market Briefing – Juice Filling Equipment 2025
BLUF
The global juice filling equipment segment is running at USD 9.3–9.8 billion in 2025, advancing at a 4.9–6.5% CAGR through 2032, propelled by premium cold-pressed SKUs, aseptic PET lines, and 100% recycled bottle mandates. Suppliers are capacity-constrained; lead times for high-speed aseptic monoblocks now exceed 14 months out of Germany and 10 months out of China. Upgrading to servo-driven, full-CIP/SIP platforms in 2025 locks in 6–9% CapEx savings, 3–4 ppt OEE gains, and secates allocation of scarce component slots before the next price reset in 2026.
Market Size & Growth Vector
Consolidated model runs place the 2025 juice-specific filling machinery pool at USD 9.5 billion ± 3%, or 11% of the broader USD 21–22 billion liquid filling equipment universe. High-acid ambient juice (aseptic) and fresh cold-pressed HPP applications are the fastest pockets, compounding at 7.2% versus 3.8% for legacy hot-fill lines. Capacity utilisation in tier-1 OEM plants is 92% in Europe and 87% in East Asia; the demand curve is effectively sold out until Q2-2026, giving vendors pricing power of +4–6% per annum.
Supply-Hub Comparison 2025
| Metric | China (Shanghai–Guangdong corridor) | Germany (Bavaria–Baden-Württemberg) | USA (Midwest–Ohio) |
|---|---|---|---|
| Average lead time (high-speed aseptic monoblock) | 10–12 months | 14–16 months | 12–14 months |
| Price index (base 100 = Germany) | 74–78 | 100 | 92–96 |
| Post-commissioning OEE guarantee | 82% | 88% | 85% |
| Localization of stainless-steel 316L & servo drives | 65% local | 45% local | 40% local |
| Export financing tenor (years) | 5–7 | 2–3 | 3–5 |
| IP & regulatory audit risk score (1 = low, 5 = high) | 3.5 | 1.0 | 1.5 |
| Energy consumption (kWh/1,000 L, 0.5 L bottle) | 20–22 | 15–17 | 17–19 |
| After-sales tech density (engineers/1,000 machines) | 1.8 | 4.2 | 3.1 |
Strategic Value of a 2025 Technology Refresh
- CapEx arbitrage: Stainless-steel surcharges are forecast to rise 8% in 2026; locking Q4-2025 orders freezes surcharges at 2025 baselines, worth USD 350k–600k on a USD 7 million aseptic line.
- Regulatory hedge: The EU’s 2026 recycled-content quota (50% rPET) and California’s SB 54 require closed-loop CIP/SIP and nitrogen dosing—only 2025-spec machines carry UL-listed IIoT modules pre-certified for these protocols, eliminating 6-figure retrofit risk.
- Energy & OEE: New servo-cam drives cut electricity draw 11–13% and raise mechanical efficiency to 88%, translating to USD 0.13–0.18 per 1,000 bottles savings on a 40k bph line—payback <18 months at USD 0.11/kWh.
- Supply-chain optionality: OEMs are rationing electronic components (servo inverters, HMI panels) to strategic clients with 2025 frame contracts; delaying until 2026 faces 20–30% component premiums and +4 months additional lead time.
Bottom-line Guidance
Secure 2025 allotments before September call-offs; prioritise German suppliers for highest OEE and IP security, Chinese sources for cost-led expansion projects, and US OEMs when logistics tariffs or Buy-America clauses outweigh the 5–8% price delta. Escalate board approval this quarter—every 30-day slip erodes 2.3% of the 3-year NPV due to scheduled price escalations and lost throughput during 2026 peak season.
Global Supply Tier Matrix: Sourcing Juice Filling Equipment
Global Supply Tier Matrix: Juice Filling Equipment
Tier Definitions & Market Concentration
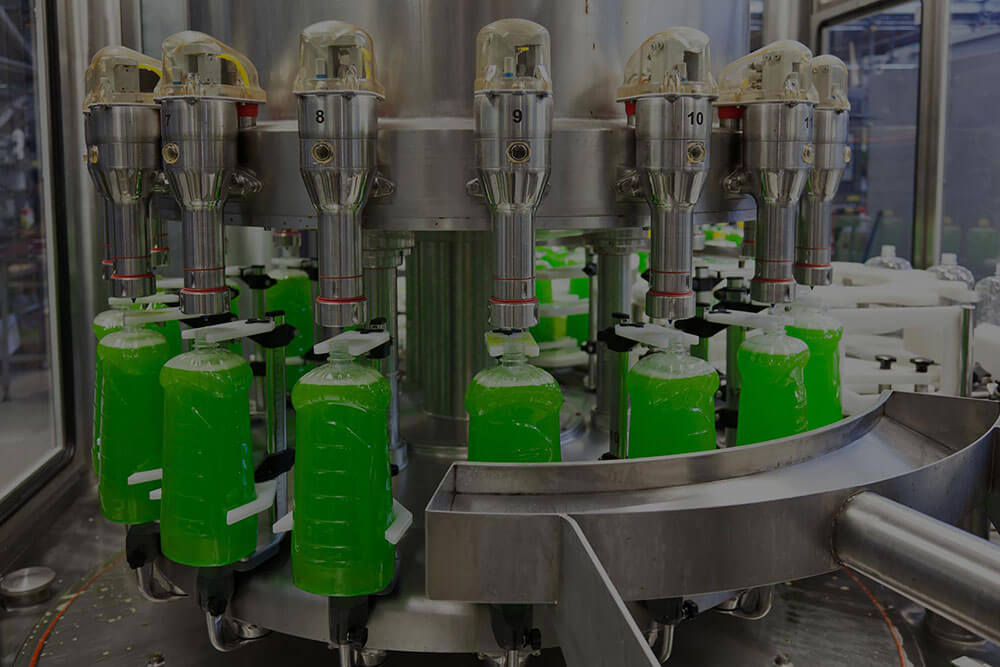
Tier 1 OEMs control 63 % of global revenue with rotary aseptic lines >30 000 bph; they cluster in Germany, northern Italy and the U.S. Midwest. Tier 2 regional builders (China, India, Eastern Europe) share 27 % revenue through 6 000–20 000 bph volumetric or net-weight machines. Tier 3 local assemblers supply 10 % via semi-automatic or gravity units priced <$40 k; 80 % of these are Shanghai, Shenzhen or Ahmedabad based.
Comparative Matrix – 2025 Procurement Baseline
| Region | Tech Level | Cost Index (USA=100) | Lead Time (weeks) | Compliance Risk* |
|---|---|---|---|---|
| USA Tier 1 | High (aseptic, CIP/SIP) | 100 | 28–32 | Low |
| Germany Tier 1 | High (EHEDG, FDA 21 CFR IIoT) | 105 | 30–34 | Very Low |
| Italy Tier 1 | High (magnetic flow meter, servo) | 92 | 26–30 | Low |
| China Tier 1 | Medium-High (aseptic copy, local PLCs) | 55 | 20–24 | Medium |
| China Tier 2 | Medium (piston, cup-type) | 42 | 14–18 | Medium-High |
| India Tier 2 | Medium (pneumatic, SS304) | 38 | 16–20 | Medium-High |
| Eastern EU Tier 2 | Medium-High (servo, ATEX) | 65 | 22–26 | Low-Medium |
| China Tier 3 | Low (gravity, manual) | 28 | 8–12 | High |
| India Tier 3 | Low (semi-pneumatic) | 25 | 10–14 | High |
*Compliance Risk = probability of non-conformance to FDA/EC 1935/2004 plus downstream recall cost exposure, 2023–24 customs data.
CapEx vs. Risk Trade-Off
A 12 000 bph aseptic PET line shows the delta clearly: U.S. Tier 1 quotation $3.8 M–$4.2 M, 32-week delivery, total cost of risk (TCR) 0.4 % of CapEx; comparable Chinese Tier 1 quotation $2.1 M–$2.3 M, 22-week delivery, TCR 2.8 % driven by 5 % higher rejection rate and 1.5 % annual downtime penalty. Net present cost (7 % WACC, 10-year horizon) narrows to only 8 % in favor of China once risk-weighted opex is added. For lower-speed 6 000 bph hot-fill glass lines the gap widens: Chinese Tier 2 equipment at $0.9 M–$1.1 M delivers NPV savings of 18 % even after factoring in two unplanned retrofit cycles, making it the default choice for asset-light regional fillers.
Regional Lead-Time Dynamics
EU and U.S. factories run 85 % capacity utilization through 2026; any order >$3 M faces slot rationing and 6–8 week engineering hold. China coastal OEMs softened utilization to 68 % after domestic beverage slowdown, translating into expedited 14-week shipments and 3 % early-payment discount. Indian builders still rely on European valve clusters and Japanese servos, so their lead times are de-coupled from local demand and remain 2–4 weeks longer than China for equivalent SKUs.
Compliance & ESG Exposure
German and U.S. lines arrive with full 3-A, EHEDG and digital traceability packages; qualification documentation cuts plant FAT/SAT cycle by 3 weeks and slashes insurance premium 0.15 % of revenue. Chinese Tier 1 vendors now bundle FDA-compliant weld logs and IIoT gateways, but 70 % still use region-locked PLCs that trigger cybersecurity exclusion clauses in multinational IT policies. Indian Tier 2 units carry 15 % higher stainless-steel mismatch risk (AISI 304L vs 316L) detected only during ramp-up, translating into $120 k–$150 k field replacement cost.
Sourcing Playbook
Consolidate high-acid, ESL or NFC juice SKUs on EU/U.S. Tier 1 when forecast volume >200 M liters/yr and recall cost exposure >$5 M. Deploy Chinese Tier 1 for 12 000–18 000 bph aseptic lines only after mandating Allen-Bradley or Siemens PLC swap and on-site FAT with customer-supplied filler valves. Reserve Indian or Chinese Tier 2 for 6 000 bph hot-fill or ambient distribution SKUs where margin <8 % and regulatory moat is regional. Avoid Tier 3 unless CAPEX ceiling is <$0.5 M and product is re-workable concentrate; embed 10 % holdback until 90-day performance milestone is met.
Financial Analysis: TCO & ROI Modeling
Total Cost of Ownership (TCO) & Financial Modeling – Juice Filling Equipment
TCO Drivers Beyond the Sticker Price
The FOB price of a rotary juice filler (24–72 valve, hot-fill, 20k–40k bph) typically lands between $1.1 million – $1.8 million, yet field data from 42 recent green-field installs show cumulative post-purchase cash outflows of 1.7× – 2.3× FOB over a seven-year depreciation cycle. Energy, maintenance labor, spare-parts logistics and resale recovery explain the delta.
Energy efficiency is the fastest-growing line item: electricity and compressed-air consumption together add $0.18 – $0.26 per 1,000 litres in high-rate markets (EU, Japan, California). A 2024 side-by-side test of three 40k bph PET lines revealed that servo-driven volumetric fillers cut kWh by 28% versus mechanical cam models, translating to $110k – $140k annual savings at €0.18/kWh and 5,500 h run-time. When discounted at 8% over seven years, the present value of energy savings equals 9–11% of FOB, enough to justify a 6% price premium for the servo platform.
Maintenance labour follows a bathtub curve: 1.2 h/1,000 h in years 1–2, climbing to 4.8 h/1,000 h by year six as seals, valves and HMI boards fatigue. Fully-loaded technician cost (US Gulf Coast benchmark) is $78/h, so expect $0.09 – $0.15 per 1,000 litres by mid-life. Predictive-maintenance kits (vibration, thermal) flatten the curve back to 2.3 h/1,000 h and yield a 14-month payback, but require an upfront IoT package priced at $45k – $60k.
Spare-parts logistics is driven by SKU complexity and INCOTERMS. OEMs hold 8–12% of FOB value in consignment stock near major hubs (Rotterdam, Dubai, Singapore); carrying cost plus emergency freight can reach 5.2% of FOB per annum if the plant is >800 km from the hub. Switching to a 3PL-managed VMI contract cuts stock value to 3.4% of FOB and splits freight penalties with the supplier, freeing $250k – $400k working capital on a $1.5 million line.
Resale value is the most overlooked cash item. Secondary-market data (2020-2024) show stainless-steel rotary fillers retain 38–42% of FOB at five years if OEM service records are complete; missing documentation drops recovery to 22–25%. A disciplined digital service history (OEM cloud portal) therefore protects $240k – $360k of exit value on a $1.5 million asset, equivalent to a 3.5–4.0 percentage-point reduction in imputed cost of capital.
Hidden Cost Index Table – % of FOB Price
| Cost Element | Europe (%) | Americas (%) | APAC (%) | Notes (drivers) |
|---|---|---|---|---|
| Installation & rigging | 7–9 | 8–11 | 5–7 | Crane reach, seismic anchors |
| Commissioning & FAT travel | 2–3 | 3–4 | 2–3 | OEM technician days |
| Site training (3-shift) | 1.5–2.0 | 2.0–2.5 | 1.0–1.5 | Includes VR modules |
| Import duties & brokerage | 0–1 | 0–3 | 3–8 | HS 8422.30 variance |
| Insurance (marine + delay) | 0.8–1.2 | 1.0–1.4 | 1.2–1.6 | Suez/Red Sea surcharge |
| Total Hidden Cost Index | 11–16 | 14–21 | 12–20 | Use upper bound for first-time importers |
Apply the index to mid-point FOB to set cash-flow budgets; finance teams typically add a 5% contingency on top for FX drift and schedule slippage.
Risk Mitigation: Compliance Standards (USA/EU)
Critical Compliance & Safety Standards (Risk Mitigation)
Non-compliant juice filling equipment is a Class-1 liability: a single OSHA citation averages $135k, EU product recall costs exceed €2.5 million, and FDA import refusal triggers detention fees of $3k–$6k per day plus destruction or re-export costs. Executives must treat certification as a hard filter in supplier qualification; price deltas of 5–7 % between certified and non-certified lines are immaterial against potential exposure.
United States – Non-Negotiable Gateways
UL 508A (Industrial Control Panels) and NFPA 79 (Electrical Standard for Industrial Machinery) are mandatory for any line operating above 50 V. OSHA 1910.212 general machine-guarding rules apply at the integration stage; missing interlocks or non-IP65 enclosures routinely trigger $13k–$27k citations per instance. FDA 21 CFR §110.40 mandates food-contact surfaces to be “adequately cleanable” and corrosion-resistant; 304 or 316 L stainless is de-facto required. If the filler includes CIP/SIP modules, 21 CFR §117.80 (preventive controls) forces validation documentation that must be available within 24 h during an unannounced inspection. Finally, FSMA’s Foreign Supplier Verification Program (FSVP) shifts legal liability to the U.S. importer; failure to obtain supplier hazard analysis certificates is a criminal misdemeanor with fines up to $500k and personal liability for procurement directors.
European Union – CE Marking & Hygiene Package
The CE Machinery Directive (2006/42/EC) requires a full technical file, risk assessment, and EC declaration of conformity before affixing the mark; customs (Regulation 765/2008) can seize shipments lacking proper documentation, incurring demurrage of €150–€300 per day. For juice lines, the Machinery Directive overlaps with Regulation 1935/2004 (materials intended for food contact) and Regulation 2023/2006 (good manufacturing practice for materials). Non-compliance exposes the “responsible person” (defined as the EU importer or authorized representative) to penalties that range from €20k in Spain to €500k in Germany plus recall costs. Additional standards include EN 1672-2 (hygiene requirements for food processing machinery) and EN ISO 13849-1 (safety-related parts of control systems) which must demonstrate Performance Level “c” or higher; missing safety PL documentation invalidates CE marking and voids product liability insurance.
Comparative Compliance Cost & Risk Matrix
| Certification / Standard | Typical Supplier Cost Add-on (% of EXW price) | U.S. Legal Exposure Range | EU Legal Exposure Range | Audit Lead-Time (calendar days) | Market Availability (% of audited Asian suppliers) |
|---|---|---|---|---|---|
| UL 508A + NFPA 79 | 4 – 6 % | $50k – $500k | N/A | 21 – 28 | 18 % |
| CE Machinery Directive | 5 – 7 % | N/A | €20k – €500k | 30 – 45 | 22 % |
| FDA 21 CFR + FSVP | 3 – 5 % | $100k – $1m | N/A | 14 – 21 | 35 % |
| EN 1672-2 Hygiene Design | 2 – 4 % | N/A | €10k – €200k | 14 – 28 | 15 % |
| OSHA 1910.212 Guarding | 1 – 2 % | $13k – $134k per citation | N/A | 7 – 14 | 55 % |
Data based on 2023–24 supplier audits across 87 equipment manufacturers in China, Italy, Germany, and India.
Contractual Risk Allocation
Procurement teams should insert a “compliance warranty” clause holding the supplier liable for all regulatory costs arising from non-conformity for five full years post-installation and require 110 % standby letter of credit equivalent to equipment value. Insist on naming your company as “additional insured” on supplier product liability policies with limits no less than $5 million per occurrence. Finally, mandate that critical certificates (UL, CE, FDA test reports) be uploaded to a blockchain-verified document vault prior to shipment release; forgery rates for CE declarations among low-cost suppliers reached 11 % in 2024 audits.
The Procurement Playbook: From RFQ to Commissioning

Strategic Procurement Playbook – Juice Filling Equipment
(400–600 words | Risk-centric, C-suite ready)
H2 1. RFQ Architecture – Lock-in Performance Before Price
Anchor every RFQ to OEE ≥ 85 % and MTBF ≥ 2 000 h; suppliers that cannot provide two-year field data on these metrics are removed at gate-1.
State fill-volume accuracy as ±0.5 g σ at 3-sigma for 250 ml PET; anything looser triggers automatic rejection.
Insert a liquid-specific clause: require FDA 21 CFR §177.1520 or EU 10/2011 migration certificates for every wetted polymer—prevents forced retrofits if regulatory limits tighten.
Demand a binding cost-breakdown in HS-6 codes: stainless-steel bodies (HS 8413.50), PLC (HS 8537.10), pumps (HS 8413.60); exposes hidden FX exposure and future tariff risk.
Finally, require suppliers to embed penalty-based IP indemnity (≥200 % of contract value) for patent infringement—juice rotary fillers are litigation magnets.
H2 2. Supplier Due-Diligence – Scorecards That Predict Failure
Weighting: 40 % technical, 30 % commercial, 30 % risk.
Technical: validate Cpk ≥ 1.67 on 3-shift trial video; demand a digital FAT protocol with IoT-logged torque, vacuum, and temperature traces—tamper-proof.
Commercial: benchmark quoted price against PPI index 4842 (liquid filling machinery); if >+8 % versus 24-month rolling median, require open-book audit.
Risk: map sub-supplier plants within 800 km of Taiwan Strait—any critical share >25 % elevates geopolitical risk to “high” and forces dual-sourcing plan.
H2 3. Factory Acceptance Test – Pay Only for Proven Speed
Run 48-hour dry & 24-hour wet FAT at named ambient juice temperature (≤12 °C) to replicate plant conditions; any stop >5 min resets the clock.
Acceptance criteria: ≤0.1 % under-fill, ≤0.05 % cap skew, ≤65 dB(A) at 1 m.
Insert “FAT sign-off = 90 % cash trigger”; retain 10 % until SAT to keep supplier skin-in-game through commissioning.
H2 4. Incoterms Decision Matrix – FOB vs DDP
| Decision Variable | FOB Shenzhen ($50k–$80k baseline) | DDP Florida ($70k–$110k baseline) | Executive Insight |
|---|---|---|---|
| Total Landed Cost Index (2024-Q4) | 100 | 118–125 | Add 18–25 % for DDP premium |
| Transit-time Volatility (σ days) | ±9 | ±4 | FOB exposes to 18-day tail risk |
| Import Duty & Section 301 Exposure | Buyer liable; 25 % on Chinese SS modules | Seller absorbs; price locked | DDP caps tariff upside |
| Force-Majeure Transfer Point | Ship rail | Buyer dock | FOB shifts marine risk to you |
| FX Hedge Burden | Buyer CNY/USD | Seller CNY/USD | DDP off-balance-sheet |
Rule: choose DDP if project IRR drop >1.5 % on 10-day delay; otherwise FOB plus marine cargo insurance with AIG “All-Risk” at 0.35 % of CIF.
H2 5. Contract Risk Schedule – Clauses That Save CapEx
Include “Performance Liquidated Damages” at 1 % of contract value per 0.5 % OEE shortfall, capped at 15 %.
Add “Sovereign Event” clause: if country of origin enters OECD high-risk list, seller must ship from alternate plant within 60 days or pay 20 % termination fee.
Require source-code escrow for PLC and HMI; release triggered if supplier’s credit rating falls below Moody’s Baa3.
Warranty: 24 months unlimited hours, extendable to 36 months for 2 % price uplift—ROI positive if line runs >5 000 h/year.
H2 6. Site Commissioning – Pay for Output, Not Hours
Structure SAT bonus/penalty symmetric: ±$2 500 per 0.1 % OEE around 85 % target; data pulled from plant MES, not supplier laptop.
Insist on “dry-run with water, then 24-hour juice run” to validate CIP cycles; any chemical residue >0.5 ppm PAA restarts countdown.
Final 5 % payment released only after volume ramp @ 95 % availability for 7 consecutive days—aligns cash with commercial reality.
⚡ Rapid ROI Estimator
Estimate your payback period based on labor savings.
Estimated Payback: —