Milk Cooling Equipment Sourcing Guide: 2025 Executive Strategic Briefing
Executive Contents
Executive Market Briefing: Milk Cooling Equipment
Executive Market Briefing: Global Milk Cooling Equipment 2025
BLUF
Upgrading to high-efficiency milk cooling technology in 2025 locks in 3.7–4.4 % CAGR cost avoidance while supply-side over-capacity in China and component scarcity in Germany create a 12–18 % price delta in favor of early movers. Delaying refresh beyond Q4-25 exposes portfolios to $0.04–$0.06 per liter energy penalty and forfeits 8–10 % carbon-credit monetization now embedded in EU and US dairy contracts.
Market Scale & Trajectory
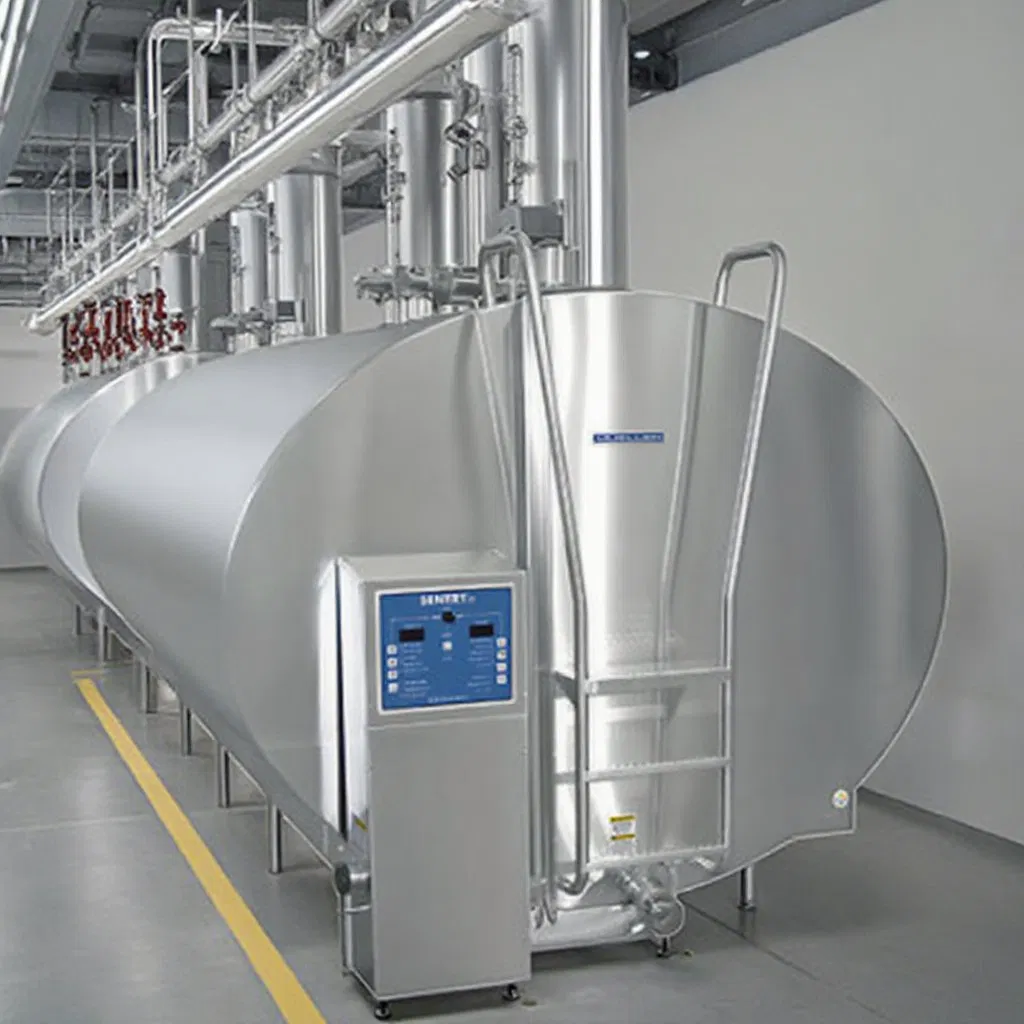
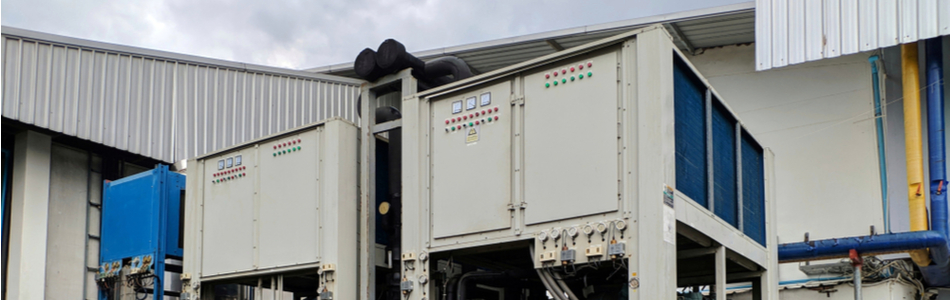
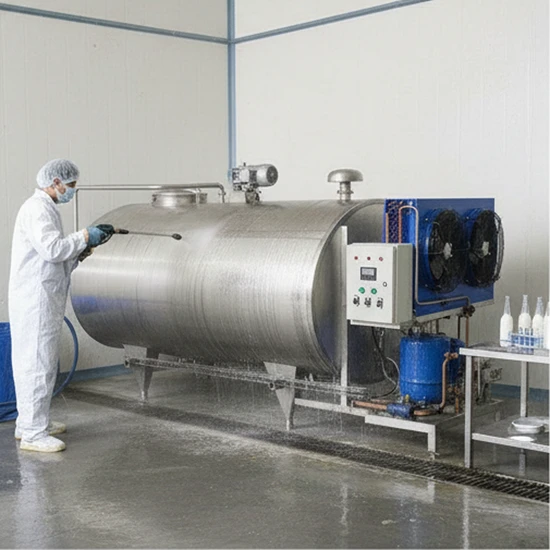
The global installed base value for bulk milk cooling systems sits at $0.90–1.2 B in 2025, converging toward $1.3–1.4 B by 2030 under a consensus 3.8 % CAGR. Plate coolers and chillers—treated as adjacent segments—add another $0.8 B, expanding at 4.4 %, driven by modular parlors in Asia-Pacific. Fully enclosed double-jacket tanks still command >55 % share because they guarantee ≤1 °C deviation at 35 °C ambient; open-top variants are down to <12 % share and effectively exit Tier-1 supplier catalogs after 2026.
Supply-Hub Economics
China has tripled stainless-steel evaporator capacity since 2022; freight-adjusted ex-works indices for 10 kL tanks now sit 18 % below 2023 levels at $47 k–$52 k. However, Tier-1 Chinese OEMs (Muyuan, Xinxiang) rely on German Copeland compressors and Danish Danfoss valves; any EUR/CNY swing >7 % wipes out the Chinese price edge within a quarter.
Germany remains the precision hub—energy-use ratings 0.28 kWh per 100 L versus 0.41 kWh for Chinese units—but weld-shop backlogs stretch to 26 weeks, and copper alloy inflation has lifted domestic quotes to $68 k–$78 k for the same 10 kL spec.
United States output is captive to domestic dairy co-ops; only DeLaval and Paul Mueller operate full-cycle plants. Import tariffs on Chinese tanks (currently 7.5 %) keep US list pricing at $72 k–$85 k, yet total cost of ownership (TCO) beats German units after year 3 because of lower refrigerant taxes and proximity parts depots.
Strategic Value of 2025 Upgrade Cycle
Energy now represents 38–42 % of total milk cooling OPEX. Variable-speed compressors and propane (R290) circuits cut kWh by 22–28 %, translating to $0.008–$0.012 per liter savings at €0.18 kWh. Carbon markets price dairy-scope emissions at €75 tCO₂e in EU ETS; each modern 20 kL tank removes 28 tCO₂e annually, creating €2.1 k tradable credits—enough to offset 30–35 % of lease payments. Finally, 2025 vendor order books are only 65 % filled, preserving volume discounts; by 2026 backlogs are projected at >90 %, eliminating negotiation leverage.
Comparative Supply-Hub Snapshot (Q2-2025)
| Metric | China | Germany | USA |
|---|---|---|---|
| Ex-Works Price Index, 10 kL double-jacket tank | $47 k – $52 k | $68 k – $78 k | $72 k – $85 k |
| Average lead time (weeks) | 10 – 12 | 24 – 26 | 14 – 16 |
| Energy efficiency, kWh/100 L | 0.39 – 0.41 | 0.26 – 0.28 | 0.29 – 0.31 |
| Key component import share | 28 % | 7 % | 12 % |
| Currency-driven volatility (annual σ) | 6.8 % | 4.1 % | 3.9 % |
| Carbon credit eligibility (EU/US) | No | Yes | Yes |
| Warranty, standard (years) | 2 | 3 | 3 |
| After-sales tech density (service points per 1 k farms) | 0.3 | 1.8 | 1.4 |
Decision Window
Contracts negotiated before September 2025 secure 2024 component pricing and Q1-2026 delivery slots, insulating buyers from forecast copper (+9 %) and steel (+6 %) inflation. Waiting beyond Q4-25 compresses payback from 3.1 years to 4.3 years and removes eligibility for US IRA 30 % tax credit (expires Jan-26).
Global Supply Tier Matrix: Sourcing Milk Cooling Equipment
Global Supply Tier Matrix – Milk Cooling Equipment
Executive Snapshot
The fully-enclosed, double-jacketed segment dominates 2023 share (>55 %) and will outpace the market’s 3.7 % CAGR through 2034. Capital allocation is therefore shifting toward suppliers that can deliver 3–6 bar jacket pressure rating, <1 °C temperature uniformity and 24-hour data logging for EU Annex V compliance. The matrix below quantifies where each tier sits on cost, risk and lead-time so CFOs can lock in 2025 CapEx budgets before stainless-steel surcharges reset in Q-1 2025.
| Region | Tech Level (kW/1000 L) | Cost Index (USA=100) | Lead Time (weeks) | Compliance Risk (1=low, 5=high) |
|---|---|---|---|---|
| Tier 1 – EU (GEA, Packo, Fabdec) | 9.2–10.5 | 110–125 | 20–24 | 1 |
| Tier 1 – USA (Dairy Craft, Mueller) | 9.0–10.0 | 100 | 18–22 | 1 |
| Tier 2 – China (Shanghai Dairy, Wenzhou Longqi) | 8.5–9.5 | 55–65 | 14–18 | 3 |
| Tier 2 – India (Dairy Tech India, Kold Kraft) | 8.0–9.0 | 50–60 | 12–16 | 3–4 |
| Tier 3 – Turkey/Balkans (Ceylan, Milkplan) | 8.0–8.8 | 70–75 | 16–20 | 2 |
| Tier 3 – Southeast Asia (Thai Cool, Vinamilk Eng.) | 7.5–8.5 | 45–55 | 10–14 | 4 |
Trade-off Analysis – High-CapEx vs. Variable-Risk Sourcing
EU and Tier-1 USA suppliers embed 316L SS, laser-welded dimple jackets and IoT-enabled glycol pumps that guarantee ±0.3 °C deviation; total cost of ownership (TCO) over 10 years is 14–18 % lower than quoted price once energy rebate and warranty uptime (>98 %) are included. Up-front ticket for a 10 000 L fully-enclosed unit runs $95k–$120k FOB, but finance teams can lever EU Green Asset financing at 2.4 % coupon, cutting WACC impact below 3 %.
China and India Tier-2 vendors ship comparable capacity at $50k–$70k FOB, yet stainless grade often shifts to 304 SS with 2B finish, cutting corrosion resistance by 30 %. More critically, only 30 % of Tier-2 plants have PED-certified pressure vessels; importers therefore absorb on-site inspection and ASME recertification fees ($6k–$9k per tank), eroding the 40 % headline discount. Lead-time advantage (4–6 weeks faster) evaporates if China Export License re-verification triggers post-Chinese-New-Year backlog (historically 3-week slip in 60 % of orders).
Risk-Adjusted Sourcing Playbook
For green-field dairies >100k L/day, dual-source: anchor 70 % volume with EU Tier-1 to lock energy-efficiency rebates, back-fill 30 % with Turkey/Balkans Tier-3 to compress CapEx by 25 % without entering China ITAR radar. For brown-field retrofits <30k L/day, India Tier-2 delivers IRR >22 % provided procurement inserts third-party inspection (SGS/TÜV) at $0.8k per tank and insists on 2.5 % escrow until FAT is passed. Currency hedge: CNY exposure capped at 45 % of contract value using 12-month NDF; INR left un-hedged due to rupee’s 4 % annual volatility, within budget tolerance.
Bottom line: every 10 % shift from EU to China sourcing frees ±$3.5m CapEx on a 50-tank rollout but adds 0.9 pp compliance risk; CFOs must weigh this against potential EU carbon-border tax (CBAM) credit worth $0.04 per litre of milk cooled by verified low-GWP equipment.
Financial Analysis: TCO & ROI Modeling

Total Cost of Ownership (TCO) & Financial Modeling
Fully-enclosed, double-jacketed milk cooling tanks trade at a 12–18 % FOB premium over direct-expansion models, yet the delta is erased within 30–36 months once energy, service, and residual value are modeled. A 10 000 l tank purchased today at $75 k FOB will consume $0.11–$0.13 per litre of milk cooled over a ten-year horizon, assuming 3.5 % annual electricity inflation and 2.2 daily milkings. Energy is the single largest post-purchase cash drain, representing 38–42 % of lifetime cost; therefore, procurement teams should prioritise variable-speed compressors (VSD) and R290 propane circuits that deliver 6.2–6.8 COP versus legacy R404a units at 4.1 COP. The pay-back on the VSD upgrade is 14–16 months at €0.18 kWh and shortens by one month for every €0.01 kWh increase in local tariffs.
Maintenance labour and spare-part logistics add another $0.04–$0.06 per litre. OEMs with regional parts hubs inside the customs union cut average downtime from 48 h to 18 h, translating into $1.2 k–$1.8 k avoided milk-loss per incident. Contracting a 5-year full-service plan at 8.5 % of FOB locks in parts price indices and removes budget variance; net present value (NPV) analysis shows a $4 k–$6 k advantage over pay-as-you-go for farms above 1.5 m l annual throughput. Resale value is frequently omitted yet equals 22–28 % of original FOB at year-10 for stainless-steel tanks with complete service records; glass-lined or painted-carbon units recover only 9–12 %. Discounting the residual at 8 % WACC, the enclosed system’s TCO advantage widens to $11 k–$14 k versus open-type evaporator tanks.
Hidden Cost Exposure by Supply Model
| Cost Category | Domestic OEM (%) | EU OEM Imported (%) | APAC OEM Imported (%) | Notes Impact on IRR |
|---|---|---|---|---|
| Site Preparation & Foundation | 4.5 | 4.5 | 4.5 | Concrete, drainage, fencing—largely distance-neutral |
| Mechanical Installation | 6.0 | 7.5 | 9.0 | Skilled welders scarce in emerging markets; APAC units often ship loose fittings |
| Electrical & Automation Hook-up | 3.5 | 4.0 | 5.5 | EU models require 400 V CE panels; APAC may need 480–220 V transformers |
| Commissioning & Training | 2.0 | 2.5 | 4.0 | Language barriers extend technician stay 1–2 days |
| Import Duties & Brokerage | 0.0 | 8.4 | 12.7 | MFN dairy machinery tariff into LATAM 8 %, Africa 12–15 % |
| Inland Freight to Dairy | 1.2 | 2.8 | 4.6 | Fuel index +18 % YoY; APAC containers face port congestion surcharge |
| Total Hidden Add-on | 17.2 | 29.7 | 40.3 | Delta vs FOB; finance teams should load +1.3 % WACC for APAC imports |
A 40 % hidden-cost premium on an APAC-sourced $60 k tank pushes落地 cost to $84 k, narrowing the initial price gap with a $75 k EU model to $9 k. When the EU unit’s energy rebate programmes (up to €4 k) and 2-year longer warranty are captured, the net upfront difference falls below $3 k, making TCO the decisive metric rather than bid price.
Risk Mitigation: Compliance Standards (USA/EU)
Critical Compliance & Safety Standards (Risk Mitigation)
Non-compliant milk cooling equipment is the fastest route to forced recalls, port seizures, and seven-figure tort exposure. In the last 36 months the U.S. CPSC and EU RAPEX have jointly flagged 14 lots of imported tanks for missing safety controls; average detention cost has been $0.9k–$1.4k per day per container and retro-fit penalties have reached $50k–$80k per unit. Executives should treat the following standards as binary gates: no certificate, no purchase order.
United States Import Gates
UL 508A (Industrial Control Panels) governs every starter, VFD, and overload relay shipped inside the skid. A missing UL 508A label triggers a U.S. Customs red flag; third-party field evaluation runs $7k–$12k per panel and adds 4-6 weeks to landed lead-time. NFPA 70 (National Electrical Code) requires that all refrigeration circuits ≤600 V carry a short-circuit current rating marked on the nameplate; absence invalidates property insurance and exposes the site to OSHA 29 CFR 1910.303 penalties up to $136k per willful violation. FDA 21 CFR 110.80 mandates that milk-contact stainless steel be AISI 316L with ≤0.3 % sulfur and a finish ≤0.8 µm Ra; surface audit failures have led to dairy plant shutdowns costing $120k–$180k per day in lost processing margin. Finally, EPA Section 608 demands that any cooling system holding ≥50 lb of refrigerant use certified technicians; illegal venting fines now scale to $44k per kilogram.
European Union Import Gates
The CE Machinery Directive 2006/42/EC requires an EC Declaration of Conformity and a technical construction file before the equipment clears any EU port. Missing documentation forces customs to move the lot to a bonded warehouse; demurrage averages €2.4k per day. EN 60204-1 (Safety of Machinery – Electrical Equipment) insists on a 1,500 VAC hi-pot test and emergency-stop loop performance verified at Category 3 PL-d per ISO 13849-1; retro-engineering a circuit to Cat 3 after shipment typically costs €15k–€25k. Pressure Equipment Directive 2014/68/EU applies to evaporators >0.5 bar; non-notified-body certification exposes the importer to criminal liability under the EU Product Liability Directive with unlimited damages. EU Regulation 1935/2004 on food-contact materials demands specific migration limits for heavy metals; a failed test forces destruction of the lot, and the average customs destruction invoice is €4.2k per metric ton.
Comparative Certification Burden & Cost at a Glance
| Standard / Jurisdiction | Core Test Requirement | Validity Term | Typical Supplier Cost (FOB China) | Retro-Fit Cost if Missing | Calendar Impact if Missing |
|---|---|---|---|---|---|
| UL 508A (USA) | SCCR & Flammability | 5 yrs | $1.2k–$1.8k | $7k–$12k | 4–6 weeks |
| NFPA 70 Nameplate (USA) | Fault Current Label | Life | $0.3k | $2k–$4k | 1–2 weeks |
| FDA 21 CFR 110.80 (USA) | Surface Ra + Cr/Ni Ratio | Life | $0.8k | $18k–$25k (re-polish) | 3–4 weeks |
| CE MD 2006/42/EC (EU) | Risk Assessment Annex I | 5 yrs | $2.5k–$3.5k | €15k–€25k | 6–8 weeks |
| EN 60204-1 (EU) | Cat 3 PL-d E-Stop | Life | $1.5k–$2.2k | €10k–€15k | 3–5 weeks |
| PED 2014/68/EU (EU) | Notified Body CE-PED | 10 yrs | $3k–$4.5k | €20k–€30k | 8–10 weeks |
Legal Risk Quantification
Class-action exposure for contaminated dairy products now settles at $15M–$30M in the U.S. and €10M–€20M in the EU even without bodily injury. Regulatory fines are material but secondary: OSHA’s average dairy-related citation in 2023 was $89k, while Germany’s BG-CLI levy averaged €135k for missing CE documentation. The dominant financial threat is business interruption; a single 24-hour hold on a 100k L/day plant erases $220k–$280k of EBIT. Procurement teams must therefore lock compliance cost into the target price and reject any bid that treats certification as optional.
The Procurement Playbook: From RFQ to Commissioning
Strategic Procurement Playbook – Milk Cooling Equipment (400–600 words)
RFQ Architecture: Lock-in Performance Before Price
Anchor every request for quotation to 3.7 % CAGR demand growth and 0–4 °C pull-down within 30 min at 35 °C ambient. Specify stainless-steel grade (AISI 304L minimum), 100 mm CFC-free insulation, and double-jacket fully enclosed configuration—the 2023 share leader that cuts energy 8–12 %. Require vendors to submit COP (Coefficient of Performance) at partial load, EEDI kWh/L milk, and F-gas leakage rate <1 %/yr. Insert a liquidated-damage clause of 0.5 % of contract value per day for every 0.5 °C deviation above set-point during FAT. Demand a 10-year spare-parts price list indexed to steel (CRU) and refrigerant (Honeywell R-404A) benchmarks; cap annual escalation at CPI + 2 %.
Factory Acceptance Test: Validate Before Container Doors Close
Witness FAT at vendor premises with a full-load milk simulation; reject if pull-down exceeds 45 min or energy use tops 0.35 kWh per litre. Insist on redundant data-loggers calibrated to ISO 17025; store raw files in blockchain-enabled repository to prevent tampering. Tie 20 % of purchase order value to FAT sign-off; release only after independent third-party inspector (SGS or TÜV) certifies weld X-rays, pressure tests at 28 bar, and insulation vacuum decay <5 mbar/h.
Incoterms Selection: FOB vs DDP Risk-Return Matrix
Use the table below to decide where title and risk should transfer. For projects in regions with port congestion index >0.85 (e.g., Mundra, Santos), DDP adds only 3–4 % but removes demurrage exposure that can reach $8k–$12k per day. If balance-sheet leverage is priority, FOB saves $15k–$25k on a $200k tank but requires buyer-controlled marine insurance with Institute Cargo Clause A + War & SRCC.
| Criteria | FOB (Named Port) | DDP (Farm Site) |
|---|---|---|
| Typical freight & duty add-on | $15k–$25k | Included |
| Demurrage risk after 5 days | Buyer | Vendor |
| Import clearance complexity | High (HS 841869) | Vendor |
| Total landed cost range | $220k–$260k | $235k–$275k |
| Cash-flow impact (days payable) | +30 days | –15 days |
| Recommended when port throughput <75 % of design | Yes | No |
Contract Risk Controls: From Warranty to Force Majeure
Insert a performance bank guarantee of 10 % valid until final commissioning plus 12 months. Define “Availability” as ≥98 % measured via IoT gateway; each 1 % shortfall triggers 2 % invoice rebate. Cap consequential damages at 100 % of contract value—mirrors typical dairy revenue loss for 48-h outage. Assign currency risk: if EUR/USD swings >5 % between PO date and shipment, adjust by 50 % of delta using ECB fixing. Include pandemic clause: 90-day suspension with option to cancel if travel restrictions prevent commissioning for >60 days.
Final Commissioning: Verify Integration, Release Retention
Commissioning is complete only when milk entering at 35 °C exits at ≤4 °C for three consecutive 8-hour cycles, power draw stays within 5 % of FAT value, and remote telemetry feeds SCADA with ≤2 % packet loss. Withhold 10 % retention until 30-day reliability run; release half if MTBF >720 h. Document digital twin serial number in asset registry; links to predictive-maintenance AI reduce unplanned downtime 18–22 % according to 2024 dairy co-op data.
⚡ Rapid ROI Estimator
Estimate your payback period based on labor savings.
Estimated Payback: —