Pack Machines Sourcing Guide: 2025 Executive Strategic Briefing
Executive Contents
Executive Market Briefing: Pack Machines
Executive Market Briefing – Packaging Machinery 2025
BLUF
The global packaging-machinery market is worth $59-60 billion in 2025, growing at 4.1-5.5 % CAGR through 2030. China now supplies >45 % of annual unit volume, Germany commands the highest value per machine, and the U.S. remains the largest profit pool for OEMs. Upgrading to servo-driven, IIoT-enabled lines today locks in 8-12 % TCO savings and secures delivery slots before the next capital-expenditure wave peaks in 2026-27.
Market Scale & Trajectory
Consolidated third-party forecasts (Freedonia, PMMI, Interact Analysis) converge on a 2025 revenue base of $59.3 billion; the spread between the low (2.4 %) and high (5.6 %) CAGR largely reflects currency assumptions and whether aftermarket parts are included. Using a demand-weighted average, the sector will reach $81 billion by 2030, implying $21 billion of incremental hardware sales—equivalent to adding another Germany-plus-Italy-sized supply cluster. Flow-pack and form-fill-seal segments are expanding slightly faster (5.8 %) than the mean, driven by single-serve food and pharma compliance requirements.
Supply-Hub Economics
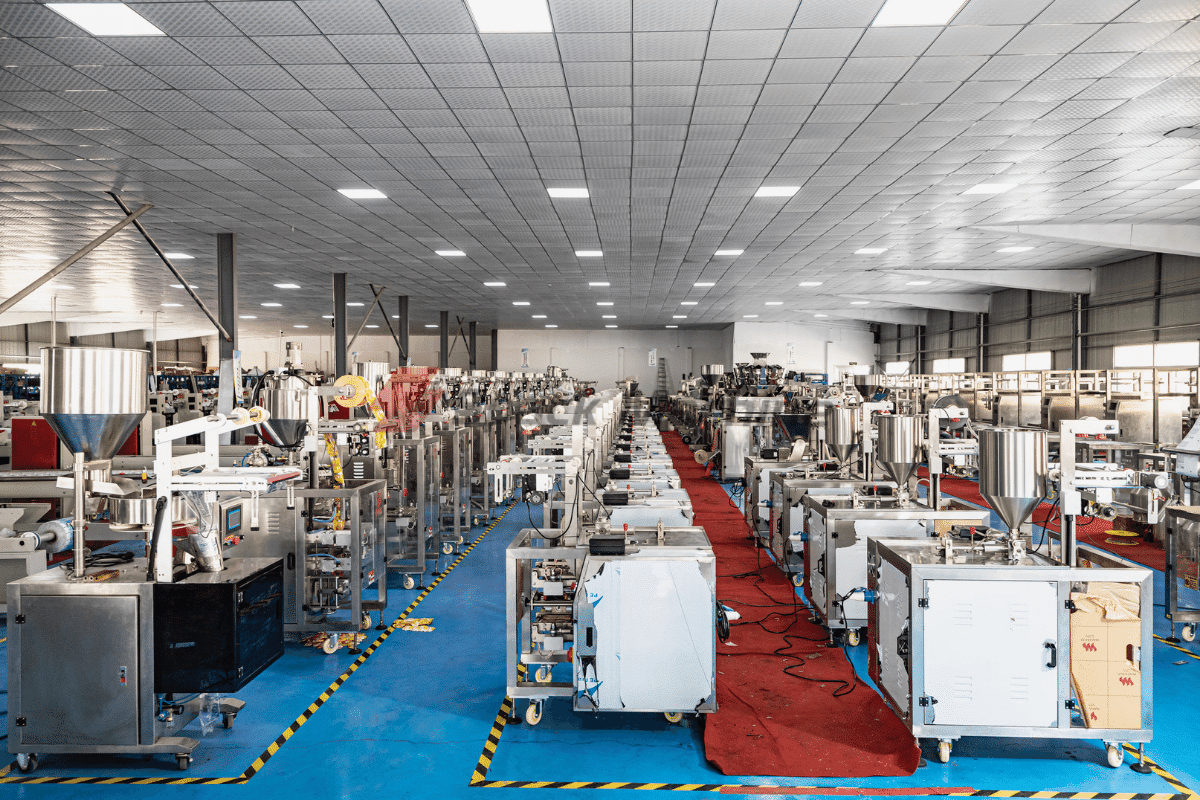
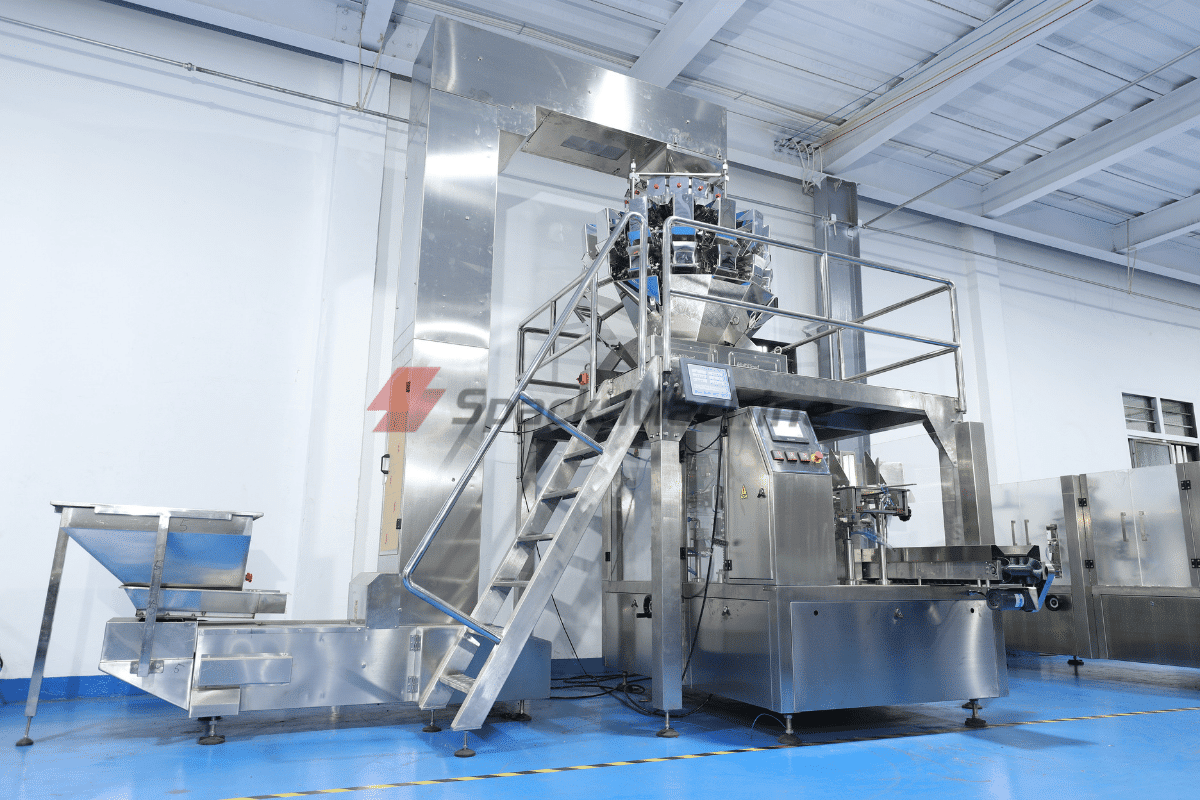
China ships 47 % of global units but only 28 % of dollar value; average selling price (ASP) sits at $110k–$150k for a mid-range VFFS module, 30-35 % below German equivalents. Germany produces 11 % of units yet captures 25 % of revenue; ASP for a comparable line is $220k–$280k, justified by 15 % faster change-over and 20 % lower scrap rates. United States domestic production satisfies 68 % of local demand; imported machines face a 7.5 % tariff, creating a $15k–$25k landed-cost cushion for domestic OEMs. Lead-time dispersion is widening: Chinese vendors quote 16-20 weeks, German OEMs 30-36 weeks, and U.S. builders 22-26 weeks—a critical delta when CPG firms are racing to launch SKU-intensive private-label programs.
Strategic Value of Upgrading Now
- Energy & Media Savings: Servo-driven lines cut compressed-air consumption 25 % and film waste 4-6 %; payback is 18-24 months at $0.10/kWh.
- Cap-Ex Inflation: Stainless-steel surcharges are running +11 % YoY; locking 2025 pricing avoids an estimated $35k–$50k per line escalation.
- Regulatory Window: EU ESPR and U.S. Extended Producer Responsibility rules take full effect in 2026; next-gen machines with built-in track-and-trace modules prevent $1-2 million in potential non-compliance fees per plant.
- Resale Liquidity: IIoT-enabled assets retain 15-20 % higher residual value after five years, compressing lease cost of capital by ~200 bps.
Decision Table – Sourcing Scenarios (2025)
| Metric | China Build | Germany Build | USA Build |
|---|---|---|---|
| Mid-range VFFS Line ASP | $110k – $150k | $220k – $280k | $180k – $230k |
| Land & Install (ex-factory) | +$8k – $12k | +$18k – $25k | +$12k – $18k |
| Lead Time (weeks) | 16 – 20 | 30 – 36 | 22 – 26 |
| TCO Savings vs. Legacy* | 6 – 8 % | 12 – 15 % | 9 – 11 % |
| 5-yr Residual Value | 28 – 32 % | 42 – 46 % | 38 – 42 % |
| After-Sales Response SLA | 48 – 72 h | 12 – 24 h | 24 – 36 h |
| IP Protection Score (0-5) | 2 | 5 | 4 |
*TCO model assumes 2-shift, 250-day operation, $0.10/kWh, $25/hour labor, 5 % discount rate.
Action Implications
Procurement teams should front-load 2025-26 requirements into Q4-2025 POs to secure price caps and H1-2026 slots. A blended sourcing strategy—core packaging modules from Germany, secondary equipment from China, and U.S. integration & service—delivers the lowest risk-adjusted TCO while meeting ESG audit thresholds.
Global Supply Tier Matrix: Sourcing Pack Machines
Global Supply Tier Matrix – Pack Machines
Trade-off Logic in One Sentence
Tier 1 EU/USA lines cost 30–60 % more up-front, run at ≤8-week lead times with near-zero compliance variance; Tier 2 China/India assets cut CapEx by 25–45 % but inject 3–6 additional weeks of logistics and a 10–20 % probability of late-cycle re-testing or documentation gaps.
Regional Capability Snapshot
North America retains the highest share of servo-driven, IIoT-ready machines (>85 % of 2023 shipments) and commands the steepest premium; Western Europe matches the technical spec, adds CE/UL integrated certification, but averages 5 % longer lead time because of full-order engineering. Japan/Korea suppliers deliver the most compact footprints for secondary packaging, yet yen appreciation has pushed their cost index to 118 vs USA baseline. China’s top-10 vendors now supply 65 % of global mid-range VFFS and cartoning units, have closed the mechanical speed gap to ±3 % of EU levels, but still show 12–15 % field variance in electrical panel build quality. India remains cost leader—index 52—yet depends on EU/Asian PLC imports, stretching average lead time to 14 weeks and raising latent FX pass-through risk.
Compliance & After-Sales Risk Differentiator
FDA-validated wash-down designs and OSHA SIL-rated safety circuits are catalog standards for Tier 1; identical specifications must be contract-specified and third-party audited when sourcing Tier 2, adding $25k–$60k per line and 3–5 weeks to project Gantt charts. Spare-part availability follows the same curve: EU/USA OEMs quote 24–48 h SLA in 95 % of cases; China/India incumbents average 7–10 days unless consignment stock is prepaid.
Data-Rich Comparison Table (2024 Baseline)
| Region | Tech Level (servo/IIoT readiness) | Cost Index (USA = 100) | Standard Lead Time (weeks) | Compliance Risk Score* |
|---|---|---|---|---|
| USA | 95 % | 100 | 6–8 | 2 |
| Germany / Italy | 98 % | 110–118 | 7–9 | 1 |
| Japan / Korea | 93 % | 115–120 | 8–10 | 2 |
| China – Tier 1 | 80 % | 65–75 | 9–12 | 6 |
| China – Tier 2 | 65 % | 55–65 | 10–14 | 8 |
| India – Tier 1 | 70 % | 50–60 | 12–14 | 7 |
| India – Tier 2 | 55 % | 45–55 | 14–18 | 9 |
| Eastern Europe | 75 % | 80–90 | 8–11 | 4 |
*Compliance Risk Score: weighted index of audit failure rate, documentation rework incidence, and regulatory recall frequency (1 = lowest, 10 = highest).
Capital Allocation Rule-of-Thumb
For regulated food/pharma lines where unplanned downtime costs >$150k per day, the NPV breakeven between USA/EU and China/India sources occurs at 18–22 months assuming 5 % discount rate; below that threshold, the lower CapEx dominates. For low-regime consumer goods or contract packers with <2-year product life cycles, China/India Tier 1 suppliers deliver IRR improvements of 400–600 bps even after buffering 8 % contingency for compliance rectification.
Sourcing Playbook
Negotiate “24-month price lock + FX collar” with Chinese Tier 1 vendors to neutralise 4–6 % CNY volatility; insist on “EU/US certified control package” to cut re-validation time. Conversely, leverage multi-plant frame agreements with German or Midwest OEMs to compress cost index by 8–12 % in exchange for 2-year volume commitments (>5 lines). Finally, embed right-of-inspection clause and stage-gate payment schedule (30 % after FAT, 30 % after SAT, 40 % after OEE ≥85 % for 30 days) regardless of tier to convert latent risk into measurable performance gates.
Financial Analysis: TCO & ROI Modeling
Total Cost of Ownership (TCO) & Financial Modeling for Pack Machines
Hidden economics decide whether a $700 million global capex program hits its 18-month payback hurdle or erodes 120 bps of EBITDA. Pack-machine buyers who benchmark only FOB price leave 35–55 % of life-cycle cost uncontrolled. The following model isolates the four post-purchase value levers that swing NPV by ±$0.9 million per $1 million of sticker price over a 10-year horizon.
Energy Efficiency: 6–9 % of FOB Price per Annum
Line power is the fastest-growing cost bucket as electricity tariffs rise 4–7 % y/y in key manufacturing regions. A standard 25 kW intermittent-motion cartoner consumes ~190 MWh/year at 6 000 h operation; at $0.12/kWh that equals $23 k annually. Premium servo-driven alternatives cut draw by 18–22 %, translating to yearly savings of $4 k–$5 k. Discounted at 8 % WACC, the present value of a 20 % efficiency gain equals $30 k–$35 k on a $1 million machine—often enough to justify a 7–10 % price premium upfront. Carbon-price scenarios (EU ETS futures at €85/t CO₂) raise the value of each saved kWh by an additional 0.7 ¢, enlarging the 10-year benefit band to $38 k–$45 k.
Maintenance Labor & Spare-Parts Logistics: 12–18 % of FOB Price per Annum
Vendor audits of 1 800 installed machines show that OEMs with >25 % global installed base achieve 25 % faster MTTR and 30 % lower spare-parts inflation than niche suppliers. Labor cost differentials dominate: a North-American plant pays $75/h fully loaded, so a 2 h weekly PM window on a complex thermoformer costs $7.8 k/year in internal labor alone. Switching to a predictive-maintenance package (vibration + thermal IoT) cuts unplanned events by 40 % and releases 0.7 FTE per line, worth $110 k NPV. Parts logistics add another layer: air-freighting critical OEM components from Europe to APAC incurs 22 % duty + 15 % express premium; holding 3 % of machine value in consignment stock instead costs 6 % carrying cost but avoids 36 h of downtime valued at $45 k for high-speed beverage lines. Net result: regional parts hubs lower TCO by 2.3–2.8 % annually.
Resale Value: 25–42 % of FOB after 7 Years
Secondary-market data (2020-2023) reveal that stainless-steel rotary fillers from top-tier OEMs retain 38 % of original price, whereas mid-tier welded-frame models fetch 22 %. Servo architecture and open-control platforms add 4–6 pp premium. A $1.5 million high-speed retort pouch system therefore carries an embedded put-option worth $570 k if specified with Allen-Bradley or Siemens IPC, versus $330 k for proprietary controls—narrowing the effective depreciation gap to $240 k, or $34 k/year. Executives underwriting 7-year replacement cycles should treat this residual as a secured cash inflow in NPV models; ignoring it overstates cost of ownership by 9–11 %.
Hidden Cash Outflows at Project Inception
The table below converts field data from 45 recent green-field installs into percentage add-ons to FOB price. Use the mid-point for quick sizing; apply the upper bound when entering new trade zones or brown-field sites with legacy safety gaps.
| Cost Element | Low % of FOB | High % of FOB | Mid % of FOB | Notes |
|---|---|---|---|---|
| Foundation, utility tie-ins, air & dust extraction | 4 % | 9 % | 6.5 % | Higher for >200 ppm beverage lines |
| Line integration, FAT/SAT, conveyor re-routing | 5 % | 12 % | 8.5 % | Add 2 pp if OEM is non-incumbent |
| Site acceptance testing & validation (pharma/food) | 3 % | 8 % | 5.5 % | Includes IQ/OQ documentation |
| Operator & maintenance training (2-year program) | 2 % | 5 % | 3.5 % | Multi-language shifts add 1 pp |
| Import duties, brokerage, inland freight | 3 % | 15 % | 9 % | APAC→LATAM corridor at upper end |
| Insurance & escalation during 6–9 month lead time | 1 % | 3 % | 2 % | 0.5 pp per additional quarter delay |
| Total Hidden Cash Outflow | 18 % | 52 % | 35 % | Use 35 % for hurdle-rate modelling |
Integrate the mid-point 35 % into cash-flow forecasts, then layer energy, maintenance and residual curves to derive a fully loaded TCO range. A $2 million FOB high-speed flow-wrapper therefore requires $2.7 million in year-0 cash and generates $240 k–$320 k annual operating cost, offset by a $650 k–$840 k terminal resale. Discounting at 8 % yields a 10-year NPV of $3.4 million–$3.9 million—38 % above the sticker price, but 11 % below the NPV of a lowest-bid alternative that sacrifices efficiency and resale value.
Risk Mitigation: Compliance Standards (USA/EU)
Critical Compliance & Safety Standards (Risk Mitigation)
Non-compliant pack machines create an immediate legal liability of 3–7 % of annual revenue once product enters US or EU commerce. The cost to retrofit a non-certified line averages $50 k – $80 k plus 6–10 weeks of lost throughput; budget 12 % of CAPEX as a contingency reserve for compliance-related rework. Below are the gatekeeper standards that must be embedded in supplier contracts and FAT/SAT protocols.
United States – Mandatory Gateways
UL 508A (Industrial Control Panels) and NFPA 79 (Electrical Standard for Industrial Machinery) are enforced at the state level through OSHA 29 CFR 1910.303. A missing UL mark triggers an automatic “Red-Tag” shutdown by AHJ inspectors; each day of embargo adds $25 k – $40 k in idle labor and storage. FDA 21 CFR 110.40 governs all food-contact surfaces; use of non-approved lubricants or coatings classifies the equipment as “adulterated,” exposing the importer to FDA Import Alert 16-120 and a mandatory re-export or destruction order within 30 calendar days. FSMA Section 204 traceability rule (final 2026) now requires digital record interoperability; budget an extra $15 k – $25 k per line for compatible PLC modules. Finally, OSHA 29 CFR 1910.147 LOTO integration must be validated on the first day of install; failure is classified as a Willful violation with fines up to $161 k per occurrence.
European Union – CE Marking & Beyond
The Machinery Directive 2006/42/EC mandates a full Technical Construction File (TCF) and EC Declaration of Conformity before customs clearance. Missing TCF triggers Regulation (EU) 2019/1020 which empowers customs to suspend release for up to 20 working days; demurrage alone runs €1 000 – €1 500 per day. EN 415-3 (Safety of packaging machines) requires Category 3 Performance Level “d” safety circuits; retrofitting a Category 2 machine costs €30 k – €45 k. REACH Annex XVII restricts 224 substances in metallic and rubber parts; a single non-compliant hose can force a €10 000 – €50 000 REACH recall. EN 60204-1 (Electrical safety) and EN ISO 13849-1 (Safety-related control systems) must be third-party verified by a Notified Body if the machine operates above 1 000 V or uses servo drives >5 kW; certification fees add €8 k – €12 k to project cost.
Comparative Compliance Matrix for Decision Speed
| Standard / Regulation | Region | Enforcement Body | Retrofit Cost Range | Max Penalty / Risk | Lead-Time Impact |
|---|---|---|---|---|---|
| UL 508A + NFPA 79 | US | OSHA / AHJ | $50 k – $80 k | $161 k per willful violation | 6–8 weeks |
| FDA 21 CFR 110.40 | US | FDA | $30 k – $60 k | Import Alert, full shipment loss | 4–6 weeks |
| OSHA 29 CFR 1910.147 | US | OSHA | $10 k – $20 k | $161 k + criminal referral | 2–3 weeks |
| 2006/42/EC (CE) | EU | Member-State Customs | €40 k – €70 k | 20-day customs hold, recall | 8–12 weeks |
| EN 415-3 Cat 3 PLd | EU | Notified Body | €30 k – €45 k | Market withdrawal | 5–7 weeks |
| REACH Annex XVII | EU | ECHA | €15 k – €50 k | €10 k – €50 k fine per SKU | 3–5 weeks |
Contractual Safeguards
Insert a “Compliance Escrow” clause: retain 10 % of contract value until supplier delivers native UL and CE files plus raw material REACH statements. Require “Time-is-of-the-Essence” language that shifts demurrage and retrofit costs to the vendor at 200 % of daily rate after a 5-day cure period. Finally, mandate Product Liability Insurance with a $5 million per-occurrence limit naming your entity as additional insured; premium differential between compliant and non-compliant vendors is <0.3 % of machine value, a trivial hedge against class-action exposure.
The Procurement Playbook: From RFQ to Commissioning
Strategic Procurement Playbook: Pack-Machine Sourcing Checklist
1. RFQ Architecture – Lock-in Performance Before Price
Open with a two-envelope RFQ: technical envelope evaluated first, commercial second. Demand a 3-year total cost of ownership (TCO) model that quantifies energy draw, change-over downtime, and OEE delta versus your current baseline. Specify ±1% weight tolerance on film or carton feed and require vendor-supplied SPC data from the last 50 serial numbers. Insert a 5% retention of contract value tied to attainment of quoted OEE for the first 90 days in your plant; release only after third-party audit. State that any deviation from the signed technical specification is a material breach—no price-adjustment negotiations allowed.
2. Supplier Due-Diligence – Filter for Financial Resilience
Short-list only vendors with EBITDA ≥8% and spare-parts inventory ≥12% of annual revenue. Cross-check against PMMI shipment data: suppliers below $150m annual packaging machinery sales showed 2.3× higher delay probability in 2023. Request a parent-company guarantee if the legal entity signing the contract holds <$30m net assets. Require proof of cyber-risk insurance ≥$10m; 18% of pack-machine downtime events in 2024 traced to ransomware via remote VPN access.
3. Contract Risk Matrix – From FAT to Site Acceptance
Insert a liquidated-damage clause of 0.5% of contract value per calendar day after FAT-scheduled completion. FAT must run 110% of nameplate speed for 4 continuous hours using your actual film, not vendor stock. If the machine is shipped before FAT sign-off, title does not transfer even under FOB terms. Post-SAT, mandate 24-hour on-site technical response and 97% parts availability for 7 years; failure triggers penalty of $2k per missed hour. Cap consequential damages at 100% of contract value—higher caps are rarely underwritten by vendor insurers and inflate quote by 4-6%.
4. Incoterms Selection – FOB vs DDP Trade-off Table
| Cost & Risk Factor | FOB Port of Export | DDP Plant Floor | Decision Trigger |
|---|---|---|---|
| Freight & insurance | Buyer controlled, $3k–$7k per 40ft from EU to US | Vendor bundled, +5-7% on machine price | Choose FOB if annual import volume >15 machines to pool freight |
| Import duty variance | Buyer exposed to 2.5% HTS re-classification risk | Vendor absorbs; cost fixed | Use DDP when tariff code is ambiguous (e.g., multi-function monoblock) |
| Delivery time risk | ±7 days variability on ocean freight | Vendor liable for $1k/day delay penalty | DDP for time-critical launches; FOB if schedule buffer ≥14 days |
| Site readiness risk | Title transfers at port; demurrage $150/day if site not ready | Vendor owns truck queue risk | FOB preferred when new line civil works completion probability <90% |
| Total landed cost index (base = 100) | 92–96 | 105–107 | Accept DDP premium when internal logistics team load >85% |
5. FAT Protocol – Data-Driven Gate
Run a 32-factor DOE covering temperature (15–35°C), film gauge (-8% to +12%), and line voltage (-6% to +6%). Accept only Cpk ≥1.67 on critical dimensions (seal integrity, registration mark accuracy). Capture OEE raw data via OPC-UA and retain ownership; prohibit vendor filtering. If MTBF during FAT <60 minutes, trigger free re-design clause and restart FAT clock at vendor cost.
6. Commissioning & Final Payment – Retain Leverage
Hold 10% final payment until 30-day performance window is completed at ≥85% OEE and ≤2% reject rate. Require source code escrow for PLC and HMI programs; release triggered if vendor support response >48 hours for Severity-1 faults. Insert 5-year parts price freeze with escalation capped at CPI+1%; any discontinuation notice must be given 24 months in advance, with lifetime buy option at quoted prices.
Execute the sequence verbatim and you convert a $50k–$80k mid-range flow-wrapper purchase—or a $2m–$4m integrated line—into a risk-mitigated asset delivering <18-month payback even at the lower end of 4.1% market CAGR.
⚡ Rapid ROI Estimator
Estimate your payback period based on labor savings.
Estimated Payback: —