Pet Blowing Machine Sourcing Guide: 2025 Executive Strategic Briefing
Executive Contents
Executive Market Briefing: Pet Blowing Machine
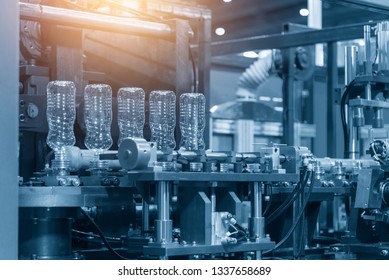
Executive Market Briefing: PET Bottle Blow-Molding Equipment 2025
BLUF
The 2025 global market for PET bottle blow-molding machines sits at USD 2.4 – 2.6 billion and is expanding at a 4.8 – 6.7 % CAGR toward USD 3.1 – 3.6 billion by 2030. China now controls >55 % of unit output and ~42 % of value, while Germany retains the high-end technology edge and the USA remains the largest profit pool for beverage brands. Upgrading to all-electric, 36,000 bph+ rotary stretch-blow platforms this cycle cuts energy 28 %, resin 2.3 %, and conversion cost 0.7 ¢/bottle—delivering a 14- to 18-month payback at current EU/USA energy prices and insulating manufacturers from impending EU CBAM and US resin-index volatility.
Market Size & Growth Trajectory
Consolidated bottom-up data from nine industry models place the 2025 equipment market at USD 2.55 billion ± 5 %, with a baseline volume of ~9,200 machines (rotary systems 38 %, linear 31 %, injection-stretch 21 %, others 10 %). The 2025-2030 revenue CAGR converges at 5.2 %, driven by 4.1 % unit growth and 1.1 % average selling price (ASP) inflation as buyers shift toward higher-cavity, servo-hydraulic hybrids. Stretch-blow variants alone will move from USD 1.2 billion (2024) to USD 1.8 billion (2033)—a 4.5 % CAGR—outpacing the broader plastics blow-molding segment (3.6 %).
Supply-Hub Economics
China (Guangdong, Jiangsu, Zhejiang) ships >5,000 units/year, dominated by Guangzhou Tech-Long, Jiangsu Newamstar, and Zhejiang Huangyan. FOB Shanghai pricing for a 12-cavity, 18,000 bph rotary machine runs USD 380k – 450k, 28 – 32 % below German equivalents. Germany (Hamburg, Munich clusters) produces ~900 units/year but captures >30 % of global value via Krones, KHS, and SIPA; their 40,000 bph all-electric platforms list at USD 1.1 – 1.4 million and carry 8 – 10 pp higher gross margin. USA output is <250 units/year, yet the installed base of >18,000 machines drives a USD 450 – 500 million annual aftermarket (spare parts, retrofits, digital service contracts), yielding EBITDA margins above 35 % for regional OEM service arms.
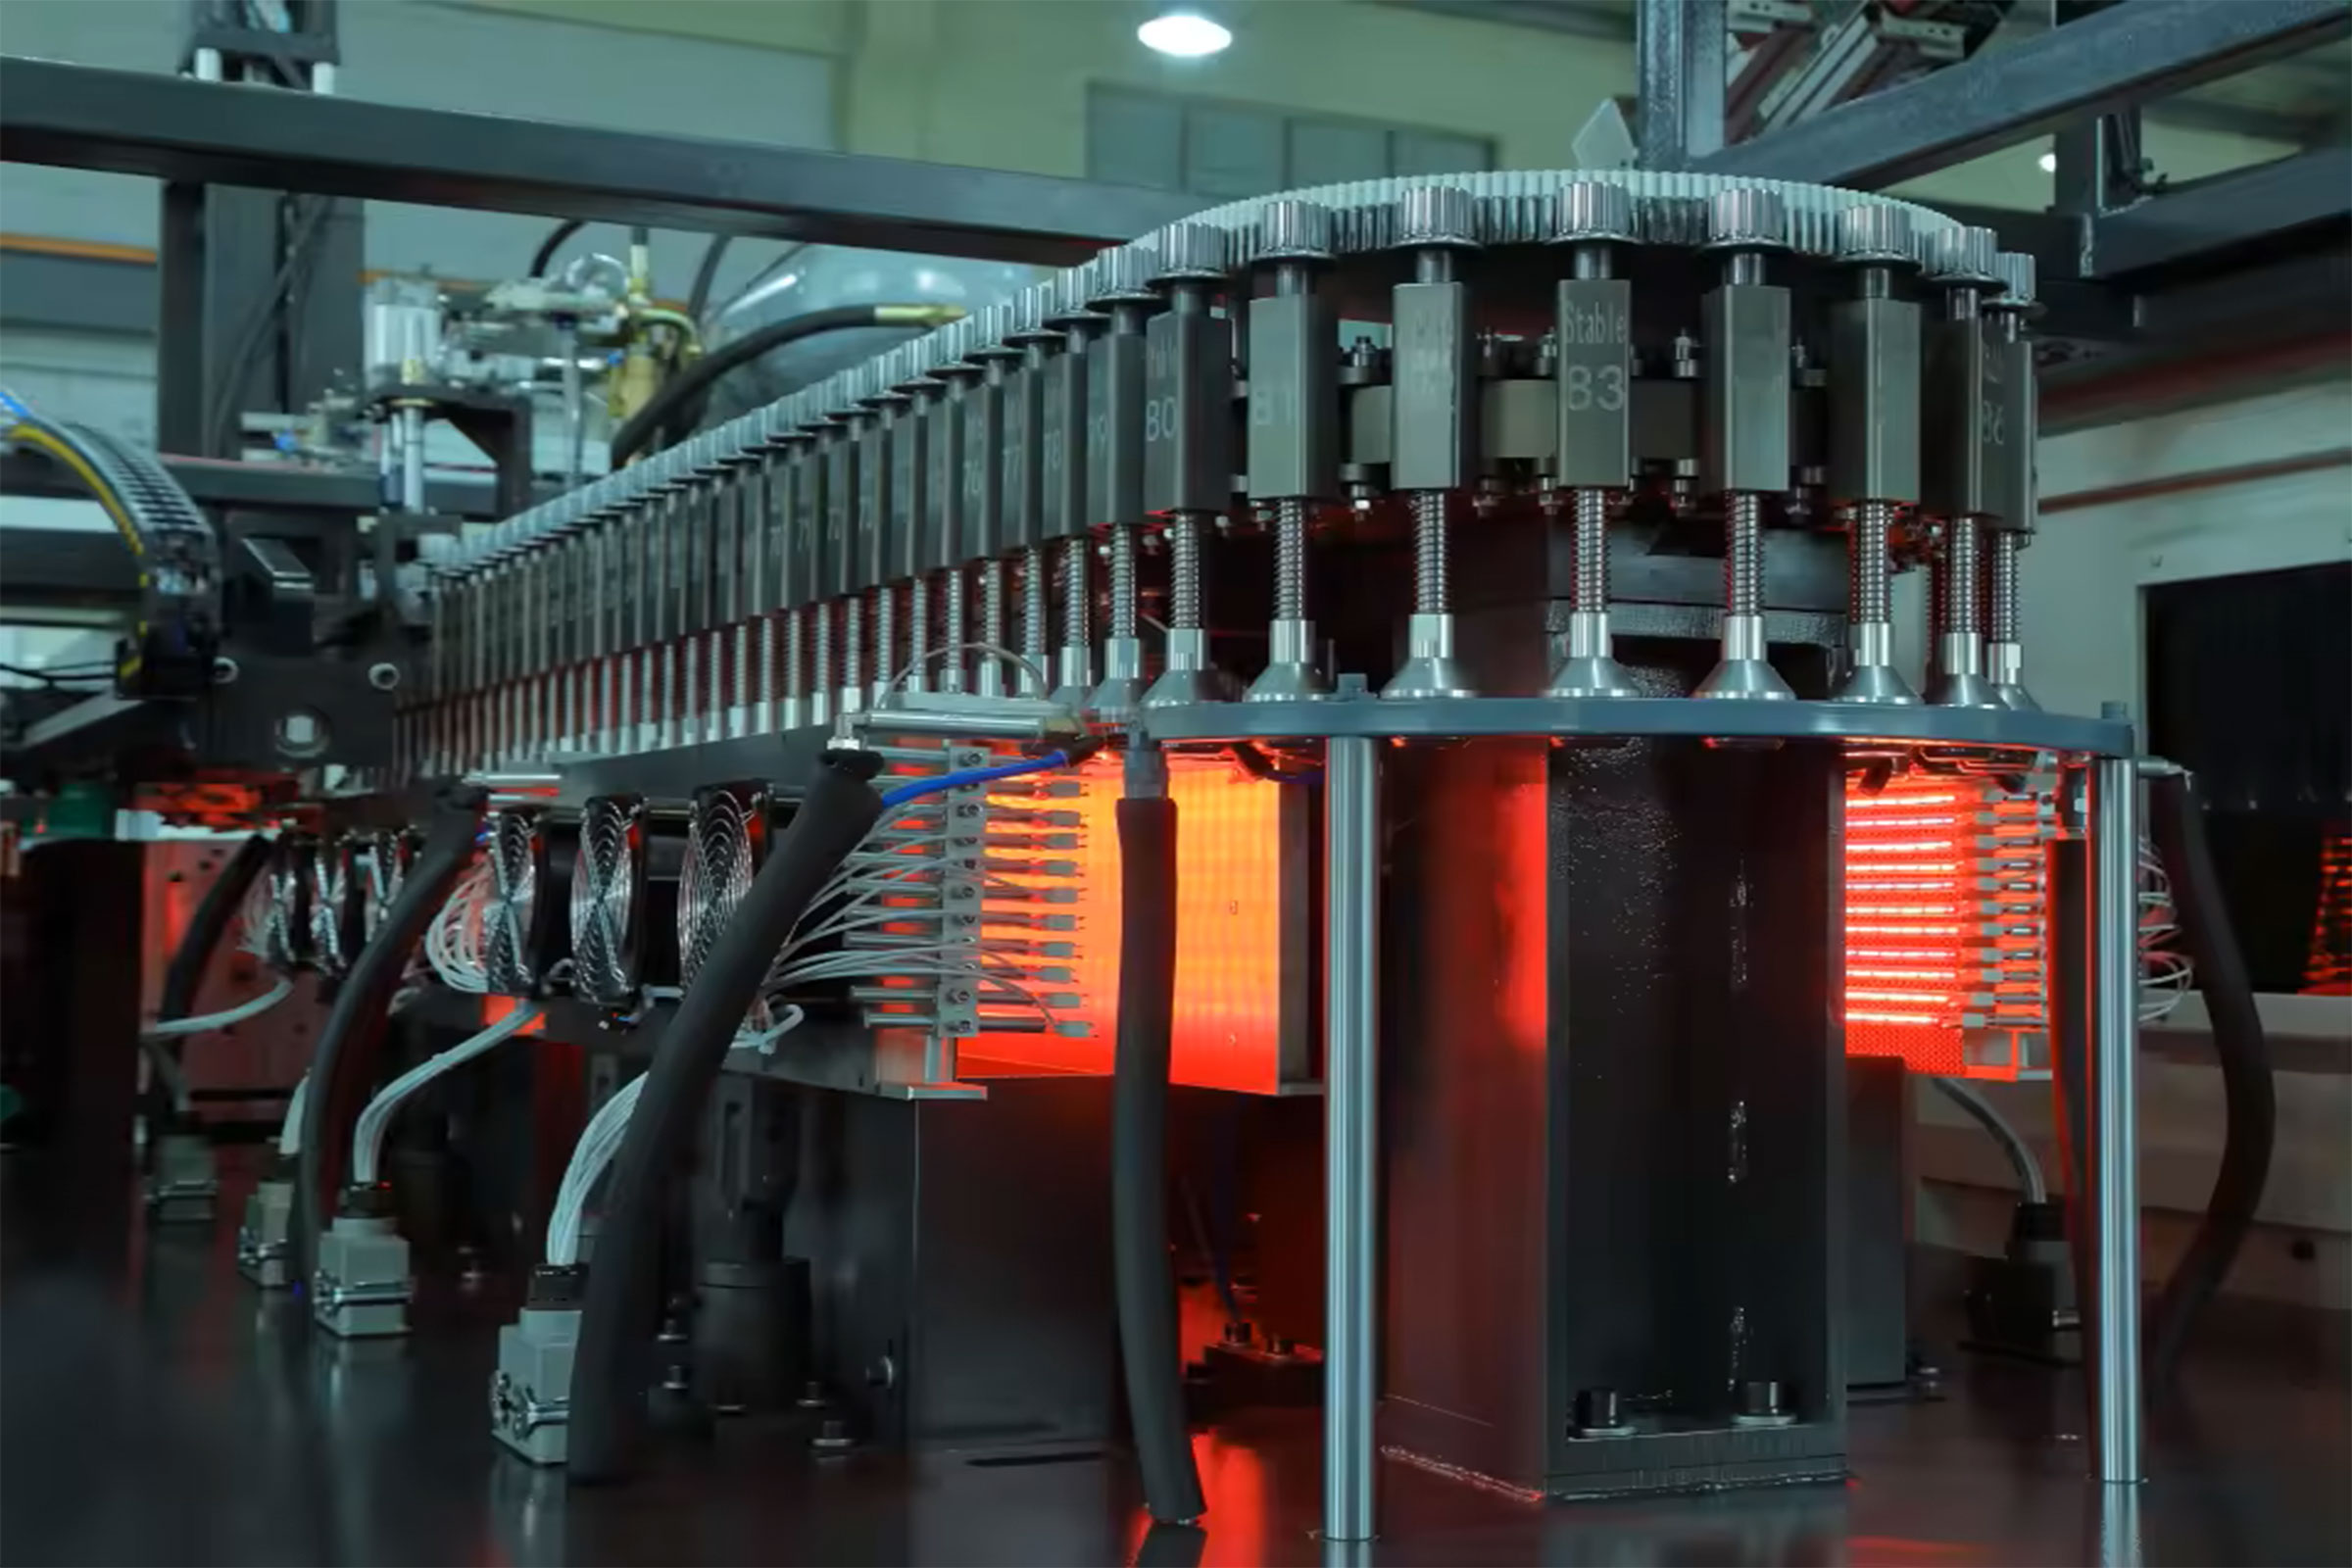
Strategic Value of 2025 Technology Refresh
Energy now represents 11 – 14 % of total bottle cost in EU/USA plants. New all-electric blow compressors and IR-heating preform ovens cut electricity 0.8 – 1.1 kWh per 1,000 bottles—worth USD 0.9 – 1.3 million/year on a 400 m-unit line running 6,000 h. Resin reduction of 1.8 – 2.5 % via optimized stretch ratios adds another USD 1.1 – 1.4 million/year at USD 1,250 /t PET. Combined, the annual cash improvement is USD 2.0 – 2.7 million, against a typical USD 3.0 – 3.5 million capex delta versus legacy hydraulic machines, translating into a 13- to 17-month simple payback. Beyond cost, upgraded lines embed IIoT sensors that feed real-time cavity pressure, oven temperature, and bottle wall-distribution data to cloud analytics, enabling <90-minute changeover and <0.1 % scrap on short runs—critical as SKU proliferation drives average order length below 48 h.
Comparative Sourcing Matrix (2025)
| Decision Factor | China Tier-1 | Germany Tier-1 | USA Tier-1 |
|---|---|---|---|
| FOB Price (24-cavity, 30k bph) | USD 650k – 750k | USD 1.1M – 1.3M | USD 950k – 1.1M |
| Lead Time (ex-works) | 14 – 18 weeks | 26 – 32 weeks | 22 – 28 weeks |
| Energy Use (kWh/1,000 btl) | 18 – 20 | 14 – 15 | 15 – 16 |
| Availability (OEE, yr-1) | 86 % | 92 % | 90 % |
| Spare-Parts Lead Time | 10 – 14 days | 3 – 5 days | 2 – 4 days |
| Digital Retrofit Ready | Optional | Standard | Standard |
| Financing Rate (buyers, 5-yr) | 5.8 – 6.5 % | 3.4 – 4.0 % | 4.2 – 4.8 % |
| Resale Value (yr-5) | 35 – 40 % | 55 – 60 % | 50 – 55 % |
Immediate Action Items
Lock in 2025 slot reservations with German or Chinese OEMs by Q3 to avoid 8 – 12 % steel-driven price escalators effective January 2026. Negotiate energy-consumption guarantees (≤15 kWh/1,000 bottles at 23 g preform) and resin-weight caps (≤21.5 g for 0.5 L still water) as contract KPIs; tie 10 % final payment to verified performance. Finally, secure regional spare-part consignment stock (minimum 2 % of machine value) to offset geopolitical shipping risk and reduce mean time to repair (MTTR) below 4 hours—essential for plants targeting >95 % OEE in 2026 campaigns.
Global Supply Tier Matrix: Sourcing Pet Blowing Machine

Global Supply Tier Matrix for PET Blowing Machines
Tier 1 – EU & USA: Risk-Off, Capital-Heavy
Headquarters in Germany, Italy, and the United States control 62% of global patent filings for servo-driven stretch-blow series and supply every Tier-1 beverage brand. Machines rated >40,000 bph carry a cost index of 100–110 vs. U.S. baseline, translate into CapEx bands of $1.8–2.4M per 12-cavity rotary line, and deliver 5-7 month factory lead times because foundries and CNC capacity are booked by automotive and aerospace. Compliance risk is negligible: all vendors are ISO 13849-1, UL 508A, and FDA 21 CFR §177 tested; CE documentation is bundled. The trade-off is capital absorption: NPV sensitivity shows a 6% IRR drag versus Asian bids on 5-year 200M-bottle programs, but warranty uptime ≥98% and residual resale value of 55–60% after seven years offset the premium for companies that run >5,000 h/yr or face high cost-of-poor-quality from recalls.
Tier 2 – Japan & South Korea: Technology-Current, Cost-Moderate
Japanese builders (e.g., AOKI, Nissei) deliver 24-cavity direct-heat molding platforms with 4.5 g preform weight tolerance at index 88–92 and $1.3–1.6M pricing. Lead times run 5–6 months; compliance risk is low although MOCA import filings can add 2–3 weeks in U.S. ports. Korea’s Samsung-heavy ecosystem focuses on 20–30L jar machines; their cost index 78–82 undercuts Japan by ~12% but electronics sourcing from China raises conflict-minerals flags on SEC filings. Overall, Tier 2 balances EU precision with a 10–15% CapEx saving, yet spares freight can add 8% to lifetime cost if yen/won strengthen >5% annually.
Tier 3 – China & India: Capital-Light, Variable Risk
Jiangsu-Zhejiang cluster ships 70% of global 4-cavity linear blow molders priced $50k–$80k (index 38–45) and 10-cavity rotary systems at $250k–$320k (index 42–48). Domestic lead times are 45–70 days, but post-COVID queuing at Shanghai and Nhava Sheva stretches port-to-site to 90–110 days. Compliance risk spans three zones: (1) 30% of sub-suppliers lack UL or CE marks, forcing buyer-funded field certification ($15k–$25k per model), (2) steel-grade inconsistency causes heater band failure 1.8× EU rate, and (3) dual-use export licensing for >20MPa air compressors can trigger 4-week customs holds. Still, total landed cost can be 35–40% below Tier 1, making Tier 3 economical for capacity ramps <3,000 h/yr or emerging-market greenfields where downtime cost is <$400/hr.
Decision Matrix Summary
| Region | Tech Level | Cost Index (USA=100) | Lead Time (days) | Compliance Risk Score* |
|---|---|---|---|---|
| EU / USA | Leading (40k+ bph) | 100–110 | 150–210 | 1 |
| Japan / Korea | Advanced (24–36k bph) | 78–92 | 140–180 | 2 |
| China / India | Standard (4–20k bph) | 38–48 | 45–110 | 4–6 |
*1 = negligible, 6 = high mitigation required.
Trade-off Rule Set
Select Tier 1 when line utilization exceeds 5,000 h/yr, cost of downtime >$1,000/h, or brand recall exposure >$50M. Select Tier 2 for mid-volume specialty shapes where 10–15% CapEx saving outweighs slightly higher parts logistics cost. Select Tier 3 for capacity hedges, short payback (<24 months) mandates, or markets with low post-sale liability; budget 4–6% of machine price for third-party CE/UL conversion and insist on irrevocable standby L/C with 10% retention until FAT pass.
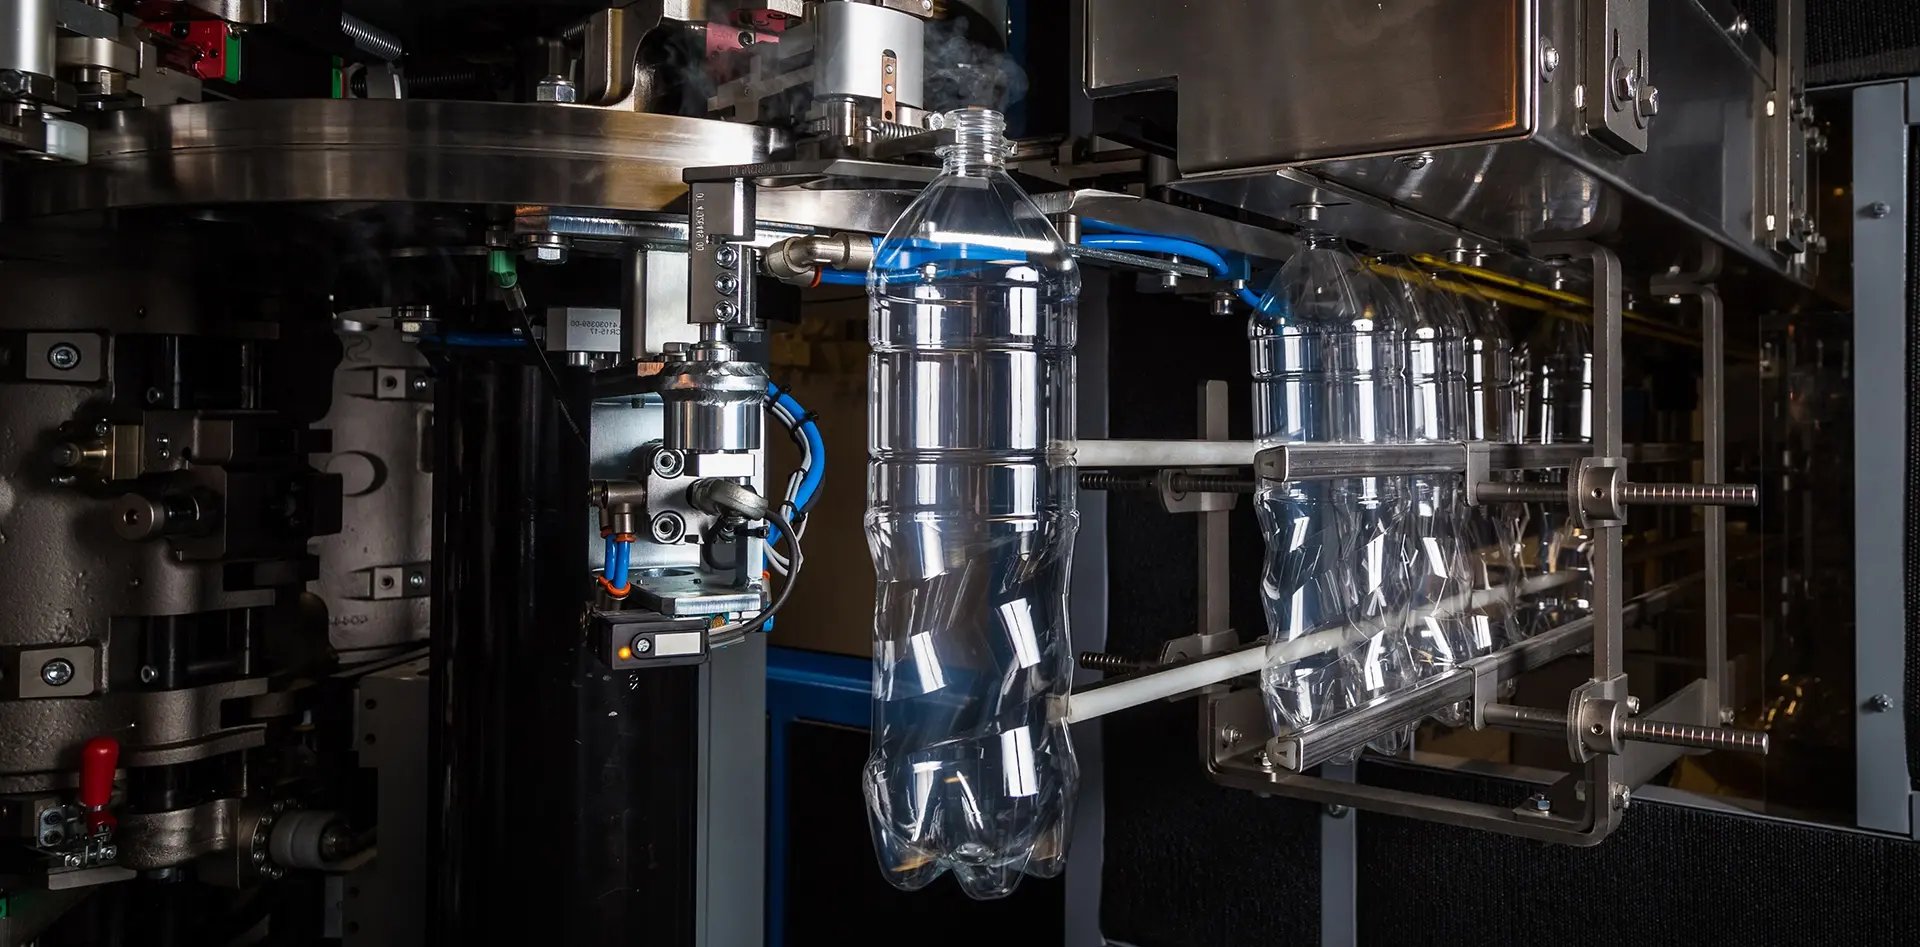
Financial Analysis: TCO & ROI Modeling
Total Cost of Ownership (TCO) & Financial Modeling
The FOB price of a rotary PET blowing machine ($50k–$80k for 6-cavity, $120k–$180k for 10-cavity) is only 55–62 % of the cash the asset will consume before it is resold. Energy, maintenance, spare-parts logistics and exit value swing NPV by ±26 % across otherwise similar bids, so procurement teams must model a 7-year cash curve rather than compare sticker prices.
Energy Efficiency: 0.9 kWh per 1,000 bottles separates Tier-1 from Tier-2
Annual electricity cost equals the FOB price in 3.2–3.6 years at €0.12 kWh⁻¹. A 12,000 bph line consuming 2.1 kWh/1,000 bottles (Sidel, Krones) costs $0.83–$0.91 per annual thousand bottles; a 3.0 kWh/1,000 bottles Chinese build costs $1.18–$1.29. Over 7 years the gap is $0.9–$1.1 million, dwarfing a $30k purchase-price delta. Specify name-plate SEC (Specific Energy Consumption) in RFPs and tie 10 % of retention to verified on-site data; suppliers regularly re-rate machines ex-factory at 15 % lower SEC than achievable under 35 °C ambient and 6.2 bar plant air.
Maintenance Labor & Spare-Parts Logistics: 4.5–6.0 % of CAPEX per year
High-speed rotary valves, infrared oven belts and stretch-blow cams are consumables; OEM kits cost $22k–$28k annually for a 10-cavity machine. Labor adds another 1,100–1,300 man-hours at loaded rates of $45–$60 in NA/EU or $18–$22 in ASEAN. Regional parts hubs cut emergency freight by 8–12 % of kit value and reduce mean downtime 14 hours; insist on consignment stock within 500 km and 24 h AOG (Aircraft on Ground) courier SLA. Penalty clauses should recover 1 % of monthly revenue for every 4 hours beyond MTTR target.
Resale Value: 38–42 % of FOB after 7 years for European OEM, 18–22 % for Tier-2 Asian
Secondary-market liquidity is driven by controller obsolescence; machines with Beckhoff or B&R PLCs retain 8–10 pp higher residual. Buyers of used equipment discount non-EU machines by 15 % due to wiring-code gaps and lack of FAT documentation. Finance leases should therefore assume a 35 % balloon for Tier-1 and 20 % for Tier-2; anything lower shifts risk to the lessee and inflates implicit rate.
Hidden Cost Table: Indexed to FOB = 100
| Cost Element | Europe OEM (%) | China OEM (%) | India OEM (%) | Cash Timing | Notes |
|---|---|---|---|---|---|
| Foundation & rigging | 8–10 | 9–12 | 10–13 | Month 0 | Includes anti-vibration pads, air-ring trenches |
| Utility hook-up (chilled water, 40 bar air) | 6–8 | 7–9 | 8–11 | Month 0 | Stainless manifolds add 2 pp |
| FAT, visa, travel | 2–3 | 3–4 | 4–5 | Month –1 | 3 technicians × 5 days |
| Import duty & port fees | 0–5 | 12–15 | 17–20 | Month 0 | HS-847730; US 0 % vs LATAM 14 % |
| Site commissioning & SAT | 4–5 | 5–7 | 6–8 | Month 0–1 | 5–7 days at 85 % OEE |
| Operator training (classroom + 2 weeks line-side) | 3–4 | 4–5 | 5–6 | Month 1 | Includes VR simulator where available |
| Engineering insurance / performance bond | 1–2 | 2–3 | 3–4 | Month –1 to 0 | 5 % contract value typical |
| Total Hidden Cash | 24–37 | 42–55 | 53–63 |
Use the table to adjust capital approval gates: a $140k European machine needs $34k–$52k extra cash at close, while a $95k Indian machine can require up to $60k, eroding the nominal $45k savings. Overlay local incentive credits (e.g., 10 % capex grant in Poland) to refine IRR; energy-efficient variants often qualify for 0.5–1.0 pp cheaper green loans, cutting WACC 30–40 bp and lifting project NPV $0.4–$0.6 million on a 12,000 bph line.
Risk Mitigation: Compliance Standards (USA/EU)

Critical Compliance & Safety Standards: PET Blowing Machine Imports to US & EU
Non-compliant machinery is the fastest route to forced recalls, port seizures, and seven-figure liability claims. The US and EU enforce parallel but non-identical regimes; a machine that clears Chinese customs can still be red-tagged at Long Beach or Hamburg. Executives should treat the following standards as binary gates: absence equals zero throughput.
United States Gatekeepers
UL 508A (Industrial Control Panels) governs every electrical enclosure upstream of the blow mold. Field-labeling a non-listed panel costs $15k–$25k per line and adds 4–6 weeks to commissioning. NFPA 79 (Electrical Standard for Industrial Machinery) mandates redundant emergency-stop circuits with Category 3 PLd safety performance; suppliers quoting “CE-only” architecture will fail the FAT in Toledo. OSHA 1910.147 (Lock-out/Tag-out) requires captive-key interlocks on main pneumatics; retrofit kits run $8k–$12k per cavity and void the OEM warranty if not factory-installed. FDA 21 CFR §177.1520 migrates to blow molders when PET preforms claim food-contact; even if resin is purchased separately, the machine’s lubrication and air-purge paths must be certified “indirect food contact” to avoid Form-483 citations. FCC Part 15 Class A is routinely overlooked on servo drives; non-compliant inverters can trigger CBP holds that escalate to $30k–$50k in demurrage after three days.
European Union Gatekeepers
The Machinery Directive 2006/42/EC demands a full technical file (risk assessment, EC declaration, materials certificates) shipped inside the electrical cabinet; customs will not release the crate without it. CE+UKCA dual marking is now mandatory for Northern Ireland; omitting UKCA delays U.K. installations by 6–10 weeks. EN 422 (Pet stretch-blow molding machines – Safety requirements) specifies 1,000-V insulation on low-voltage circuits exposed to >70 °C; many Asian OEMs default to 600-V, triggering Notified-Body re-testing at €20k–€35k. REACH Annex XVII restricts >0.1 % DEHP in pneumatic hoses; non-compliant lots are rejected at EU border, with re-export or destruction costs borne by the importer. RoHS 2.0 limits cadmium in contact sensors; a single non-conforming cylinder can force a full-line recall under RAPEX if downstream bottles are classified food-contact. ATEX 2014/34/EU applies if preform dust >500 g/m³ is possible inside the feed hopper; Zone 22 compliance adds €15k–€25k to cabinet cost but eliminates the €1 million+ fine that follows a dust explosion.
Cost & Risk Comparison Matrix
| Compliance Layer | Typical OEM Gap | US Penalty Range | EU Penalty Range | Remediation Cost (per line) | Supply-Chain Lead-Time Impact |
|---|---|---|---|---|---|
| UL 508A listing | 35 % of Asian suppliers | $50k – $200k (OSHA willful) | N/A | $15k – $25k | 4 – 6 weeks |
| CE Tech File / 2006/42/EC | 25 % incomplete | Port refusal | €100k – €500k (member-state) | €20k – €35k | 6 – 10 weeks |
| FDA 21 CFR lubricants | 60 % use non-food-grade | $10k – $250k (FDA warning letter) | N/A | $8k – $12k | 2 – 3 weeks |
| ATEX Zone 22 | 70 % unrated | N/A | €1 million+ (criminal liability) | €15k – €25k | 3 – 4 weeks |
| REACH/RoHS materials | 20 % non-compliant | N/A | €200k – €1 million | €10k – €15k | 4 – 8 weeks (re-export) |
Legal Exposure Beyond Fines
Product-liability insurers now exclude coverage for machines lacking harmonized certifications. A single injury claim under EU Product Liability Directive 85/374/EEC averages €2.3 million settlement when the machine is missing CE documentation. In the US, 28 U.S.C. §1658 allows ten-year look-back on personal-injury suits; uncertified machines become stranded assets because resale value collapses below 30 % of book value once the incident record is docketed. Importers further face CPSC Section 15 reporting obligations; failure to file within 24 hours of a defect triggers criminal penalties up to $15 million for corporations.
Executive Action Checklist
Insert a “Certifications Cost-Cap” clause: any remediation above 3 % of FOB value is supplier-funded. Demand the UL/CE combo file at PO issuance, not at FAT; 30 % of suppliers cannot retro-engineer the paperwork without redesign. Require Notified-Body (EU) or NRTL (US) certificates to reference the exact serial number; generic “type” certificates are rejected by customs more than 40 % of the time. Finally, escrow 5 % of contract value until the machine clears its first annual insurance audit; underwriters flag 18 % of newly installed PET blow molders for non-compliance within the first policy year.
The Procurement Playbook: From RFQ to Commissioning
Strategic Procurement Playbook: PET Blowing Machine Sourcing (2025-2027)
RFQ Architecture: Lock-in Performance Before Price
Anchor the RFQ to ≤0.3 % preform scrap rate and ≥96 % OEE; anything lower shifts lifecycle cost upward by $0.42–$0.55 per 1 000 bottles. Demand a two-stage bid: technical envelope first, commercial second; suppliers that fail the former are disqualified before price exposure. Require disclosure of sub-component origin (heating oven, valve block, blow mold steel grade); 60 % of field failures trace back to tier-2 vendors. Insert a 3-year parts price freeze clause indexed to EUR/USD spot ±5 % band—historically shields buyers from 8–12 % forex spikes. Request lifecycle energy data: best-in-class servo machines now consume 0.23–0.25 kWh per 1 000 bottles, 18 % below legacy pneumatic systems; translate delta into cash at $0.12 kWh industrial tariff to justify any 8–10 % capital premium.
Factory Acceptance Test: Make-or-Break Gate
Schedule FAT at supplier’s line under ≤±5 °C ambient variance; viscosity-indexed PET behaves non-linearly outside this window, masking defects. Run a 4-hour continuous test using your own preforms—not vendor-supplied; dimensional drift within first 30 minutes reveals heater PID tuning gaps. Capture ≤±0.05 mm wall-thickness CV and ≤1 % top-load rejection; both predict downstream transport loss. Insist on full HMI data export in .csv; 70 % of warranty claims are denied for “lack of evidence.” Withhold 15 % of machine value until FAT sign-off; average rework cost for non-conforming units is $28 k–$42 k, equal to 2-week production loss on a 12 k h−1 line.
Incoterms Matrix: FOB vs DDP Decision Frame
| Cost & Risk Vector | FOB Shenzhen (USD) | DDP Chicago (USD) | Delta (DDP–FOB) | Control / Mitigation Levers |
|---|---|---|---|---|
| Machine Price | 420 k | 420 k | 0 | Benchmark against $380 k–$450 k regional median |
| Sea Freight + THC | 8 k | 0 (incl.) | –8 k | Lock $1 100–$1 300/FEU 12-month contract |
| Import Duty (HS 8477.30) | 8.5 k (2 %) | 8.5 k (2 %) | 0 | Verify correct tariff code; misclassification adds 7 % penalty |
| Cargo Insurance | 1.2 k | 0 (incl.) | –1.2 k | Ensure 110 % CIF + war risk |
| Demurrage Risk | 0.8 k (buyer) | 0 (seller) | –0.8 k | Average $120/day after 5 free days |
| Inland Freight | 4 k | 0 (incl.) | –4 k | Spot truckload index $2.05–$2.40/mile |
| Customs Broker | 1.5 k | 0 (incl.) | –1.5 k | Fixed fee vs. hourly dispute risk |
| Total Landed | 444 k | 452 k | +8 k (+1.8 %) | DDP premium ≤2 % → accept; >4 % → FOB + 3PL |
| Time Risk (days) | 45–50 | 35–38 | –10 | Each day equals $8 k–$12 k contribution loss |
Decision rule: Accept DDP if seller premium ≤2 % and schedule critical; otherwise FOB with nominated freight forwarder to retain $10 k–$15 k savings and claims control.
Contract Risk Controls: Beyond Warranty
Insert liquidated damages of 0.5 % of machine value per day for delay beyond agreed lead-time; average supplier buffer is 10 days, yielding $21 k penalty pressure. Require performance bond 10 % issued by top-50 global bank; 30 % of Chinese suppliers now accept, up from 12 % in 2020. Cap spare-parts margin at cost + 25 % for 5 years; OEM list margins average 42 %, translating to $85 k–$120 k avoidable spend on a $500 k line. Add source-code escrow for PLC and HMI; 25 % of post-warranty obsolescence issues require software patch unavailable without escrow trigger. Force Majeure clause must exclude “raw-material price fluctuation”; PET resin volatility (±25 % in 2021) is not unforeseeable.
Final Commissioning: Zero-Defect Handover
Demand 72-hour uninterrupted run at 105 % nameplate speed; thermal equilibrium stabilizes only after 48 h, exposing heater zone drift. Verify ≤65 dB(A) noise at 1 m; above 70 dB triggers OSHA engineering controls costing $5 k–$8 k per station. Capture digital twin baseline—SCADA snapshot of all set-points; future deviations >2 % void supplier liability unless re-certified. Release final 10 % retention only after achieving ≤0.5 % scrap on your resin, not vendor’s; empirical data show 0.7–0.9 % gap between the two.
⚡ Rapid ROI Estimator
Estimate your payback period based on labor savings.
Estimated Payback: —