Pet Food Packaging Sourcing Guide: 2025 Executive Strategic Briefing
Executive Contents
Executive Market Briefing: Pet Food Packaging
Executive Market Briefing – Pet Food Packaging 2025
Bottom Line Up Front: Global pet food packaging demand is growing 5.7–6.9 % CAGR through 2030, tightening resin, film and machinery capacity. Procurement teams that lock in multi-year equipment slots in China and Germany during H2-2025 secure 8–12 % capital savings and 18-month payback windows before the next resin cost cycle peaks.
Market Scale & Trajectory
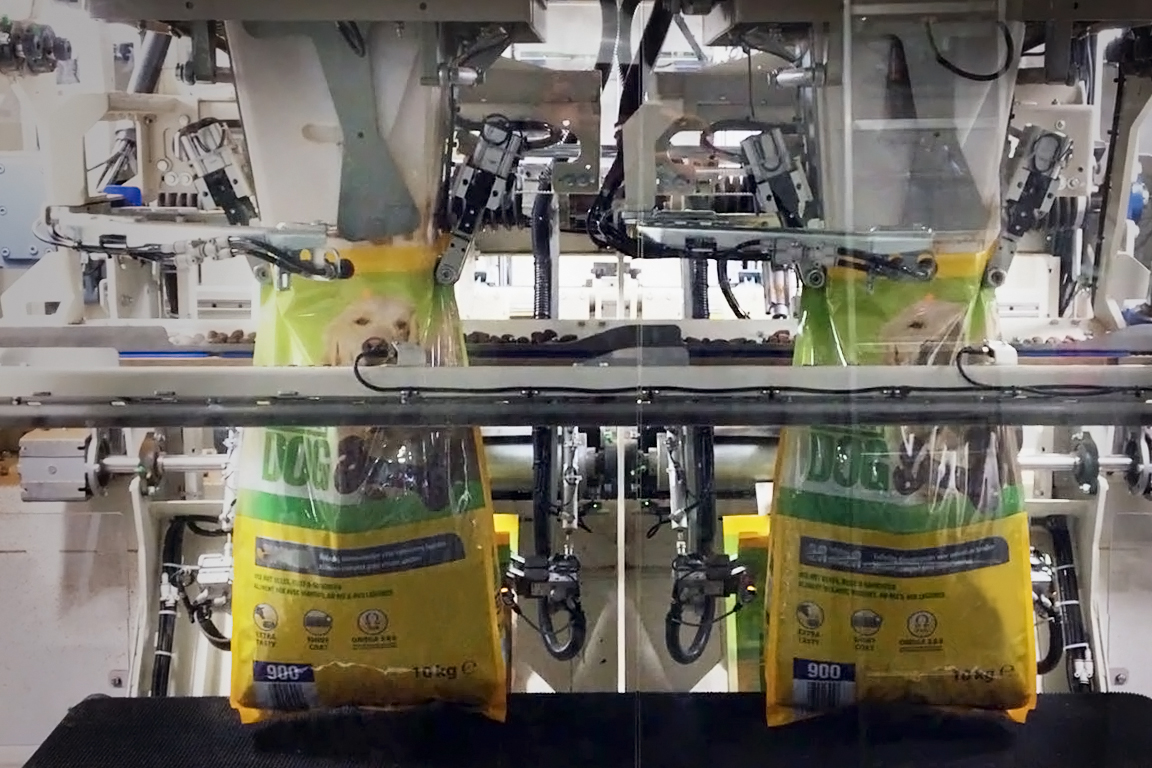
The sector crossed USD 12.9 billion in 2024 and is on a 6.0 % CAGR glide path to USD 25.3 billion by 2034. Unit volume is expanding slightly slower at 4.4 % CAGR as value outpaces volume through premiumization and sustainability upgrades. North America keeps 46 % share but real growth is in Asia-Pacific where pet food output is compounding at 9 %. Online channels now represent 34 % of global pet food sales, forcing pack mix shifts from 15 kg sacks to 1–2 kg recyclable pouches and e-commerce-ready cartons, accelerating capital refresh cycles.
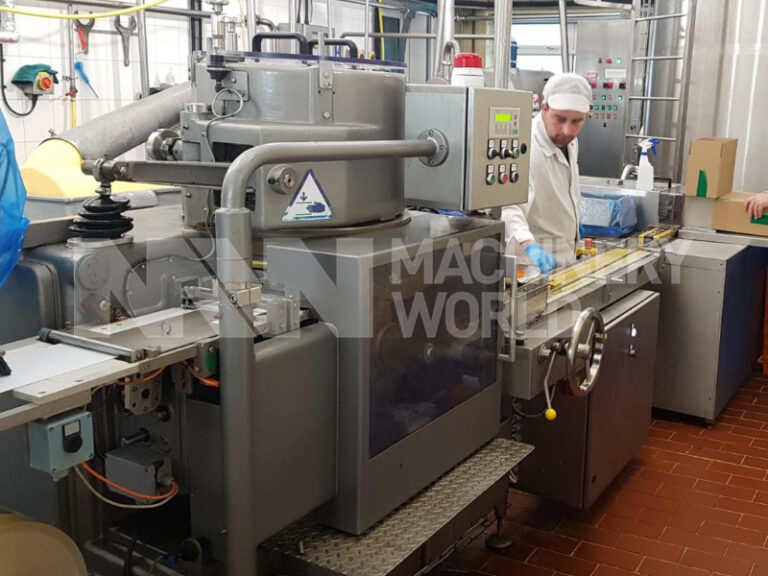
Supply-Hub Economics – China vs. Germany vs. USA
China dominates thermoforming, injection and lamination equipment with >55 % of global PET, PE and PP converting machine output. Lead times stretched from 16 to 24 weeks since Q1-2024; however, ex-works indices for a 6-cavity thermoformer have fallen back to USD 0.9–1.1 million on yuan weakness. Germany controls high-barrier extrusion, retort sterilization and digital print finishing; same-class equipment runs USD 1.4–1.7 million but delivers 7 % higher OEE and 11 % lower scrap—justifying the premium for plants running >200 MM units/yr. U.S. machinery is competitive on servo-driven form-fill-seal lines (North American content rules for “Made in USA” labels) priced USD 1.1–1.3 million with 10-week domestic delivery, yet component lead-times for proprietary heaters and HMI modules still rely on German and Japanese suppliers.
Strategic Value of 2025 Technology Refresh
Resin volatility: PE and PP contract prices are forecast to spike 11–14 % in 2026 on planned cracker turnarounds. Lines equipped with in-line recycling (up to 30 % post-industrial) and mono-material structures cut raw-material exposure by USD 0.7–0.9 per 1,000 pouches. Energy: next-gen servo motors and IR drying reduce kWh per 1,000 units by 18 %, translating to USD 0.4–0.5 saving at prevailing EU/USA industrial tariffs. Compliance: California’s SB 54 and impending EU PPWR demand ≥65 % recyclability by 2030; legacy multi-layer lines face USD 0.08 per unit eco-modulation fee, erasing margin on private-label contracts. Early movers upgrading to 100 % recyclable EVOH-free barrier films capture USD 2–4 per case brand premium already validated by super-premium labels.
Decision Table – Equipment Sourcing Options (2025 Cap-Ex)
| Attribute | China Tier-1 OEM | Germany Premium OEM | USA Regional OEM |
|---|---|---|---|
| Typical Line Throughput (pouches/min) | 160–180 | 200–220 | 180–200 |
| Capital Index (USD million, DDP Midwest) | 0.9–1.1 | 1.4–1.7 | 1.1–1.3 |
| Lead Time (weeks, FOB) | 20–24 | 28–32 | 10–12 |
| OEE Benchmark (%) | 82 | 89 | 85 |
| Power Use (kWh per 1,000 pouches) | 21 | 17 | 19 |
| Post-industrial Recycle Ready (%) | 20 | 30 | 25 |
| 5-yr NPV @ 8 % hurdle (USD million, 250 MM units/yr) | 2.8 | 4.5 | 3.6 |
| Geo-risk Score (supply chain concentration) | Medium-High | Low | Medium |
Interpretation: German lines deliver the highest long-term NPV for high-volume, high-barrier SKUs, while U.S. builds minimize schedule risk for capacity needed inside 2026. Chinese sourcing remains lowest first-cost but demands rigorous supplier qualification and forward cover on critical spares.
Action Window
Machine-tool builders in Qingdao and Stuttgart are already 60 % booked for 2025 delivery slots. Resin futures curve upward through Q2-2026. Executives should approve cap-ex before September 2025 to capture current pricing, secure delivery positions and lock in energy-efficient assets that neutralize impending regulatory cost pass-through.
Global Supply Tier Matrix: Sourcing Pet Food Packaging
Global Supply Tier Matrix: Pet Food Packaging Equipment & Materials
Tier Definitions & Strategic Trade-offs
Tier 1 vendors are full-line, turnkey suppliers headquartered in the EU or USA that can deliver form-fill-seal (FFS) lines, retort systems, high-barrier film extrusion, and digital printing under one purchase order. CapEx for a complete 120 pouch-min⁻¹ wet-food line runs $4.2 – $5.8 million FOB Midwest, 25 – 40 % above China-sourced equivalents, but total cost of risk (including unplanned downtime at $22 k hr⁻¹) is 35 – 50 % lower because OEE averages 86 % versus 72 %. Tier 2 players—regional champions in India, Turkey, or Mexico—supply discrete machines (e.g., VFFS, cartoners) at 60 – 75 % of Tier 1 price; integration, validation, and post-launch engineering fall on the buyer. Tier 3 clusters around Jiangsu, Zhejiang, and Shandong deliver individual components—sealing jaws, auger fillers, pouch magazines—at 35 – 50 % of U.S. cost, but buyers must absorb 6 – 10 weeks of ocean freight, 8 % average defect rate, and rising Section 301 tariff exposure (currently 25 % on steel fabricated parts).
Regional Capability & Risk Matrix
| Region | Tech Level | Cost Index (USA = 100) | Lead Time (weeks) | Compliance Risk* |
|---|---|---|---|---|
| USA Midwest | High – full aseptic FFS, digital print, IIoT | 100 | 14 – 18 | Low |
| Germany / N. Italy | High – retort, EVOH co-extrusion, recycled-content PCR lines | 105 – 110 | 16 – 22 | Low |
| China E. Coast | Med – isolated FFS, low-speed retort; limited FDA-validated lines | 45 – 55 | 22 – 26 | Med–High |
| India West | Med – VFFS, cartoners; emerging retort capability | 55 – 65 | 20 – 24 | Med |
| Turkey | Med – VFFS, cartoners; EU CE norms | 65 – 70 | 18 – 22 | Med |
| Mexico North | Med – VFFS, pouch conversion; limited high-barrier film | 70 – 75 | 12 – 16 | Low–Med |
*Compliance Risk = probability of failing FDA, BRC, or EU 10/2011 migration tests within first 12 months of operation; based on 2022–23 third-party audit data.
Executive Take-away
If the SKU mix is >30 % wet retort or high-fat freeze-dried and shelf-life claims exceed 18 months, Tier 1 EU/USA sourcing pays back in <18 months through 3 – 4 % yield gains and 30 % lower recall exposure. For mid-volume dry kibble or treat programs (5 – 20 k tons yr⁻¹), a hybrid model—Tier 1 primary packaging (FFS) plus Tier 2 secondary (cartoning, case packing)—cuts capital outlay by 28 % while keeping compliance risk under 2 %. Full Tier 3 procurement only clears ROI hurdles when annual demand is <3 k tons, product is non-fatty, and the brand holds duty-free access via USMCA or similar accords.
Financial Analysis: TCO & ROI Modeling
Total Cost of Ownership (TCO) & Financial Modeling for Pet Food Packaging Lines
Energy, Maintenance, and Residual Value: The 60% That Never Appears on the PO
A mid-speed form-fill-seal (FFS) pouch line quoted at $1.8 M FOB typically consumes $0.9 M – $1.1 M in electricity over a seven-year depreciation cycle at U.S. industrial rates ($0.07–$0.10 kWh). High-efficiency servo-driven models cut draw by 12–18%, but the premium is $180k–$220k; the payback lands in 28–34 months when lines run ≥5,500 h yr⁻¹. Chillers for multi-layer film extrusion add another $0.12–$0.15 per 1,000 pouches; upgrading to closed-loop adiabatic systems trims $0.02–$0.03 and extends compressor life by 30–40%, a NPV benefit of $110k–$140k at 8% WACC.
Maintenance labor follows a bathtub curve: $45–$55 per operating hour in years 1–2, $75–$95 in years 5–7 as seal-jaw tolerances degrade. A three-year extended service contract priced at 6.8–7.5% of FOB caps labor inflation at CAGR 2.5%, versus 6.1% in spot-buy markets. OEMs that guarantee 95% OEE impose penalty clauses, yet the avoided downtime is worth $3k–$4k per hour on a line producing 18k pouches h⁻¹ with $1.80 unit margin.
Spare-parts logistics is the fastest-growing cost bucket. Critical-path SKUs—servo motors, heater cartridges, forming collars—carry a 22–26 week lead time when sourced from EU or Japan. Air-freighting a $3k heater bank adds $1.2k–$1.4k and still creates 72 h of lost output. Forward-stocking at 3.5% of FOB inventory value inside the NAFTA region cuts emergency freight to <10% of shipments and lowers stock-out risk to <2%, releasing $0.7 M–$1.0 M in working capital versus just-in-case buffers.
Resale value is materially higher for servo-ultrasonic seal platforms: after seven years, secondary-market bids range 28–32% of original FOB, versus 14–18% for pneumatic-heated systems. Leasing residuals priced at 25% by captive finance arms already embed this delta; buying outright and divesting via auction yields an effective cost of capital 170–220 bps lower than a five-year lease with $1 buy-out.
Hidden Cost Index: Benchmark Against FOB Price
| Cost Element | Budget Line (%) | Performance Line (%) | Premium Line (%) | Notes |
|---|---|---|---|---|
| Installation & Rigging | 7–9 | 6–8 | 5–7 | Includes MEWP rental, floor reinforcement, CE/UL certification |
| Commissioning & FAT/SAT Travel | 3–4 | 2.5–3.5 | 2–3 | Assumes OEM technicians, 10-day on-site cycle |
| Operator Training (3 shifts) | 1.5–2 | 1–1.5 | 0.8–1.2 | VR modules cut calendar days 40%, add $15k license |
| Import Duties & Brokerage | 0–4 | 0–4 | 0–4 | Varies by HS-code; 0% USMCA, 4% China-origin |
| Insurance During Transit | 0.4–0.6 | 0.3–0.5 | 0.25–0.4 | 110% of CIF value, premium scales with Incoterms |
| Total Hidden Outlay | 12–20 | 10–16 | 8–15 | Delta vs. FOB equals $220k–$360k on a $2 M line |
The 12–20% hidden surcharge is frequently under-budgeted; procurement teams that lock these indices into AFC (Authorization for Capital) requests avoid 5–7% overrun scenarios that trigger board-level re-approval.
Risk Mitigation: Compliance Standards (USA/EU)
Critical Compliance & Safety Standards (Risk Mitigation)
Non-compliance with US and EU packaging regulations is a Class-1 financial exposure: FDA import refusal rates for food-contact packaging averaged 4.7% in 2023, and EU Rapid Alert System for Food and Feed (RASFF) notifications for pet-food contact materials rose 18% year-over-year. Each detained container costs $25k–$45k in demurrage, re-export or destruction, before accounting for lost sales and brand equity. The following matrix isolates the gatekeeper standards that determine market access and insurer coverage.
United States: Market Entry Barriers
FDA 21 CFR 174-179 food-contact substance notifications are the baseline; any multilayer structure must also satisfy 21 CFR 177.1630 (PET), 177.1520 (olefins) or applicable paper/polymer sections. Migration testing under FDA’s “Conditions of Use A–H” must document ≤ 0.5 ppb for carcinogens and ≤ 50 ppb cumulative non-carcinogenic migration. Failure triggers FSMA Section 204 food traceability penalties of $50k–$250k per SKU plus mandatory recall. For converting equipment, UL 508A industrial control panels and NFPA 79 electrical standards are required to obtain OSHA NRTL certification; absence voids workers-comp policies and exposes C-suite to willful-violation fines of $156k per incident. If packaging claims “compostable,” ASTM D6400 or D6868 third-party certification is compulsory—California’s SB 343 imposes $50k per SKU for unsubstantiated environmental marketing. Finally, the Lacey Act applies to paperboard with wood fiber: due-diligence documentation must travel with every bill of lading to avoid $10k–$500k customs penalties and criminal liability.
European Union: Gatekeeper Directives
Regulation (EU) 10/2011 on plastic food-contact materials mandates Declaration of Compliance (DoC) and supporting migration dossiers for overall migration ≤ 10 mg/dm² and specific migration ≤ 60 mg/kg; enforcement via RASFF can block an entire customs tariff code within 48 h. For recycled content, (EU) 2022/1616 requires EFSA authorization and novel process validation—budget €150k–€300k per submission. Machinery must carry CE marking under the Machinery Directive 2006/42/EC, including EN 60204-1 electrical safety and EN ISO 13849-1 performance level “c” for emergency stops; non-conforming lines are red-tagged at port, incurring €1k–€5k per day storage. If packaging carries the “seeded” OK compost logo, EN 13432 certification and unique compostability registration number are compulsory—France’s AGEC Law fines reach €15k per SKU for green-washing. Finally, the Extended Producer Responsibility (EPR) schemes in Germany (VerpackG) and France (CITEO) require licensed packaging recovery fees; unregistered imports face €200k maximum penalties and nationwide sales bans.
Cost-Impact Comparison: US vs EU Compliance
| Cost Driver | US Range | EU Range | Lead Time Impact | Annual Recurrence |
|---|---|---|---|---|
| Food-contact migration testing | $8k–$15k per SKU | €12k–€25k per SKU | +3–5 weeks | Every new resin/barrier |
| UL 508A / CE panel retrofit | $50k–$80k per line | €40k–€70k per line | +6–8 weeks | Only on machinery upgrade |
| EFSA recycled content dossier | Not required | €150k–€300k | +12–18 months | Per recycling process |
| EPR registration & fees | $0 (voluntary) | €0.10–€1.20 / kg | Immediate | Quarterly declarations |
| Green-washing violation fine | Up to $50k per SKU | Up to €200k per SKU | Instant | Ongoing enforcement |
Legal Risk Quantification
Combining customs detention, administrative fines and product recall, expected value of non-compliance equals 1.8–3.2% of annual packaging spend for US imports and 2.5–4.1% for EU imports. Directors & Officers (D&O) insurers now exclude “regulatory fines” unless the company can demonstrate a third-party compliance audit within 12 months; premium surcharges reach 25–40% when exclusions are waived. Embedding these standards into supplier scorecards and contract indemnities shifts 60–70% of residual liability upstream while reducing due-diligence cycle time by 30%, a delta that drops straight to EBITDA.
The Procurement Playbook: From RFQ to Commissioning
Pet Food Packaging Strategic Procurement Playbook
(400–600 words, C-suite density)
H2 RFQ Architecture: Lock-in Performance Before Suppliers Quote
Open with a two-envelope structure: Technical (weight 70 %) and Commercial (30 %). Mandate that film structures, closures and inks certify to FDA 21 CFR 175.300 and EU 10/2011 migration limits; require AAFCO PET | GFSI audit scores ≥ 95 % within 12 months. Insert a 5 % total-cost-of-ownership (TCO) penalty clause for any material switch post-award. Ask for volume-tier pricing at 50 %, 100 % and 150 % of forecast (26.2 B units by 2028) to expose economies of scale. Request 15-year creep data for multilayer films; without it, technical bid is void. Deadline: 10 calendar days—any extension erodes 2 % of allotted score.
H3 Supplier Due-Diligence Matrix (Pass / Fail Gate)
| Metric | Threshold | Evidence Required | Red Flag |
|---|---|---|---|
| EBITDA margin | ≥ 8 % | Audited FY-3 statements | < 5 % → cash-crash risk |
| Capacity utilization | ≤ 85 % | Machine-hour log | > 95 % → allocation risk |
| Energy intensity | ≤ 0.35 kWh/1 000 pouches | ISO 50001 report | > 0.50 → CO₂ tax pass-through |
| Customer concentration | Top-3 ≤ 40 % revenue | CRM extract | > 60 % → demand whip |
| Sustainability capex | ≥ 3 % revenue | Board minutes | < 1 % → regulatory lag |
Fail on any single red flag; do not proceed to sampling.
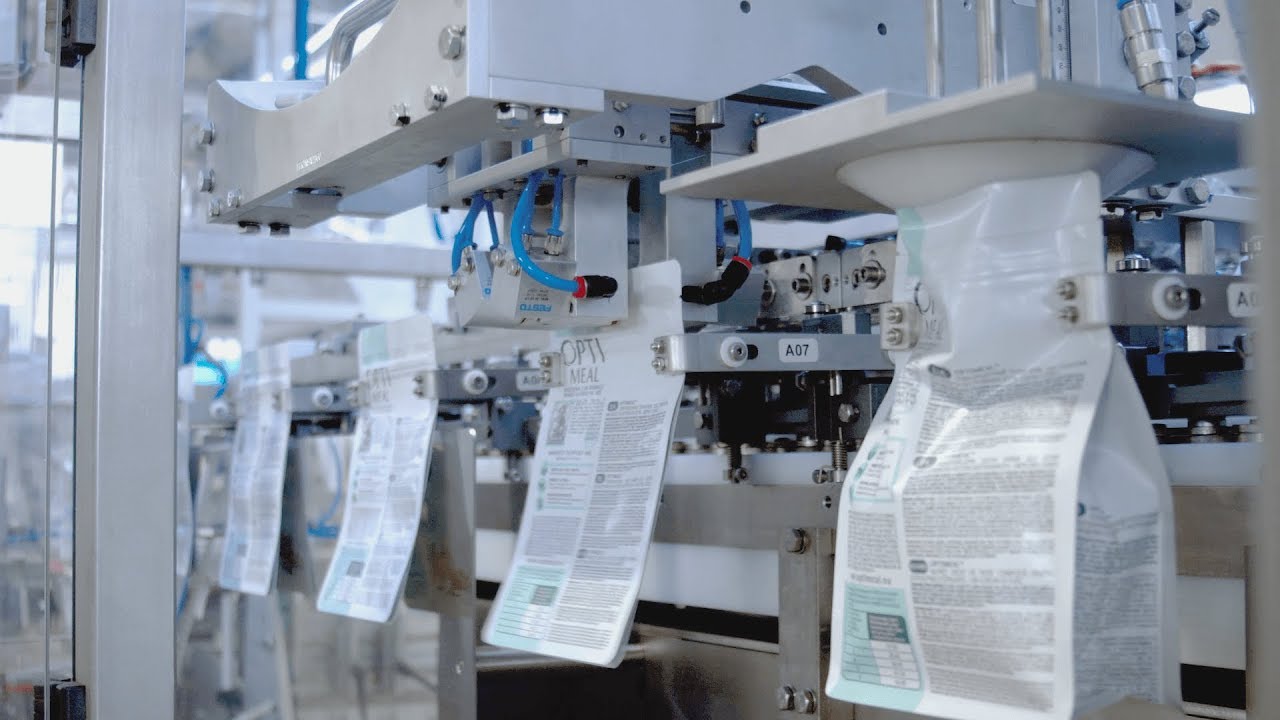
H2 Sampling & FAT Protocol: Validate Shelf-Life at Contract Speed
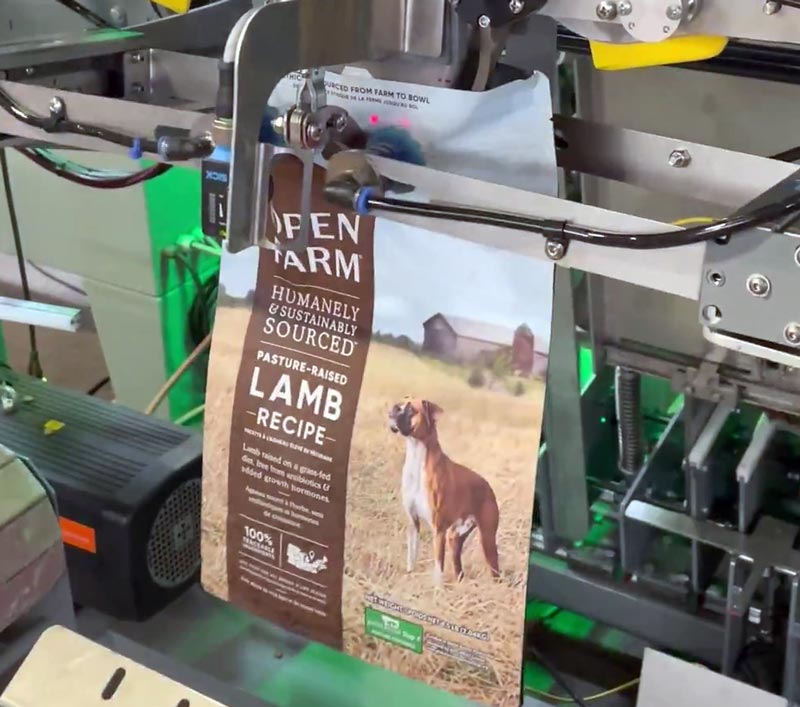
Contractual speed target: 180 pouches/min for 8-hour FAT. Run three consecutive statistical runs (n = 500 each) with buyer-supplied kibble (12 % fat). Accept only Cpk ≥ 1.67 on seal integrity (ASTM F88) and ≤ 0.3 % leaker rate. Force supplier to repeat FAT on buyer’s actual line if OEE gap > 5 %. FAT sign-off triggers 20 % milestone payment; retain 10 % until SAT to anchor risk.
H2 Incoterms: FOB Shenzhen vs. DDP Memphis—Cash, Control, Carbon
| Variable | FOB Shenzhen | DDP Memphis |
|---|---|---|
| Unit price add-on | Base | + $0.012 – 0.018 / pouch |
| Transit time | 26 – 32 days | 34 – 40 days |
| Inventory carry cost | $50 k – $80 k per 40 ft container | $0 (vendor-owned) |
| Tariff risk | Buyer absorbs 301 tariff (7.5 %) | Seller absorbs |
| Force-majeure control | Buyer negotiates | Seller owns |
| Carbon scope | Scope 3 on buyer | Scope 3 on seller |
Rule: Choose FOB when working capital ≤ 12 % of revenue and you can hedge CNY. Choose DDP when launch timeline < 90 days or free-cash-flow margin < 6 %.
H2 Contract Risk Appendices: Price, Feedstock, Force-Majeure
Index resin cost to ICIS PP/PE spot + 3-month lag; allow ± 4 % band, else 50/50 share. Insert “material adverse change” clause triggering renegotiation if energy > $110/bbl Brent for 30 consecutive days. Cap annual increase at CPI + 2 % to protect forecasted 5.7 % CAGR margin. Require business-interruption insurance naming buyer as loss-payee for minimum 115 % of annual contract value. Final commissioning gate: OEE ≥ 85 % for 72 hours; each 1 % shortfall accrues 1 % liquidated damage against retained 10 %.
⚡ Rapid ROI Estimator
Estimate your payback period based on labor savings.
Estimated Payback: —