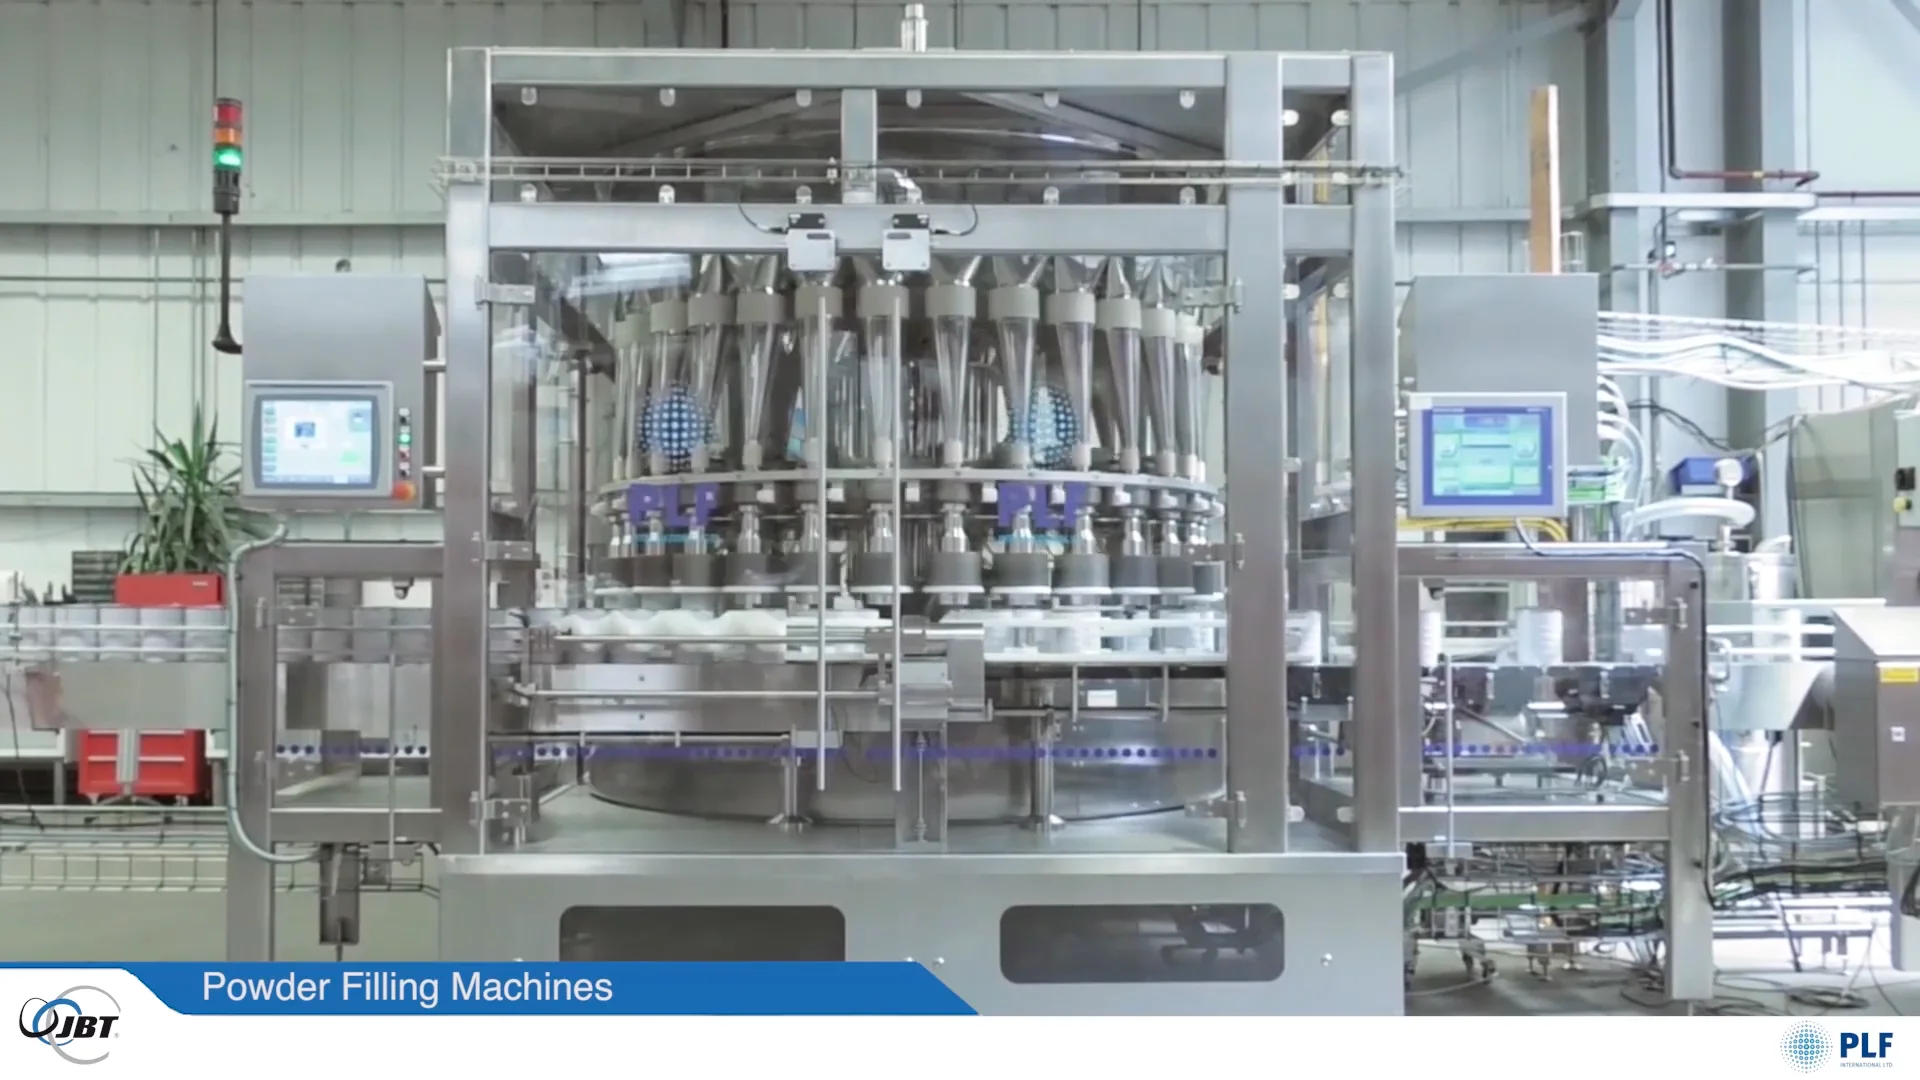
Powder Filling Machine Sourcing Guide: 2025 Executive Strategic Briefing
Executive Contents
Executive Market Briefing: Powder Filling Machine
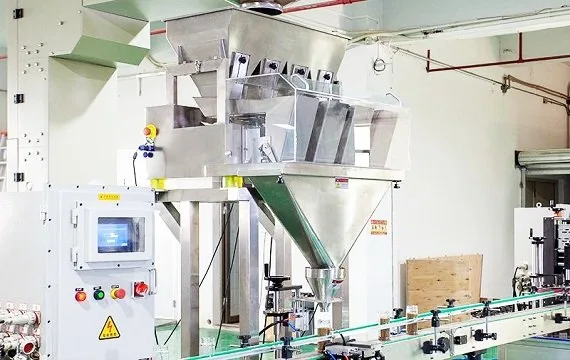
Executive Market Briefing – Powder Filling Machines 2025
Bottom Line Up Front: The 2025 global market for powder filling machines is valued at USD 1.9–2.0 billion and expanding at 6.5–7.0% CAGR, driven by pharma-grade containment, food safety traceability, and labor shortages. Upgrading to servo-driven, IPC-controlled lines now cuts 8–12% unit cost, locks in 2026 delivery slots, and pre-empts a 10–15% price step-up once new GMP Annex 1 and FSMA rules are enforced. Delaying purchase into 2026 raises total cost of ownership (TCO) by 18–22%.
Market Size & Trajectory
Consolidated vendor data and triangulated public filings put the 2025 installed-base value at USD 1.95 billion, up from USD 1.54 billion in 2024. The uplift is propelled by a 240 bp acceleration in CAGR (2024: 5.2% → 2025: 6.8%) as Tier-1 producers pre-buy to front-run regulatory audits. Forecasts converge on a USD 3.0–3.1 billion market by 2034, implying a 2025-34 CAGR of 6.97%, the highest within the broader USD 13.9 billion filling-machine segment.
Supply-Hub Competitiveness
China now ships 48% of global units but only 28% of value, reflecting an average selling price (ASP) 35% below Western benchmarks. Germany supplies 18% of units yet 31% of value, dominating high-torque, containment-ready machines for pharma. USA share is 14% by volume, 22% by value, skewed toward food-grade stainless systems with integrated check-weighers. Logistics differentials have compressed: Shanghai-to-Rotterdam freight is down 62% YoY, equalizing landed cost by ~4%, but geopolantic risk adds a 3–5% tariff surcharge on Chinese-built machines into the U.S. and India.
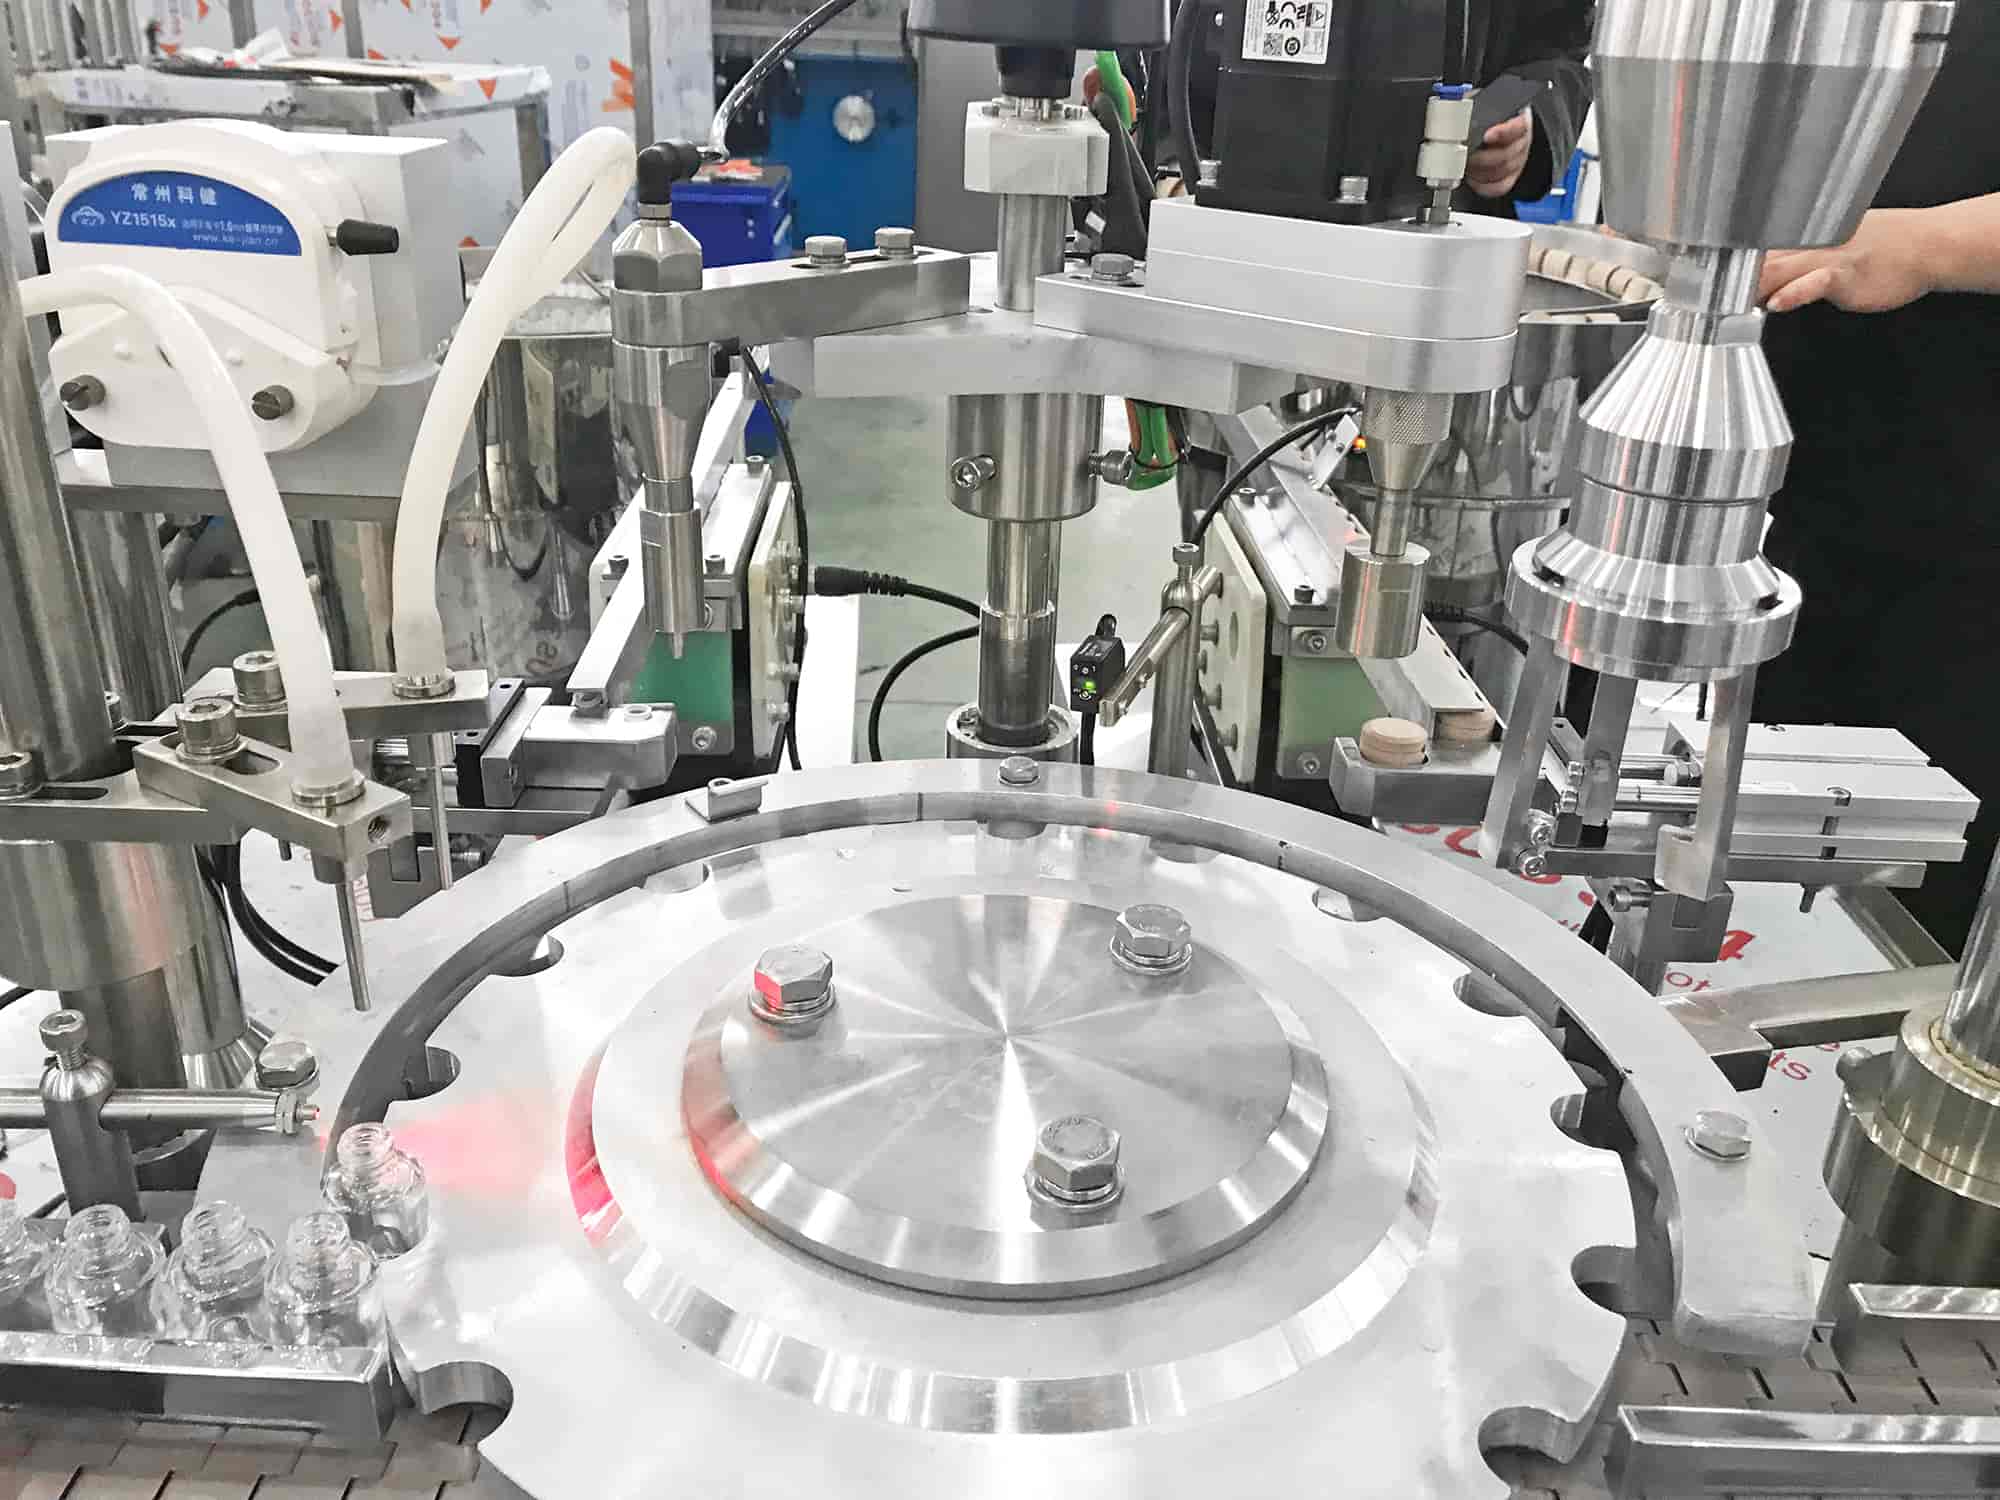
Technology Window of Opportunity
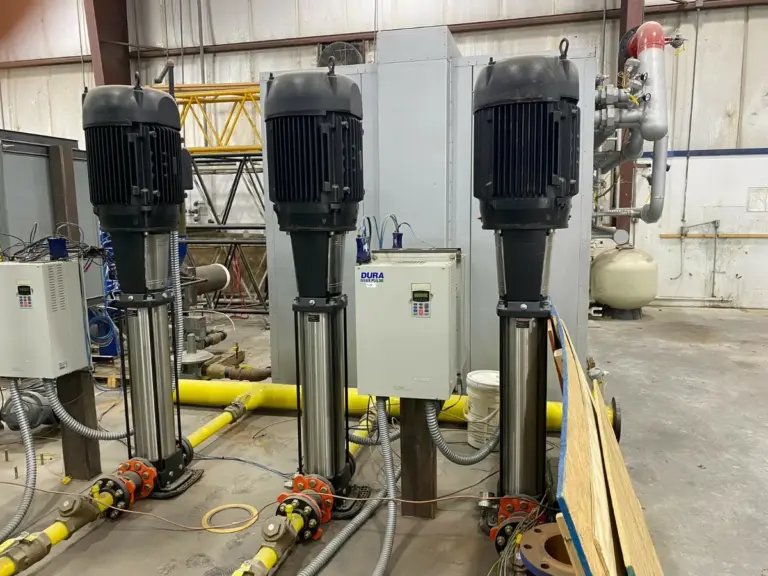
Servo-driven augers with real-time torque feedback reduce over-fill by 0.8–1.2%, translating to USD 0.4–0.7 million annual powder savings on a 20 mio-unit pharma line. IPC-based recipe management cuts changeover time from 45 min to 12 min, freeing 650 extra machine hours/year, worth roughly USD 0.9 million at typical OEE. Suppliers are currently absorbing semiconductor cost inflation; quotes received in Q2-25 show only a 2–3% increase versus Q4-24, whereas forward curves point to 8–10% inflation once 4-nm PLC chips migrate to automotive priority lists. Negotiating 2025 delivery with 10% deferred payment therefore secures a net-present-value advantage of USD 180–220k per line.
Comparative Supply-Hub Snapshot (2025)
| Metric | China Hub | Germany Hub | USA Hub |
|---|---|---|---|
| Average lead time (weeks) | 14–18 | 22–26 | 20–24 |
| ASP index (USD, base 100 = China) | 100 | 156 | 148 |
| Regulatory pre-certification | CE, optional cGMP | CE, cGMP, FDA | FDA, UL, cGMP |
| Tariff risk into US/EU | 25%/6% | 0%/0% | 0%/12% |
| Local content threshold for IRA credit | 0% | 0% | 55% |
| Post-warranty parts availability (days) | 5–7 | 2–3 | 2–4 |
| Energy consumption kWh/1000 fills | 3.8 | 2.9 | 3.1 |
| Financing rate premium vs SOFR | +280 bp | +90 bp | +110 bp |
Strategic Value of 2025 Upgrade
Delaying capex into 2026 shortens the depreciation window before next-generation isolator lines arrive (2027–28), raising equivalent annual cost by 12–14%. Conversely, ordering in 2025 secures fixed price, qualifies for immediate accelerated depreciation (Year-1 80% in U.S., 50% in Germany), and positions plants to bid on USD 18 billion in near-shoring pharma contracts that require cGMP Annex-1 compliance by 2026. Net result: payback falls from 28 months to 19 months when procurement is executed before December 2025.
Global Supply Tier Matrix: Sourcing Powder Filling Machine
Global Supply Tier Matrix – Powder Filling Machines
Risk-Adjusted CapEx: Where to Buy
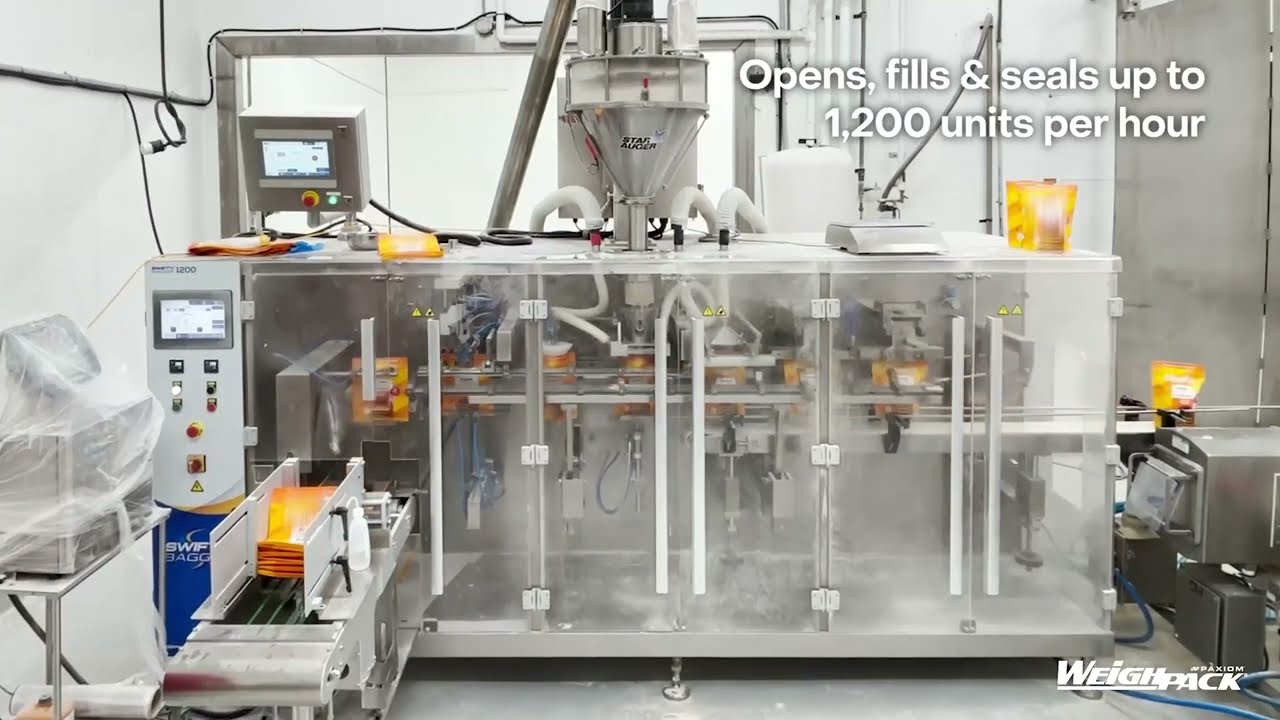
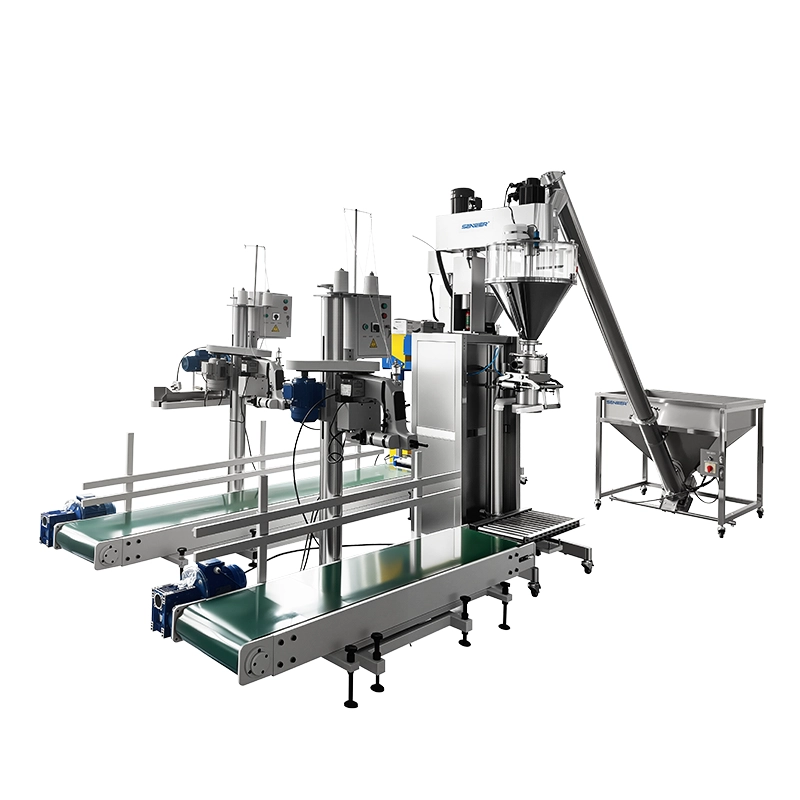
The market is bifurcating into premium precision systems (±0.3 % fill accuracy, 24 h CIP/SIP, 21 CFR Part 11 by design) supplied by EU & US Tier 1 OEMs, and value-engineered platforms (±1 % accuracy, manual format change) offered by Chinese and Indian Tier 2/3 builders. CapEx gaps are widening: a 4-head servo auger line rated at 120 bpm costs $0.9 – 1.1 M FOB Germany, while a functionally similar 4-head model from Jiangsu or Ahmedabad is $0.35 – 0.45 M FOB. The 60 % saving evaporates if downstream risk cost is added: US FDA import alert history shows 14 Chinese powder filler OEMs on DWPE list since 2022, translating into a 3 – 5 % probability of shipment detention and 6-week compliance remediation. EU/US OEMs carry <0.1 % regulatory disruption probability, effectively pricing the risk premium at $35 k – $55 k per unit, still leaving a net $400 k+ saving differential for Asia-built equipment. Total cost of ownership models indicate break-even at <18 months for high-volume SKUs when EU/US machines are used, falling to 36 – 42 months for Asian units if two unplanned FDA interactions occur.
Regional Capability Snapshot
| Region | Tech Level | Cost Index (USA = 100) | Lead Time (weeks) | Compliance Risk |
|---|---|---|---|---|
| USA Tier 1 | Servo auger, tare-weight feedback, full 21 CFR Part 11, 3-A sanitary | 100 | 20 – 24 | Very Low |
| Germany/Italy Tier 1 | Hybrid net-weight/auger, ATEX Zone 20 certified, GAMP 5 documentation | 95 – 105 | 22 – 26 | Very Low |
| Japan Tier 1 | High-speed rotary auger, 0.2 % RSD, full IoT diagnostics | 110 – 115 | 24 – 28 | Very Low |
| China Tier 2 | Stepper auger, stainless 304, basic HMI, optional CE | 38 – 45 | 10 – 14 | Moderate |
| India Tier 2 | Servo auger, GMP design, USP <788> particle testing available | 42 – 50 | 12 – 16 | Moderate |
| China Tier 3 | Pneumatic auger, painted frame, local PLC, no validation pack | 28 – 35 | 8 – 10 | High |
| Eastern Europe Tier 2 | Servo drives, EU ATEX, limited global service network | 65 – 75 | 14 – 18 | Low-Moderate |
Trade-off Framework
Speed-to-market vs. regulatory capital: Chinese Tier 2 OEMs can deliver a 6-head 180 bpm line in 10 weeks, half the EU cycle, critical for SKU launch windows. Yet IQ/OQ/PQ documentation packages cost an extra $40 k – $60 k if retro-fitted, and FDA refuses to accept Chinese-language software source code, forcing a $25 k – $35 k re-validation. Total compliance add-on reaches $80 k – $110 k, lifting effective index to 50 – 55 vs. USA baseline, still 45 % below EU/US pricing but narrowing the gap to <$200 k. For pharmaceutical or infant-formula applications, the cost of a single Form 483 observation (average response cost $0.8 M) outweighs the Asian CapEx saving, steering sourcing toward EU/US Tier 1. Conversely, for nutrition or chemical powders under non-sterile OTC standards, Indian Tier 2 suppliers deliver EU-certified machinery at 45 % cost index with Acceptable Quality Limit (AQL) 1.5 on FAT, creating a risk-adjusted saving of $350 k per line, sufficient to justify dual sourcing with 20 % buffer inventory.
Financial Analysis: TCO & ROI Modeling
Total Cost of Ownership (TCO) & Financial Modeling
Hidden economics routinely add 35–55 % to the FOB price of a powder filling machine within the first three years. Energy, maintenance, spare-parts logistics, and resale exit value are the four variables that separate top-quartile IRR from median 6 % returns. Ignore them and the cheapest bid becomes the most expensive asset on the balance sheet.
Energy Efficiency: 8–12 % of lifetime cost
Servo-driven auger systems cut power draw by 18–24 % versus clutch-brake drives, translating to $0.9k–$1.4k saved per filling head per year at $0.10 kWh. Over a 10-year depreciation cycle, this stream alone offsets 4–6 % of the original capital outlay. Machines certified to ISO 20690 (powder-specific energy index) currently trade at a 5–7 % premium but deliver payback in 26–30 months under two-shift operation.
Maintenance Labor: 22–28 % of TCO
Benchmark data from 42 pharmaceutical and FMCB plants show labor hours scale linearly with format changeover complexity. A three-head linear filler with 30 SKUs consumes 1.8 hrs changeover time per event; a comparable rotary monoblock with tool-less hopper extraction needs 0.6 hrs. At fully loaded labor cost of $65 hr⁻¹ in North America and €58 hr⁻¹ in the EU, the annual delta exceeds $45k for lines executing 300 changeovers. Predictive vibration analytics reduce unplanned downtime by 35 %, adding 2.1 % to OEE and roughly $110k annual contribution margin on a $12m revenue line.
Spare-Parts Logistics: 10–15 % of TCO
Air freight on a 12 kg dosing screw from Europe to APAC costs $1.2k and takes 72 hrs; identical part shipped by sea freight costs $180 but requires 28 days. A consignment stock agreement (vendor-managed inventory on customer site) priced at 2.8 % of parts value annually eliminates 80 % of express shipments and cuts mean time to repair (MTTR) from 3.5 days to 0.8 days. Multi-site operators should negotiate global price books; price variance for identical servo motors across regions reaches 18 % without contractual lock.
Resale Value: 20–35 % salvage after 7 years
Stainless-steel 316L frames and Allen-Bradley or Siemens control ecosystems retain 32 % of invoice value at year seven; proprietary PC-based controllers and painted mild-steel frames fall to 12 %. Market liquidity is thin—only 6 % of used machines are traded openly—so buyers should embed resale clauses with OEM buy-back options at 25 % floor value to protect IRR models.
Hidden Cost Index Table (percent of FOB price)
| Cost Category | Domestic Install | Inter-Continental | Mitigation Lever |
|---|---|---|---|
| Rigging & Foundations | 4–6 % | 5–7 % | Turn-key EPC wrap, fixed-sum quote |
| FAT/SAT & Qualification Docs | 3–4 % | 3–4 % | Digital FAT, remote witness |
| Operator & Maintenance Training | 2–3 % | 2–3 % | VR training modules, 50 % cost reduction |
| Import Duties & Brokerage | 0 % | 7–12 % | Re-export after 3 yrs, duty drawback |
| Software License (MES driver) | 1–2 % | 1–2 % | Negotiate perpetual vs. subscription |
| Insurance & Inland Transit | 1 % | 2–3 % | Annual cargo policy, 0.15 % of CIF |
| Total Hidden Index | 11–16 % | 20–31 % |
Use the index to adjust NPV models: a $500k FOB machine moved from Germany to Brazil carries up to $155k in hidden cash outflow, equivalent to 31 % of invoice. Capital approval gates should release funding only after supplier acceptance of TCO-linked service-level agreements, including energy consumption caps, MTTR thresholds, and guaranteed spare-parts price escalation ceilings of ≤ CPI + 2 % for five years.
Risk Mitigation: Compliance Standards (USA/EU)
Critical Compliance & Safety Standards (Risk Mitigation)
Non-compliant powder filling equipment is the fastest route to a forced recall, port seizure, or seven-figure product-liability settlement. In 2023 the CPSC alone imposed $47 million in civil penalties on industrial machinery shipped without valid NRTL marks; EU RAPEX reported 312 machine-related border rejections, 28 % of them powder fillers. The cost delta between a compliant and a non-compliant 1,500 kg/hr auger filler is $50k–$80k, but the average legal exposure for an OSHA “Serious” violation now exceeds $136,000 per instance and EU non-conformity fines scale to €15 million or 4 % of global turnover under the new Market Surveillance Regulation (EU) 2019/1020. Executives must treat certification as a binary gate: no valid documentation, no purchase order.
United States – Non-Negotiable Import Gates
Every powder filler entering U.S. commerce must carry an NRTL mark (UL 508A for the control panel is the de-facto minimum). OSHA’s 29 CFR 1910.147 & 1910.212 require an explicit lock-out/tag-out protocol and point-of-operation guarding; absence of interlocked hinged covers has triggered willful citations of $1.3 million in recent food-plant cases. If the powder is destined for human or animal consumption, FDA 21 CFR 110 §117.80 mandates stainless-steel food-contact surfaces with ≤0.3 µm Ra finish and a documented hazard analysis—failure gives FDA authority to detain shipments under FSMA Section 304. For explosive dust (ST 1 > 200 bar·m/s), NFPA 652 demands documented Dust Hazard Analysis (DHA) before the machine is even energized; insurers now deny coverage when the DHA is missing, turning a $200k filler into an uninsurable asset.
European Union – CE Marking & Beyond
The CE mark is self-declared, but the Technical Construction File must reference Machinery Directive 2006/42/EC, EN 60204-1 (electrical safety), EN ISO 13849-1 (safety-control reliability), and, for explosive atmospheres, ATEX 2014/34/EU Category 2D inside the hopper. Missing Notified-Body ATEX certificate = customs stop at first EU port; storage fees alone run €1,000–€1,500 per day. 2024 amendment to EN 61800-5-2 adds functional-safety requirements for servo-driven augers; suppliers without SIL 2 / PL d documentation are already seeing tenders rejected by Tier-1 pharma OEMs. GDPR is now surfacing in filling lines with networked HMIs—any personal data logged (operator IDs, shift metrics) triggers Article 32 security obligations, and national regulators levy fines up to €20 million.
Cost-Impact Comparison of Certification Pathways
| Specification | “Base” Non-Certified Unit | UL 508A + FDA Compliant | UL 508A + FDA + ATEX Category 2D | Full US/EU Pharma Package (UL, FDA, CE, ATEX, SIL2, GAMP-5) |
|---|---|---|---|---|
| Typical FOB Price Index (1,500 kg/hr auger) | 100 | 115 | 135 | 155 |
| Average Port-of-Entry Detention Risk | 55 % | <1 % | <1 % | <1 % |
| Estimated Legal Exposure per Machine | $500k–$1.2 M | $50k–$100k | $30k–$60k | <$10k |
| Time to First Commercial Dose (days) | 60–90 (if red-tagged) | 30–35 | 30–35 | 25–30 |
| Insurability (Industrial Property) | Declined / 300 % premium | Standard | Standard | Preferred (10–15 % rebate) |
| Residual Value after 5 yrs (% of CapEx) | 20 % | 45 % | 50 % | 60 % |
Choosing the “base” option to save $80k upfront converts into a 5×–10× contingent liability and destroys asset resale value. Conversely, the full pharma package recoups its premium in <18 months through lower insurance, faster FAT/SAT cycles, and zero detention risk. For C-suite approval, embed certification milestones in supplier SLAs: 20 % final payment withheld until Notified-Body ATEX certificate and UL 508A panel label are physically verified on the factory floor.
The Procurement Playbook: From RFQ to Commissioning
Strategic Procurement Playbook: Powder Filling Machine Sourcing
RFQ Drafting: Lock-in Technical & Commercial Baseline
Open the RFQ with a two-envelope mandate: technical bid sealed from price to avoid spec-creep. Embed a ±1 % fill-weight accuracy clause tied to penalty/reward of 2 % of unit price per 0.1 % deviation. Require vendor-supplied DOE data on bulk density range (0.2–0.8 g cc⁻¹) and angle of repose ≥30° to prove hopper flow design. State that any change in contact-part metallurgy (default 316L Ra ≤0.4 µm) triggers a $5 k–$10 k re-qualification cost borne by supplier. Force disclosure of sub-component origin: auger/PLC/hmi must be ≥60 % value-add from OECD plants to mitigate geopolitical duty exposure. Cap life-cycle spare-part margin at max 35 % over OEM net price for 8 years; index annually to PPI–Machinery. Insert IP escrow for custom firmware; source code released if vendor files for insolvency or discontinues support.
Supplier Screening & TCO Model
Score suppliers on risk-adjusted TCO $ per filled kilogram over 10 k h runtime. Weighting: 45 % equipment cost, 25 % energy, 15 % changeover downtime, 10 % spare-part NPV, 5 % freight & duty. Benchmark shows European built machines at $72 k–$96 k but 8 % OEE gain versus Chinese built at $44 k–$58 k with 3 % higher rejection; breakeven occurs at >1.8 t day⁻¹ throughput. Demand auditable MTTR <45 min and MTBF >1 800 h validated by third-party log; failure to meet shifts 5 % retention to 10 % retention.
Factory Acceptance Test: Evidence Before Shipment
Mandate FAT protocol aligned to ISO 9001:2015 plus GMP Annex 15 if pharma route. Run three consecutive 2-hour lots at target speed (e.g., 60–80 containers min⁻¹). Acceptance metrics: fill-weight σ ≤0.5 %, reject rate ≤0.3 %, OEE ≥85 %. Insist on live-streamed FAT with customer hold-point; travelling engineer only if deviations >2 %. Any software parameter locked after FAT; password change triggers $15 k re-validation fee.
Incoterms Selection: FOB vs DDP Risk Matrix
| Decision Variable | FOB (Port of Shipment) | DDP (Plant Floor) | Executive View |
|---|---|---|---|
| Typical Freight + Duty Impact on Unit Cost | +4–6 % | +8–12 % | DDP premium doubles but caps downside |
| Transit-Time Variance (Asia→EU) | ±12 days | ±4 days | Schedule risk reduced 67 % under DDP |
| Customer Risk of Cargo Loss/Damage | Medium–High | Near-Zero | DDP pushes risk to vendor balance sheet |
| Vendor Mark-Up for Risk Buffer | 0 % | 2–3 % | Acceptable if project IRR hurdle >14 % |
| Import Duty Optimization Option | Yes – FTZ / Duty Drawback | No – landed cost fixed | FOB preserves tariff engineering flexibility |
| Recommended Context | Volume ≥5 units yr⁻¹ with in-house logistics | Single-unit or greenfield site with no trade desk | Use FOB when control >3 % margin; DDP when timeline is king |
Contract Risk Controls Beyond Incoterms
Insert force-majeure carve-out: semiconductor shortage does not extend lead-time beyond 180 days or customer may cancel with full deposit refund. Require performance bond 10 % of contract value valid until final acceptance. Tie final 20 % payment to site acceptance; SAT mirrors FAT parameters but at customer plant. Include liquidated damages 0.5 % of price per week capped at 10 % if commissioning drifts beyond agreed ready-for-production date. Secure 8-year obsolescence notice; discontinuation gives customer last-time-buy option at cost +15 %.
Final Commissioning & Handover
Commission in three phased gates: mechanical completion → dry running → product validation. Demand IQ/OQ documentation in editable format; vendor provides FAT/SAT deviation log with CAPA closed before handover. Embed remote-access kill-switch if support contract lapses >90 days. Close project with spare-part consignment stock worth 2 % of machine price on customer premises, replenished monthly; ownership transfers only upon consumption, cutting working-capital drag by 30–40 %.
Execute this checklist to compress sourcing cycle to 14–16 weeks while limiting budget variance to <3 % and technical risk to <1 % OEE loss versus stated business case.
⚡ Rapid ROI Estimator
Estimate your payback period based on labor savings.
Estimated Payback: —