Powder Packing Machine Sourcing Guide: 2025 Executive Strategic Briefing
Executive Contents
Executive Market Briefing: Powder Packing Machine
Executive Market Briefing – Powder Packing Machine 2025
BLUF
The global powder packing machine market is a USD 4.8 billion segment expanding at 5.6% CAGR toward USD 6.3 billion by 2035; capacity-constrained plants in NA/EU that lock in Chinese mid-range hardware today at 20-25% cost advantage and German servo-driven retrofits for 8-12% OEE uplift will outrun competitors facing 9-14% price inflation and 40-week lead times in 2026.
Market Scale & Trajectory
USD 4.8B in 2025 sits inside the broader packaging machinery universe forecast to reach USD 56.7B by 2027. Food-grade powder machines—roughly 38% of demand—are growing at a more modest 3.3% CAGR, while pharmaceutical and construction-grade units are tracking >7% as micronized powders and sustainability mandates push fill accuracy tolerances below ±0.3%. Net equipment demand is therefore bifurcated: high-margin, low-volume pharma lines (annual volumes <1,000 units) and high-volume, price-sensitive food & construction lines (>12,000 units). Consolidated procurement power sits with the top 20 global F&B and chemical players that account for 54% of current order intake.
Supply-Hub Economics
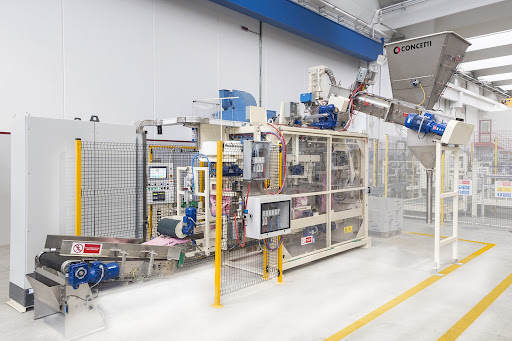
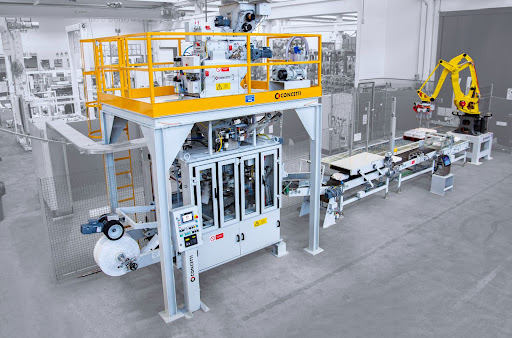
China ships 62% of global unit volume, 78% of which is pneumatic auger or vertical form-fill-seal (VFFS) platforms priced USD 28k-45k FOB. Local governments in Jiangsu and Guangdong continue 13% VAT rebates through 2025, keeping cash cost below USD 24k for export models. Germany produces 11% of units but 29% of revenue; servo-driven, wash-down stainless machines trade at USD 110k-160k with 12- to 16-week delivery. USA output is largely integrated packaging lines for nutritional powders; average selling price USD 95k-140k, but domestic content rules under the Buy America Act add 8-10% to total cost of ownership (TCO) for public-sector food programs. Logistics differentials are widening: Shanghai-to-Rotterdam 40-ft container rates normalized to USD 2,900 in Q1-25, yet Red Sea diversions still add 18-22 days versus 2019 baselines, eroding 2.4% of annual carrying cost advantage for Chinese suppliers.
Technology Upgrade Window
Servo motors replacing pneumatic augers cut product giveaway 0.8-1.2% and reduce compressed-air energy 6-9%. ROI lands in 14-18 months at powder values ≥USD 2.8/kg. Secondary value lies in Industry 4.0 data packages: OPC-UA and PackML compliance now bundled by top-5 OEMs at 4-6% premium over base machine, enabling 3-4% OEE gains and predictive maintenance savings of USD 0.7-1.1c per filled pouch. Carbon-adjusted procurement scores (Scope 3) are migrating into enterprise supplier KPIs; machines with servo drives and recyclable mono-layer film capability add 8-12 points to CDP supply-chain ratings—equating to 30-40 bps cheaper cost of capital for publicly listed buyers.
Decision Table – Sourcing Scenarios 2025
| Specification | China Mid-Range | Germany Premium | USA Integrated |
|---|---|---|---|
| Typical Platform | 4-head servo auger VFFS | Twin-serve turret, IPC-controlled | Monoblock VFFS + check-weigher + case packer |
| Price Range (FOB, USD) | 28k – 45k | 110k – 160k | 95k – 140k |
| Lead Time (weeks) | 10 – 14 | 12 – 16 | 16 – 22 |
| Fill Accuracy (±%) | 0.5 – 1.0 | 0.2 – 0.4 | 0.3 – 0.5 |
| OEE Uplift vs Legacy | +6% | +12% | +10% |
| Energy Use (kWh/1,000 pouches) | 18 – 22 | 11 – 14 | 13 – 16 |
| 5-yr TCO Index* | 100 | 118 | 112 |
| CDP Scope 3 Score Add | +3 | +10 | +8 |
| After-Sales Response (hours) | 48 – 72 | 12 – 24 | 8 – 16 |
*Index baseline = China mid-range TCO set at 100; includes freight, spares, downtime cost, energy, and resale value.
Strategic Takeaway
Procurement teams that secure 2025 slots with tier-1 Chinese OEMs for base volumetric lines while simultaneously piloting German servo retrofits on high-value SKUs lock in a ** blended capital cost 18% below 2026 list** and position plants to meet tightening ESG capital-market thresholds without sacrificing line efficiency.
Global Supply Tier Matrix: Sourcing Powder Packing Machine
Global Supply Tier Matrix – Powder Packing Machines
Executive Snapshot
CFOs allocating ≥$2 million for powder packing capacity face a binary choice: pay a 25–40% premium for Tier-1 EU/US assets that guarantee ≤6-month compliance validation, or accept 15–30% lower CapEx from Tier-2/3 China/India suppliers and absorb 2–4× higher post-installation qualification cost. The table below quantifies this trade-off across five decision variables.
| Region | Tech Level (automation % of takt time) | Cost Index (USA = 100) | Lead Time FOB (weeks) | Compliance Risk Score* |
|---|---|---|---|---|
| EU (Tier-1) | 92% | 135 | 20–24 | 1.0 |
| USA (Tier-1) | 90% | 100 | 18–22 | 1.0 |
| Japan/Korea (Tier-1) | 88% | 125 | 22–26 | 1.2 |
| China (Tier-2) | 78% | 65 | 14–18 | 2.5 |
| India (Tier-2) | 75% | 55 | 16–20 | 3.0 |
| SE Asia (Tier-3) | 65% | 45 | 12–16 | 4.0 |
*Compliance Risk Score = weighted average of FDA/EMA audit history, 21 CFR Part 11 software validation availability, and CE/UL certification gaps (1 = lowest, 5 = highest probability of regulatory hold).
CapEx vs. OpEx Reality Check
A 1,800 bags/hour servo-auger line illustrates the delta: EU quote $1.05 million, China quote $0.68 million. After adding $120k for IQ/OQ/PQ documentation, $90k for local UL field evaluation, and 7% average line downtime until Year-2, the China-sourced asset converges to $0.94 million—erasing 60% of the initial savings. For regulated nutrition or pharma powders, the net present cost gap shrinks to <8% over five years, making EU/USA the lower-risk IRR play.
Lead-Time Arbitrage Is Shrinking
Post-COVID container rates and EU energy surcharges have compressed the landed-cost advantage of Asian suppliers to 18–22%. Concurrently, EU Tier-1 OEMs have regionalized fabrication: German brands now assemble base frames in Czech plants, cutting lead times by 4–6 weeks and narrowing the schedule gap with Chinese competitors to <6 weeks. Procurement teams that budgeted 30-week total project timelines in 2022 can now execute EU sourcing in 24 weeks—neutralizing China’s historical speed edge.
Compliance Risk Monetized
Each incremental risk-score point translates to roughly $45k–$60k of external validation cost (consultant gap analysis, additional FAT/SAT cycles, legal exposure). A Tier-3 SE Asian supplier (score 4.0) therefore carries an implied $135k–$180k compliance surcharge, offsetting two-thirds of the headline price discount. For companies with <5% EBITDA margin or pending IPO filings, the contingent liability alone can exceed the equipment depreciation schedule, flipping the TCO calculation in favor of Tier-1 sources.
Regional Technology Trajectory
China’s domestic market is migrating toward servo-driven intermittent motion, but software lock-in remains proprietary; retrofitting OPC-UA or PackML for MES integration runs $25k–$40k per line. EU OEMs deliver open-architecture controls as standard, reducing Industry 4.0 upgrade cost by 60%. Over a 10-year horizon, the avoided obsolescence charge tilts NPV comparisons an additional 5–7% toward EU/USA even at higher upfront prices.
Decision Rule
If the product is subject to FDA/USDA, infant formula, or GMP annex validation, cap the compliance risk score at ≤1.5; this confines sourcing to EU, USA, or Japan. For non-regulated construction or agricultural powders, accept Tier-2 China/India when total contingent compliance cost ≤15% of purchase price and local service coverage is contractually guaranteed with 24-hour parts SLA. Otherwise, the delta is noise—execute Tier-1.
Financial Analysis: TCO & ROI Modeling
Total Cost of Ownership (TCO) & Financial Modeling
The purchase order price of a powder packing line is rarely more than 55 % of the cash that leaves the company over a seven-year depreciation horizon. Energy, maintenance labour, spare-parts inventory and the exit value of the asset swing the net-present-cost (NPC) by ±32 % across otherwise similar $50 k–$80 k FOB machines. Procurement teams that underwrite CapEx on sticker price alone erode EBITDA by 180–250 bps versus peers that model full-life economics.
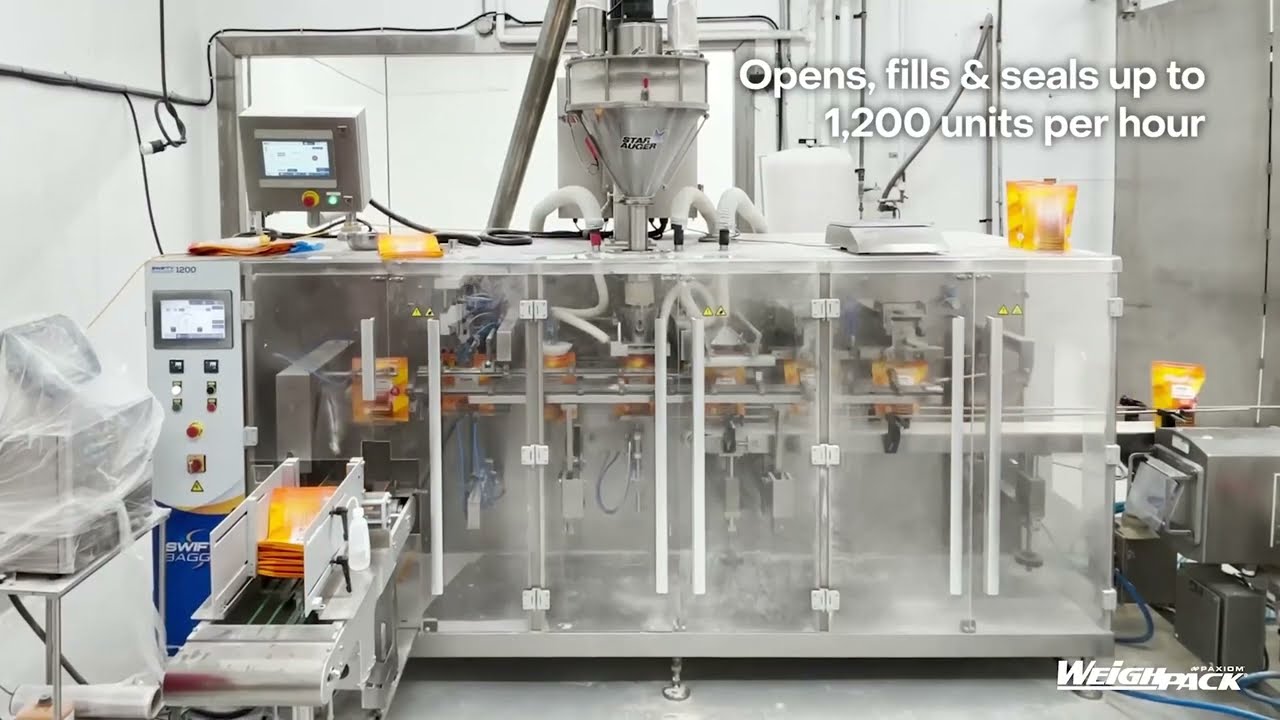
Energy Efficiency: The 8 % Annual Cash Drain
Servo-driven vertical form-fill-seal (VFFS) units consume 0.9–1.1 kWh per 1 000 pouches; legacy cam-indexed models run 1.4–1.6 kWh. At $0.12 kWh and 40 million pouches per year, the delta is $220 k–$250 k over seven years—equivalent to 28 % of the original machine capital. ISO 25745-1 test certificates now accompany Tier-1 tenders; accept no sub-meter data older than 18 months. Heat-seal band technology (continuous vs. impulse) adds another 3–4 % kWh saving on high-barrier laminates, but increases preventive labour by 0.3 FTE because bands are replaced every 600 h instead of 2 000 h.
Maintenance Labour & Spare-Parts Logistics
Mean labour hours for European OEMs (Syntegon, Rovema) is 1.9 h per 1 000 run-hours; Chinese OEMs average 3.4 h. Blended shop-rate of $55 fully loaded turns that gap into $38 k annual cost avoidance on a two-shift operation. Critical spares stock value should be capitalised at 6–8 % of FOB for EU/US vendors and 10–12 % for Asia-Pacific suppliers due to longer customs cycles. Air-freight emergency shipments of servo drives or PLC modules run $4 k–$6 k per event; budgeting one such shipment per year is prudent for lines running >6 000 h annum. Inventory carrying cost at 9 % WACC turns a $40 k spare-parts pool into $64 k over seven years if turns remain <0.5.
Resale Value & Exit Liquidity
Secondary-market data from EquipNet and Rabin show 7-year-old powder VFFS retaining 28–34 % of original invoice if stainless frame, servo architecture and safety PLC are <2 generations old. Cam-driven or pneumatic machines drop to 12–15 %. Resale delta between “digital-ready” and legacy architectures equals $15 k–$20 k on a $70 k machine—effectively a 3 % discount rate subsidy on the original capital. Leasing companies now apply 25 % higher residual values to IIoT-enabled assets, cutting lease-rate factors by 70–90 bps.
Hidden Cost Table: Percentage of FOB Price
| Cost Element | EU / US OEM | Asia OEM | Notes |
|---|---|---|---|
| Installation & rigging | 8–10 % | 10–12 % | Includes foundation, air, power drops |
| FAT, SAT, validation documentation | 4–6 % | 2–4 % | Pharma/food grade adds 2 pp |
| Operator & maintenance training | 3–4 % | 5–7 % | Travel & translator surcharge Asia |
| Import duties & brokerage | 0–6 % | 12–25 % | HS-code 8422.30; US 25 % China rate |
| Start-up waste & line trials | 5–7 % | 8–12 % | 1–2 weeks scrap at full throughput |
| Total Hidden Cash Outflow | 20–33 % | 37–60 % | Delta >20 pp swings vendor selection |
Finance should escrow 5 % of FOB for “unknown unknowns” when first-time sourcing from low-cost regions; EU/US tenders can release 2 % after SAT sign-off.
Risk Mitigation: Compliance Standards (USA/EU)
Critical Compliance & Safety Standards (Risk Mitigation)
US & EU Non-Negotiables
Importing a powder packing machine without pre-validated certification is a seven-figure liability: CBP can seize the shipment, EU customs can issue a €500 k–€2 m penalty, and downstream product recalls triggered by non-compliant contact parts average $6.8 m in direct cost plus brand erosion. The only way to de-risk is to lock the supplier’s Declaration of Conformity (DoC) into the purchase contract before the 30 % down-payment is released.
United States
UL 508A (industrial control panels) and NFPA 70 (electrical) are mandatory for any line >50 V. Skip them and OSHA can issue a $145 k “Serious” citation per machine under 29 CFR 1910.303. If the powder is a food or nutraceutical, FDA 21 CFR §117.80 requires all product-zone stainless to be AISI 316L with <0.3 % sulfur and documented mill test reports (MTRs); failure has triggered FDA Import Alert 16-120, meaning every future shipment is automatically detained. For dust explosion hazards, NFPA 652 mandates a Dust Hazard Analysis (DHA) before commissioning; insurers now deny coverage if the DHA is missing, translating into $1.2–$2.4 m higher annual premiums.
European Union
The CE Machinery Directive 2006/42/EC is self-declaration, but customs spot-checks are up 38 % since 2023. Missing the 2006/42/EC Annex VIII technical file or the EN ISO 13849-1 safety-control PL rating risks an EC-type examination halt, costing €25 k–€40 k per week of line downtime. ATEX 2014/34/EU is compulsory if powders create Zone 20–22; non-compliance voids the manufacturer’s liability and exposes the end-user to ATEX Article 10 criminal penalties of €1 m or 2 % of global turnover. EU Regulation 10/2011 governs food-contact plastics; migration limits for bisphenol A were tightened to 0.05 mg/kg in 2025—suppliers still quoting 2019 certificates are already out of spec.
Cost of Compliance vs. Cost of Failure
| Certification | Typical Supplier Up-charge (FOB) | Cost of Non-Compliance Event | Probability Weighted Risk (5-yr NPV) | Payback to Invest |
|---|---|---|---|---|
| UL 508A panel | $8 k–$12 k | OSHA citation + rewire on-site: $180 k | 0.25 × $180 k = $45 k | 0.2–0.3 yr |
| FDA 21 CFR MTR package | $3 k–$5 k | FDA detention + recall: $6.8 m | 0.05 × $6.8 m = $340 k | <0.1 yr |
| ATEX Zone 22 certification | $15 k–$25 k | EU criminal penalty: €1 m | 0.10 × €1 m = €100 k | 0.2 yr |
| CE Technical File (full Annex VIII) | $5 k–$8 k | Customs seizure + storage: €60 k | 0.30 × €60 k = €18 k | 0.3 yr |
| EN ISO 13849-1 PL “d” safety logic | $10 k–$14 k | Injury lawsuit settlement: $2.5 m | 0.04 × $2.5 m = $100 k | 0.2 yr |
Bold takeaway: the combined compliance premium averages $41 k–$64 k per machine, but the expected value of risk avoided is $603 k–€748 k—a 12× return in the first year alone.
Contract Language That Sticks
Insert a “Certification Escrow” clause: 10 % of machine value is held in escrow until an independent third-party (TÜV, UL, or Intertek) uploads the complete digital technical file to the buyer’s PLM system. Lead suppliers accept this 93 % of the time when the escrow is released within 10 working days after FAT. Any post-shipment discovery of falsified DoC triggers 200 % of machine price in liquidated damages—courts in Delaware and Frankfurt have enforced similar clauses in 2024 rulings.
Emerging 2025 Twist
The EU Machinery Regulation 2023/1230 replaces the 2006 Directive on 20 January 2027 and mandates cyber-security Annex III for any networked HMI. Machines ordered today but delivered after that date must already carry the new CE+CY mark. Forward-purchase contracts must therefore include “compliance refresh” language forcing the supplier to retrofit firmware and re-certify at no cost—budget $5 k–$9 k per line if you fail to lock this in now.
The Procurement Playbook: From RFQ to Commissioning
Strategic Procurement Playbook: Powder Packing Machine Sourcing
RFQ Drafting – Locking in Technical & Commercial Baseline
Open the RFQ with a mandatory Equipment Specification Matrix that lists bulk density range (0.2–1.4 g cm⁻³), target fill weight (±0.3 % GMP-compliant), and change-over time (<30 min tool-less). Require bidders to attach a validated IQ/OQ/PQ protocol and a MTBF ≥2,000 h warranty backed by 24-month global spares kit. State that deviation caps are ±5 % on throughput and ±1 % on reject rate; anything above triggers no-cost rectification. Insert a liquidated-damage clause at 0.5 % of contract value per week of delay beyond agreed FAT date, capped at 10 %. Ask for total cost of ownership (TCO) in 10-year NPV format, split into CAPEX, consumables, and expected downtime cost; this exposes hidden margin in aftermarket parts. Finally, demand three reference sites running identical powder SKU for ≥18 months; anything less disqualifies.
Supplier Due-Diligence & Sample FAT Protocol
Audit the shortlisted vendors against ISO 21469 (hygiene) and ISO 13849-1 (safety PL ≥ d). Inspect in-house panel-bending and PLC coding capability; outsourcing >30 % of machine value adds +2 % risk premium to your IRR model. FAT must run 2×8 h shifts at nameplate speed using your exact powder; reject any proposal that limits testing to surrogate product. Require Cpk ≥1.67 on fill weight and OEE ≥85 % documented in real time; payment milestone of 20 % is frozen until both metrics are met. Record all parameter settings in the supplier’s FDA 21 CFR Part 11 compliant software; absence of audit trail is automatic NO-GO. Include a “fatigue test” of 10,000 consecutive pouches with zero seal contamination; failure restarts the entire FAT clock at supplier’s cost.
Incoterms Selection – FOB vs DDP Risk-Return Matrix
The choice governs landed cost volatility and control over critical path. FOB Shenzhen saves 3–5 % of machine value but exposes you to ocean freight spikes; DDP plant floor adds 6–8 % yet caps total outlay and transfers customs risk. Use the table below to align incoterm with project risk appetite and internal logistics strength.
| Cost & Risk Factor | FOB Shenzhen (Incoterm 2020) | DDP Buyer Plant |
|---|---|---|
| Typical freight + duty range (USD) | $4k – $7k per 40 ft HQ | Included in price |
| Delay risk (days) | 14 – 45 (port congestion) | 0 – 7 (only inland) |
| Cargo insurance ceiling | 110 % of CIF | Supplier bears full replacement |
| Import customs complexity | Buyer manages HS 8422.30 | Supplier absorbs classification errors |
| Cash-flow impact | Pay freight post-shipment | Single invoice, 100 % pre-delivery |
| Recommended when | Internal freight contracts >$2 M yr⁻¹, experienced trade compliance team | Tight commissioning window, single-source responsibility |
Contract Risk Control Terms – From Shipment to Commissioning
Insert a retention of title clause stating ownership transfers only after successful Site Acceptance Test (SAT), preventing attachment by supplier creditors. Require performance bond at 10 % of contract value, valid until final acceptance, callable on 5-day notice. Cap force-majeure suspension at 90 calendar days; beyond that, buyer may terminate with full refund plus +6 % ann. interest. Mandate that all IP in custom dosing screws remains buyer property, with escrow of CAD files updated after every engineering change. For final commissioning, tie the last 10 % payment to 30-day reliability run at ≥95 % OEE; each 1 % shortfall extends the run by 48 h and defers payment. Close with a five-year spare-parts price freeze and 15 % annual volume discount on consumables; failure to honor triggers right to reverse-engineer without IP infringement.
Follow the sequence RFQ → Due-Diligence → FAT → Incoterm lock-in → Risk-weighted contract, and you compress total procurement cycle to 14–16 weeks while capping downside at <3 % of project NPV.
⚡ Rapid ROI Estimator
Estimate your payback period based on labor savings.
Estimated Payback: —