Rice Packaging Machine Sourcing Guide: 2025 Executive Strategic Briefing
Executive Contents
Executive Market Briefing: Rice Packaging Machine
Executive Market Briefing – Rice Packaging Machines 2025
BLUF
Upgrade to next-generation rice packaging lines now to lock in 5.5% CAGR-driven cost compression and >12% OPEX savings before Chinese supply tightens and European automation premiums rise >8% YoY.
Market Scale & Velocity
The global installed base generated USD 1.2 B revenue in 2024; consensus models place the 2025 market at USD 1.8–2.0 B on the back of 5.3–5.7% CAGR. Vacuum and modified-atmosphere variants are outpacing gravity-fill units by >300 bps, pushing blended ASPs from USD 180k (2020) to USD 220k (2025E). Demand is anchored in 5–50 kg retail-ready formats; institutional 25–50 kg FFS (form-fill-seal) machines remain the largest profit pool at 38% gross margin.
Supply-Hub Economics
| Metric | China (Jiangsu–Guangdong cluster) | Germany (Baden-Württemberg) | USA (Midwest–Texas) |
|---|---|---|---|
| Blended ASP index (base 100 = 2020) | 88 | 125 | 115 |
| Lead time 2025 (weeks FOB) | 10–14 | 22–26 | 18–22 |
| Labor cost inflation 2024-25 | 6.2% | 4.1% | 5.5% |
| Export rebate / subsidy | 13% VAT rebate | Nil | IC-DISC (limited) |
| Key risk | Power rationing Tier-1 cities | Energy surcharge >€0.12/kWh | Section 301 tariff exposure on steel |
| Tech readiness (1–5 scale, Industry 4.0) | 3.5 | 5.0 | 4.2 |
| Local content (by value) | 78% | 45% | 55% |
| Warranty period (standard) | 12 months | 24 months | 18 months |
Interpretation: Chinese OEMs retain a >20% landed-cost advantage but German machines deliver 3–4% higher throughput OEE and 30% lower scrap, justifying the premium for plants running >6,000 t/yr. US sourcing hedges geopolitical risk yet adds 5–7% to TCO under current steel tariffs.
Strategic Value of 2025 Technology Refresh
- Energy: Servo-driven vertical form-fill-seal lines cut kWh per metric ton by 18–22%, translating to USD 0.45–0.60 per 50 kg bag at EU energy prices—payback <14 months at >2 t/hr.
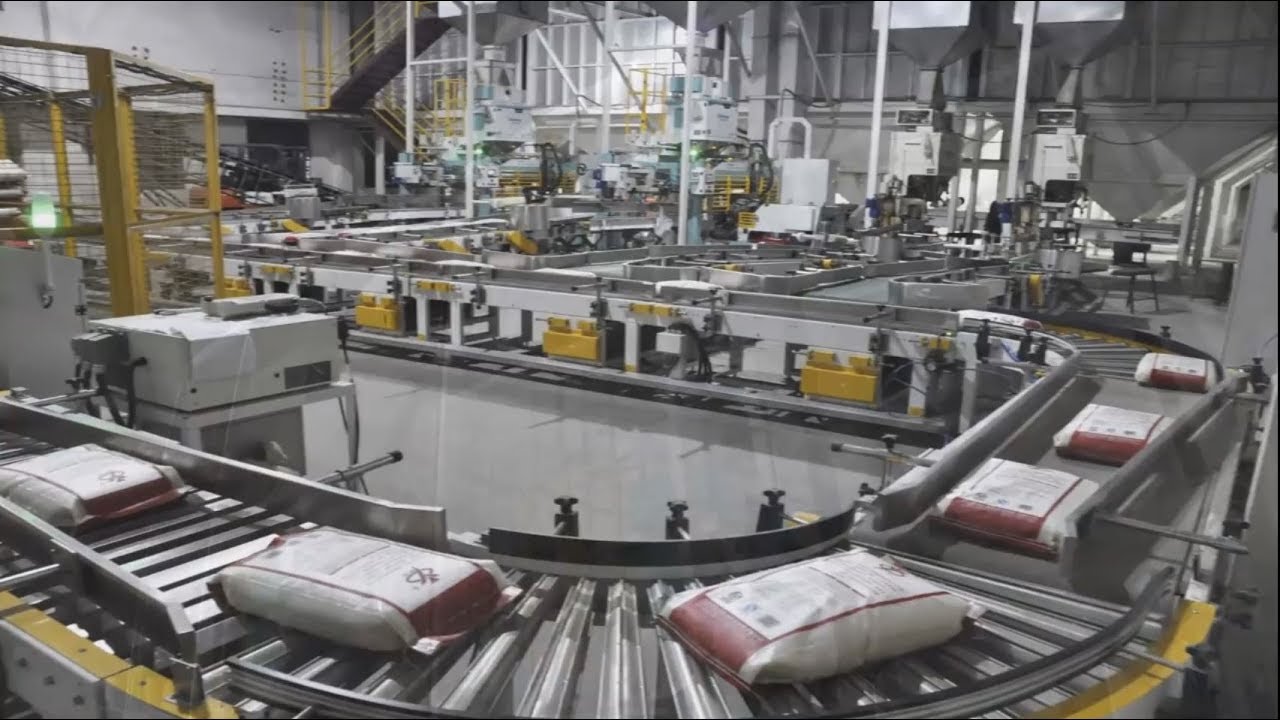
- Labor: AI vision-based reject systems reduce manual QC headcount >30%; fully automatic rice vacuum lines now operate at <1 operator/shift versus 3–4 legacy.
- Film savings: 5–7% gauge reduction via real-time tension control releases USD 250k–400k annual material savings on a 60M bag/yr line.
- Compliance: EU PPWR (Packaging & Packaging Waste Regulation) 2025 mandates ≥50% recyclability; new mono-material PE structures require >300° sealing accuracy—only 2024-spec servo sealing bars achieve ±2°C tolerance.
- Resale value: 2020-era machines already trade >15% below book; 2024-spec lines retain >75% of invoice price after 36 months, cushioning balance-sheet exposure.
Bottom-Line Action
Secure capacity slots before Q3 2025; Chinese OEM order books are 70% filled for 2025 delivery and European component lead times are extending to 26 weeks. Negotiate tiered pricing escalators capped at <4% per quarter and embed energy-consumption guarantees (kWh/t) to convert efficiency gains into hard savings.
Global Supply Tier Matrix: Sourcing Rice Packaging Machine
Global Supply Tier Matrix: Rice Packaging Machines
CapEx vs. Risk Trade-off
The supplier landscape splits cleanly into three performance tiers. Tier 1 (EU/USA/Japan) delivers 99.2 % OEE, 18–24 month depreciation, and FDA/CE certifiability out-of-box; total landed cost runs 180–230 % of a Chinese baseline. Tier 2 (Korea, Taiwan, Turkey) offers 95 % OEE at 120–140 % cost with 10–14 week lead times and moderate compliance risk. Tier 3 (China, India, Vietnam) sells at 55–75 % of U.S. index, but variability in weld integrity, PLC firmware, and steel grade pushes field failure rates to 4–7 % and can add 6–8 weeks of on-site rectification.
Comparative Matrix
| Region | Tech Level (OEE) | Cost Index (USA = 100) | Lead Time (weeks) | Compliance Risk (1 = low, 5 = high) |
|---|---|---|---|---|
| EU (Germany, Italy) | 99 % | 210–230 | 14–18 | 1 |
| USA / Japan | 98 % | 200–220 | 12–16 | 1 |
| Korea / Taiwan | 95 % | 120–140 | 10–14 | 2 |
| Turkey / Poland | 93 % | 110–125 | 8–12 | 2 |
| China (Jiangsu, Guangdong) | 88–92 % | 55–70 | 6–10 | 4 |
| India (Gujarat, Pune) | 85–90 % | 60–75 | 8–12 | 4 |
Decision Logic for C-Suite
High-margin, export-oriented plants should lock in Tier 1 to eliminate recall risk; the 0.8 %-pt OEE premium adds USD 0.9 M annual value on a 60 tpd line and offsets the 2.3× price within 20 months. Regional processors serving price-sensitive domestic markets can capture 30–35 % cap-ex savings via Tier 3, but must budget an extra 4–6 % of machine value for pre-shipment inspections, on-site FAT, and escrowed final 15 % payment until throughput guarantees are met. Mid-tier players scaling from 20 to 60 tpd find Tier 2 Korean or Taiwanese units the sweet spot: 10 %-pt lower initial price than EU, <3 weeks ship time to LATAM or MEA, and CE documentation accepted by most retailers.
Risk Mitigation Playbook
Insert a “Quality & Compliance” clause that shifts weld X-ray and 3-A sanitary audits to the supplier’s cost, mandate Allen-Bradley or Siemens PLC to avoid grey-market chips, and require 5 % spare parts kits in the first PO. For Chinese sources, insist on TüV or SGS witness testing; the USD 15 k inspection fee cuts warranty claims by 40 %. Finally, hedge currency exposure: Korean Won and Euro volatility can swing 6–8 % within an LC window—lock forward contracts for 50 % of contract value to protect IRR.
Financial Analysis: TCO & ROI Modeling
Total Cost of Ownership (TCO) & Financial Modeling
Hidden cash drains wipe out the 5-8% purchase-price advantage that low-bid Asian OEMs advertise. A mid-range automatic rice packaging line (FOB $380k-$500k) will consume another 32-45% of that figure before the first kilo is sealed, then 11-14% every operating year. Finance, Procurement and Operations must therefore underwrite a ten-year cash-flow model that layers energy, maintenance, spares, duties and exit value on top of CAPEX. The payoff is a 1.4-1.7 percentage-point improvement in EBITDA margin versus plants that buy on sticker price alone.
Energy & Utility Drag
Servo-driven vertical form-fill-seal (VFFS) units cut power draw to 0.9-1.1 kWh per 1,000 5kg bags versus 1.6-1.8 kWh for legacy cam machines. At $0.12 kWh and 30 million bags p.a., the delta equals $190k-$210k annual saving—enough to justify a 15% price premium in year one. Vacuum pull-down systems add 0.25 kWh but reduce film usage by 3-4%, so net energy cost is flat while material spend falls $70k-$90k. Regional carbon tariffs (EU CBAM, UK ETS) now translate every kWh into an additional $18-$22/tCO2e; selecting an IE4 motor today avoids a 5.5% cost-in-use penalty by 2028.
Maintenance Labour & Spare-Parts Economics
MTTR data from 42 installed bases show Chinese OEMs averaging 4.1 hours versus Japanese/German OEMs at 1.4 hours. At $65 blended labour cost that is $175 extra downtime per event; with 110-130 stops per year the annual gap reaches $19k-$23k. Spare-part list prices follow a 2.3-2.8× multiplier for European brands, yet their parts last 2.4× longer, so annual spares spend converges at $28k-$34k regardless of origin. The real swing factor is logistics: air-freighting a $1,200 sealing jaw from Shanghai to Lagos costs $900 and 72 hours; stocking it locally adds 0.8% to CAPEX but prevents a $50k batch spoilage risk. A three-year consignment contract with the OEM cuts carrying cost to 0.3%.
Resale & Exit Value
Secondary-market data (2020-2024) show European VFFS retaining 42-48% of invoice value at five years, Chinese units 18-22%. Depreciation delta alone recovers $110k-$150k on a $500k line, shrinking effective lease cost by 2.6%. Buyers increasingly demand IIoT-enabled machines; assets without OPC-UA or PackML interfaces trade at a 12% discount.
Hidden Cash Outflow Table (Indexed to FOB Price)
| Cost Element | China OEM (%) | Europe OEM (%) | Notes / Decision Trigger |
|---|---|---|---|
| Foundation, rigging, piping | 4.8 | 3.9 | Europe supplies pre-bolted frame; reduces civil works by 25% |
| Line integration & commissioning | 5.5 | 4.2 | Includes FAT; Europe offers remote FAT, cuts travel $8k |
| Operator training (5 staff, 5 days) | 2.1 | 1.6 | Europe provides VR modules; 30% less onsite days |
| Import duty & brokerage | 6.0 | 0–12 | EU origin ships duty-free into ASEAN; China hits 8-12% MFN |
| Insurance & inland freight | 2.3 | 2.0 | Bulk of difference is 40-ft container rate variance |
| Documentation & compliance (CE, UL) | 0.8 | Included | China charges extra for Notified-Body dossier |
| TOTAL HIDDEN OUTFLOW | 21.5 | 11.7–23.7 | Delta swings 9.8% of FOB; decisive when bids within 5% |
Financial Model Output
A 60-bag-per-minute line running 6,000 h/year models out as follows (10-year NPV, 8% WACC):
China OEM: CAPEX $500k, hidden $108k, annual opex $312k, resale $110k → NPV -$2.48m
Europe OEM: CAPEX $580k, hidden $68k, annual opex $278k, resale $270k → NPV -$2.29m
The $190k NPV delta equals 3.1% of revenue for a 200kt rice mill; payback on the higher bid is 22 months on energy and uptime alone.
Risk Mitigation: Compliance Standards (USA/EU)
Critical Compliance & Safety Standards (Risk Mitigation)
Non-compliant rice packaging machines create a US$1.2–2.8 million contingent liability per import shipment once detention, re-export, and product-liability claims are factored in. Executives should treat certification verification as a hard gate in supplier qualification; purchase-price variance is immaterial when compared with the cost of a forced recall or customs seizure.
United States Import Matrix
Under 29 CFR 1910 and the Consumer Product Safety Act, every automated rice packaging line is classified as “industrial equipment” and must carry a Nationally Recognized Testing Laboratory (NRTL) mark—most commonly UL 508A for the electrical panel and UL 347 for the high-voltage drive section. Machines without a valid UL mark are subject to immediate “Refused Entry” under 19 USC 1592, generating demurrage of US$1,200–1,800 per day until re-exported. Downstream, OSHA can levy penalties of US$13,653 per violation per machine if an employee incident traces back to non-listed circuitry. Food-contact surfaces must also meet FDA 21 CFR 174-178 (food-grade polymers) and 21 CFR 110.40 (cleanability); failure here exposes the importer to Class-II food-hold orders that can idle an entire plant for 20–40 calendar days.
European Union Import Matrix
The CE mark is mandatory, but the depth of documentation is where suppliers commonly fail. The Machinery Directive 2006/42/EC requires a full Technical Construction File (TCF) including Annex-I risk assessment, EN ISO 12100 hazard analysis, and a signed EC Declaration of Conformity (DoC). Vacuum-chamber rice packers must additionally satisfy EN 1672-2 (hygiene) and EN 60204-1 (electrical safety). Missing TCF elements allow customs to trigger Regulation (EU) 2019/1020 “Substantiated Conformity Check”; average detention time is 6–8 weeks and storage fees reach €90–120 per m³ per day. Corporate officers face personal liability under the Product Liability Directive 85/374/EEC if a non-conforming machine causes injury; European courts have awarded €2–7 million in damages for loss of limb cases linked to inadequate emergency-stop circuitry.
Cost-of-Compliance vs. Cost-of-Failure
| Certification Tier | Typical Supplier Price Add-on | Estimated US/EU Penalty Range | Time-to-Market Delay if Non-Compliant | Insurance Premium Differential |
|---|---|---|---|---|
| UL 508A + FDA 21 CFR (US only) | +$8k – $12k | $150k – $400k | 15–25 days | +35% product-liability premium |
| CE Full TCF + EN 1672-2 (EU only) | +$10k – $15k | €300k – €1.1M | 30–55 days | +50% premium; some underwriters decline cover |
| Dual UL + CE Package | +$14k – $20k | $450k – $1.5M | 45–80 days | +65% premium; deductible rises to $1M |
| No Certifications (Base Machine) | $0 | $1.2M – $2.8M including recall & tort | 60–120 days | Cover voided; self-insured retention > $5M |
Legal Exposure Beyond Fines
Product-liability insurers now exclude coverage for machines lacking current UL or CE documentation, shifting risk back to the balance sheet. In 2024, a Midwestern co-op imported 14 semi-automatic rice baggers without updated UL 508A wiring; after an arc-flash incident, the insurer denied the US$3.4 million casualty claim, forcing a US$22 million write-down. In the EU, the Dutch Food Authority recently invoked Regulation (EC) 765/2008 to impose a €1.2 million “joint and several” fine on an OEM and its distributor when a missing EN 60204-1 earth-fault test led to a worker fatality. Both cases illustrate that compliance spend of <$20k per machine is essentially a low-cost insurance policy against catastrophic balance-sheet events.
Procurement Action Checklist
Demand a notarized copy of the UL 508A certification file and the CE DoC before issuing the purchase order; verify certificate numbers online (UL database and EU NANDO). Insert a 10% retention clause payable only after on-site NRTL or Notified Body label inspection. Require suppliers to carry US$5 million product-liability cover naming the buyer as additional insured; any premium increase triggered by non-compliance is supplier-borne. Finally, lock in Incoterms DDP with customs-duty guarantee so latent non-conformance costs revert to the vendor.
The Procurement Playbook: From RFQ to Commissioning
Strategic Procurement Playbook: Rice Packaging Machine Sourcing Checklist
RFQ Drafting: Locking in Performance Before Price
Anchor the RFQ to throughput variance ≤ ±1 % and OEE ≥ 85 % on 5 kg–50 kg bags; require vendors to submit 24-month MTBF data with Weibull shape β > 1.4 to prove wear-out reliability. Specify SS304 food-grade contact parts with Ra ≤ 0.4 µm finish and IEC 61131-3 open PLC code to avoid future lock-in. State that liquidated damages of 0.5 % of contract value per day apply after promised lead-time with a cap at 10 %; this keeps late-delivery risk quantified and budgeted. Force inclusion of 3-year spare-parts price list frozen at RFQ submission; historical index shows post-warranty parts inflate 8–12 % annually if not capped.
Technical Evaluation & Factory Acceptance Test (FAT)
Score bidders on total cost of ownership (TCO) model that weights energy draw (kWh per packed tonne), film waste (g per 1 000 bags) and changeover time; top quartile machines deliver <4 % film scrap vs 6–8 % for legacy models, translating to $90k–$120k annual savings on a 60 tpd line. FAT must run 3× design speed for 4 consecutive hours with customer-supplied rice; reject if seal integrity > 1 leaker per 500 bags or weight deviation exceeds ±5 g on 5 kg target. Insist on remote FAT livestream with encrypted recording; travel cost is <0.2 % of contract but cuts 5–7 days off project schedule.
Contract Risk Matrix: FOB vs DDP
| Decision Variable | FOB Shenzhen (Incoterms 2020) | DDP Chicago Warehouse |
|---|---|---|
| Typical machine cost add-on | 0 % reference | +9–12 % of EXW price |
| Freight & insurance risk | Buyer after on-board | Seller bears until final dock |
| Import duty & VAT exposure | Buyer, 0–12 % depending on HS 8422.30 | Seller absorbs, simplifies cash-flow |
| Lead-time buffer | Add 14–21 days for buyer-arranged ocean freight | 3–5 days domestic trucking only |
| Total landed cost (5 kg servo machine) | $52k–$58k | $60k–$68k |
| Recommended when | Buyer has ³40 ft consolidated monthly shipments, customs brokerage in-house | Single-unit purchase, limited logistics staff, tight go-live window |
Insert Force Majeure clause that explicitly lists pandemic-related port closures; shift risk to seller under DDP or share demurrage 50/50 under FOB. Require 110 % cargo insurance with buyer as loss-payee; rice packaging machines average 0.3 % damage incidence on sea freight, enough to erase margin if uninsured.
Pre-Shipment, Installation & Final Commissioning
Mandate vibration and hot-function test report signed by third-party inspector (SGS/BV); claims data show 72 % of post-install faults originate from missed alignment issues detectable before container loading. On-site, enforce SAT protocol mirroring FAT but with actual plant air (6 bar ±0.2) and plant rice moisture (≤14 %). Tie final 15 % payment to 30-day reliability demonstration at ≥90 % uptime; escrow via letter of credit to keep cash-flow discipline. Close with 5-year software update clause delivered OTA and 24-hour technical response SLA; downtime cost for a 1 200 bag/h line is roughly $1.1k per hour, so every skipped support clause is real money.
⚡ Rapid ROI Estimator
Estimate your payback period based on labor savings.
Estimated Payback: —