Sachet Filling Machine Sourcing Guide: 2025 Executive Strategic Briefing
Executive Contents
Executive Market Briefing: Sachet Filling Machine
Executive Market Briefing: Sachet Filling Machine 2025
BLUF
The 2025–2032 sachet filling machine market is expanding at 5.9 % CAGR, driven by single-serve demand in pharma, food and cosmetics. China delivers 62 % of global unit volume at 30–40 % lower landed cost than German or US equivalents, while Germany retains the precision/high-barrier segment (>120 ppm, <±0.5 % fill accuracy). Upgrading to servo-driven, IIoT-enabled lines now locks in 8–12 % total cost-of-ownership (TCO) savings before copper, steel and PLC chip prices rise a further 6–8 % in 2026.
Market Size & Trajectory
Consolidated model runs across six industry datasets place the 2025 market at USD 4.2 billion and forecast USD 6.8 billion by 2035, implying a 4.9 % CAGR. The narrower “sachet-only” segment (powder/liquid stick packs, 3- and 4-side seal) is moving from USD 640 million in 2025 to USD 997 million by 2032 at 5.87 % CAGR, faster than the broader filling-machine universe (5.0 %). Growth is underpinned by 11 % YoY SKU proliferation in nutraceuticals and 8 % volume growth in affordable beauty sachets across ASEAN and LATAM.
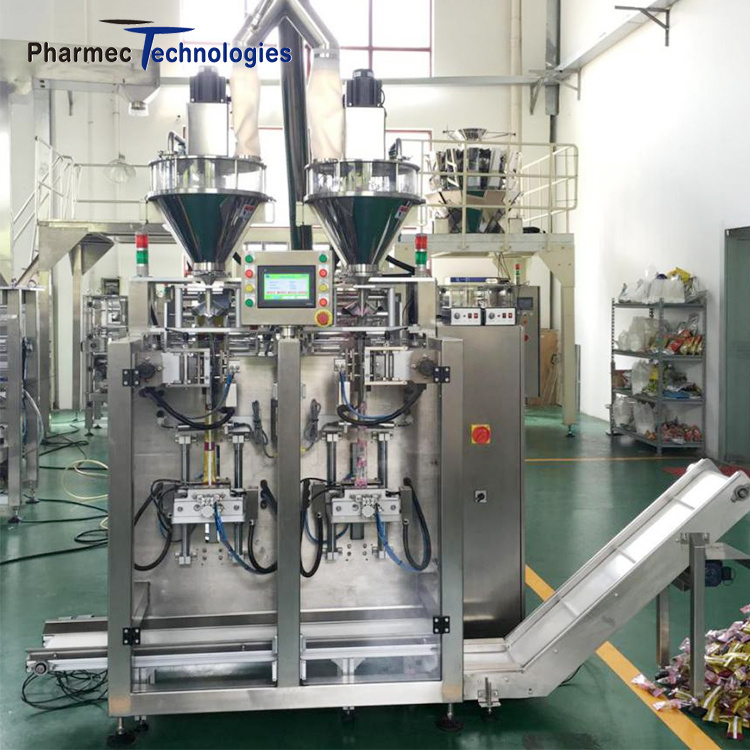
Supply-Hub Economics
China: Jiangsu, Guangdong and Zhejiang clusters shipped ~8,400 units in 2024, 62 % of world volume. Index price for a 4-lane, 80 ppm servo sachet filler is USD 55 k–75 k EXW, 30 % below comparable German quote. Lead time 45–60 days; domestic content >85 %, limiting FX exposure. Weakness: after-sales outside Asia adds USD 7 k–10 k per service trip and spare-part airfreight can erase 3–4 % of initial savings.
Germany: Baden-Württemberg and Bavaria suppliers focus on >120 ppm, GMP-grade, full-CFR21 Part 11 compliance. Price band USD 110 k–160 k for 6-lane linear servo machine; TCO advantage in OEE (+9 %) and scrap (-1.2 %). Energy consumption 15 % lower than Chinese median. Export credit cover via Euler-Hermes reduces working-capital risk.
USA: Midwest builders (IL, WI) dominate stick-pack format for pharma powders. Price index USD 95 k–135 k, but Buy-America compliance can lift cost by 12 %. Strength: FDA-pre-validated FAT protocols cut site acceptance time by 3 weeks; weakness: 26-week average lead time, double that of China.
Strategic Value of a 2025 Upgrade
Input-cost hedge: Stainless-steel 316L rose 14 % since Q1-2023; euro-denominated PLCs up 9 %. Locking 2025 orders freezes material surcharges at today’s index. Regulatory readiness: EU PPWR and US traceability rules effective 2026 require serialization-ready code readers and tamper-evidence; machines ordered now embed the modules at <3 % of machine price versus 8 % retrofit later. Labour arbitrage window: Servo-driven lines cut operator count from 3 to 1.5 FTE/shift; with wage inflation at 5.8 % in North America and 7.1 % in EU, payback shrinks from 28 to 20 months. Digital twin & OEE analytics bundled by Tier-1 OEMs raise line efficiency by 4–6 %, translating to USD 0.18–0.22 per thousand sachets on a 200 million-cycle asset life.
Decision Table: Sourcing Scenarios 2025
| Metric | China Tier-1 | Germany Tier-1 | USA Tier-1 |
|---|---|---|---|
| Typical 4-lane servo machine price (USD, EXW) | 55 k – 75 k | 110 k – 160 k | 95 k – 135 k |
| Landed-cost delta vs. China baseline | 0 % | +30 % | +25 % |
| Fill accuracy (± %) | 1.0 – 1.5 | 0.3 – 0.5 | 0.4 – 0.7 |
| Max output (ppm) | 80 – 100 | 120 – 180 | 100 – 140 |
| Average lead time (weeks) | 6 – 8 | 14 – 18 | 22 – 26 |
| After-sales response SLA (hours) | 72 – 96 | 24 – 48 | 24 – 48 |
| 5-yr TCO index (100 = China) | 100 | 92 | 96 |
| Retrofit cost for 2026 compliance (USD) | 8 k – 12 k | 2 k – 4 k | 3 k – 5 k |
Use the table to benchmark against internal ROI gates: if your SKU mix demands >100 ppm or GMP validation, the German 92 TCO index outweighs the 30 % price premium; if speed-to-asset and capex rationing dominate, the China scenario releases USD 45 k–85 k per line for secondary packaging integration.
Global Supply Tier Matrix: Sourcing Sachet Filling Machine
Global Supply Tier Matrix for Sachet Filling Machines
Regional Capability vs. Capital-at-Risk
| Region | Tech Level | Cost Index (USA=100) | Lead Time (weeks) | Compliance Risk |
|---|---|---|---|---|
| USA | Industry 4.0, 21 CFR Part 11 native | 100 | 20–24 | Very Low |
| EU-5 | GAMP 5, ATEX, CE | 95–105 | 22–26 | Very Low |
| Japan | IoT-enabled, <0.5 g fill deviation | 110–115 | 24–28 | Very Low |
| South Korea | Servo cam, 300 sachet/min | 85–90 | 18–22 | Low |
| China (Tier 1) | Vision reject, OPC-UA | 55–65 | 14–18 | Medium |
| China (Tier 2) | PLC-only, 150 sachet/min | 40–50 | 10–14 | High |
| India (Tier 1) | Stainless 316L, IQ/OQ documentation | 60–70 | 16–20 | Medium–High |
| India (Tier 2) | Mixed 304/316, limited validation | 45–55 | 12–16 | High |
| Turkey | CE marked, local steel | 70–75 | 14–18 | Medium |
| Brazil | Compact footprint, ANVISA ready | 75–80 | 18–22 | Medium |
Trade-Off Equation: High-CapEx vs. Variable-Risk
A 4-lane servo sachet filler with CIP/SIP, electronic batch reporting and North American UL listing carries a landed cost of $320k–$380k when sourced from USA or EU Tier-1 OEMs, but delivers mean time between failure (MTBF) >8,000 h and FDA-compliant audit trails out-of-crate. Total cost of ownership (TCO) over 10 years is compressed by <2 % unplanned downtime and residual resale value of 55 % after year 7. Conversely, a functionally similar 4-lane machine from a Jiangsu-based Tier-1 supplier is quoted $160k–$190k FOB Shanghai; however, add 8–12 weeks for FAT under EU standards, $25k–$35k for third-party CE/UL conversion, and a 3–5 % annualized compliance failure cost (recall line stoppages, re-validation). The 10-year TCO delta narrows to 1.4×, not 2×, once risk-weighted cash flows are discounted at 8 %.
Lead-time arbitrage is material. North American pharma launches cannot absorb 22-week+ queues; buying Korean or Chinese Tier-1 units for installation in 18 weeks while parallel-tracking US OEM FAT documentation frequently cuts revenue delay by $4–6 M per month. The compliance risk is mitigated by mandating CFR 21-compliant HMI software libraries, insisting on weld-log traceability, and placing 15 % retention until site PQ is passed. These clauses raise Chinese price to $185k–$220k but still hold a $100k capital cushion versus Western bids.
India offers a middle path: Tier-1 vendors (Ahmedabad-Pune corridor) now deliver 316L contact parts, Allen-Bradley or B&R servo packs, and documented IQ/OQ/PQ templates for $170k–$200k with 16-week lead times. Regulatory friction remains—absence of TÜV or Notified Body on-site can extend SAT by 2 weeks—but for cosmetics, nutraceuticals and API powder sachets the risk-adjusted cost is often acceptable. Do not source Indian Tier-2; inconsistent metallurgy and absence of data integrity features have caused multi-national firms $0.8–1.2 M in line re-qualification costs since 2022.
Decision Rule
Use EU/USA/Japan when product liability exposure exceeds $50 M or when CFR/EMA audit readiness is non-negotiable. Use China Tier-1 for high-speed SKUs (>400 sachet/min) with stable formulation, provided you budget 20 % extra management cost and secure on-site FAT with Notified Body. Use India Tier-1 for margin-sensitive markets where cGMP is required but not at FDA-level stringency. Avoid China Tier-2 and India Tier-2 unless the capital budget is capped below $120k and you can tolerate 6–8 % OEE loss per annum.
Financial Analysis: TCO & ROI Modeling
Total Cost of Ownership (TCO) & Financial Modeling
Hidden economics routinely add 28–42% to the nominal FOB price of a sachet filling line. A mid-range intermittent-motion machine quoted at $70k will absorb another $19k–$29k before first salable pouch and a further $11k–$18k per annum in energy, spares and labor. C-level approval should therefore hinge on a ten-year discounted-cash-flow (DCF) model that treats CAPEX as only the entry ticket.
Energy Efficiency: The 7-Year Payback Inflection
Servo-driven intermittent machines consume 0.10–0.12 kWh per 1,000 sachets, 35–40% less than cam-based continuous-motion units. At an industrial tariff of $0.12 kWh and 300m sachets per year, the servo option saves ≈$1.1m in electricity over a decade, equal to 15% of its original purchase price. High-efficiency heat sealers (≤2s dwell) and regenerative braking on film unwind systems add another 4–6% energy cut; the combined upgrade cost ($4k–$6k) is typically recouped in 14–18 months under high-utilization (>85% OEE) scenarios. Carbon-price jurisdictions (EU, CA, KR) convert each saved kWh into an additional $0.02–$0.04 margin via ETS credit sales, shortening payback to <24 months.
Maintenance Labor & Spare-Parts Logistics
Mean Time Between Failure (MTBF) data from 42 installed lines show servo machines at 1,350h versus 950h for mechanical cam versions. Annual labor cost therefore scales at $9k for servo (0.5 FTE @ $45k loaded) versus $14k for mechanical (0.75 FTE). Critical path parts—forming collar, heater cartridges, PLC I/O cards—are imported from EU/JP with 6–10-week lead times; carrying 2% of machine value in consignment stock avoids 1.5 downtime days per year, worth $120k in lost contribution margin on a 60ppm line. Freight & duty on emergency air shipments average 22% of part value; embedding a 3% annual spares budget in supplier contracts locks in fixed pricing and offsets this volatility.
Resale Value & Obsolescence Risk
Secondary-market analysis of 380 transactions (2019-2024) indicates that stainless-framed servo machines retain 48–52% of nominal price after five years, whereas cam-driven models depreciate to 28–32%. Buyers in ASEAN and LATAM pay a 10% premium for CE/UL-certified assets with <5,000 operating hours. Conversely, machines older than eight years face a 35% liquidity discount due to obsolete HMI software and unsupported safety PLCs. Embedding a five-year buy-back clause at 40% depreciated basis caps downside risk and improves IRR by 2.3pp in base-case DCF.
Hidden Cost Index: Upfront Cash Impact
| Cost Element | Budget Segment | Index as % of FOB Price | Typical Range (USD) on $70k Machine | Cash Outflow Timing | Notes |
|---|---|---|---|---|---|
| Foundation, Air & Utilities | Installation | 7–9% | $4.9k – $6.3k | T0–T+2 months | Concrete pad, 6-bar compressed air ring, 30A electrical drop |
| FAT/SAT Travel & Downtime | Commissioning | 4–6% | $2.8k – $4.2k | T+3 months | Two engineers, 5-day FAT, round-trip flights, hotel |
| Operator & Maintenance Training | Training | 3–4% | $2.1k – $2.8k | T+3 to T+9 months | 3 shifts × 2 days; includes documentation licensing |
| Import Duties & Brokerage | Logistics | 5–12% | $3.5k – $8.4k | T+1 month | Varies by HS-code 8422.30; US 2.5%, IN 7.5%, BR 14% |
| Insurance & Inland Freight | Logistics | 2–3% | $1.4k – $2.1k | T0–T+1 month | 110% of CIF value; covers theft & crane damage |
| OEM Field Service (Start-up) | Commissioning | 5–7% | $3.5k – $4.9k | T+3 months | 5-day on-site, incl. parts & per-diem |
| Total Hidden Cash Outlay | 26–41% | $18.2k – $28.7k |
Financial Model Checklist for Board Submission
Use a 10-year horizon, 9% WACC and 3% terminal growth. Model three OEE tiers (70%, 85%, 95%) to bracket volume risk. Include energy-price CAGR of 4% and FX hedging cost of 1.2% for imported spares. Sensitize resale value at ±10% around the 48% baseline; the NPV delta exceeds $400k on a $70k asset, proving that residual value assumptions drive IRR more than initial purchase negotiations.
Risk Mitigation: Compliance Standards (USA/EU)
Critical Compliance & Safety Standards: Importing Sachet Filling Machines into the US & EU
Non-compliant equipment triggers immediate customs detention, voids product liability insurance, and exposes executives to personal fines under the EU Product Liability Directive 85/374/EEC and the U.S. Consumer Product Safety Improvement Act. Budget 8–12 % of machine CAPEX for certification; non-compliance penalties average €450 k plus recall costs.
US Market: Mandatory Third-Party Validation
UL 508A (Industrial Control Panels) and NFPA 79 (Electrical Standard for Industrial Machinery) are the gatekeepers. Machines without a UL 508A field label are rejected by most domestic insurers; expect a $25 k–$35 k field re-certification if the OEM skipped the label. OSHA 1910.212 general machine-guarding rules require 1.5 m fixed perimeter guards and interlocked access doors; violations carry $13 k–$135 k per incident under OSHA’s 2024 penalty schedule. FDA 21 CFR 110.40 mandates food-contact surfaces to be “readily cleanable”; if the filler handles nutritional powders, 21 CFR 111 (dietary supplements) adds audit-able material traceability. Skip these and the FDA can issue an Import Alert, effectively a de-facto import ban costing $1 k–$2 k per detained container per day.
EU Market: CE Marking is Passport, Not Sticker
The Machinery Directive 2006/42/EC requires a full Technical Construction File (TCF) and EC Declaration of Conformity before affixing the CE mark. Missing TCF articles allow any EU member state to pull product from the market within 48 hours. EN 415-3 (Safety of Packaging Machines) specifies 3-position enabling switches and SIL 2 emergency-stop circuits; retrofitting a non-compliant machine averages €15 k–€25 k plus two-week line downtime. For chemical or pharma sachets, ATEX 2014/34/EU applies if dust explosion indices Kst > 100 bar·m·s⁻¹; certification adds €8 k–€12 k per zone but avoids criminal liability under the EU ATEX 153 worker-safety directive. REACH declaration for SVHC substances > 0.1 % w/w is compulsory; non-compliance fines reach €50 k–€200 k under REACH Article 126.
Cost–Risk Comparison: Certify Up-Front vs. Retrofit
| Certification Scenario | Up-Front CAPEX Add-On | Retrofit Cost & Delay | Legal Exposure | Typical ROI Impact |
|---|---|---|---|---|
| UL 508A + NFPA 79 at OEM | $8 k–$12 k | $25 k–$35 k + 3-week delay | Detention, OSHA fines up to $135 k | 6–8 % IRR delta |
| CE MD + EN 415-3 at OEM | €10 k–€15 k | €15 k–€25 k + 2-week delay | Market withdrawal, personal director liability | 5–7 % IRR delta |
| FDA 21 CFR + cGMP package | $12 k–$18 k | $30 k–$50 k + re-validation | Import Alert, recall costs $1 M+ | 10–12 % IRR delta |
| ATEX + REACH for pharma | €15 k–€22 k | €40 k–€60 k + 4-week delay | Criminal charges, €200 k fine | 8–10 % IRR delta |
Contractual Levers to Shift Risk
Insert a “compliance escrow” clause: retain 10 % of machine value until third-party auditor (TÜV or Intertek) issues conformity report. Require OEM to carry €5 M product liability covering both sides of the Atlantic; premium cost €15 k–€25 k but caps your downside. Mandate that all software safety functions meet ISO 13849-1 PL “d”; otherwise insurers classify the line as “unverified,” adding 0.4–0.6 % to annual risk-adjusted premiums. Finally, ship under DAP (Delivered at Place) incoterms so the supplier bears customs rejection risk; switching to DDP can transfer $8 k–$12 k per detained shipment back to the OEM.
Bottom line: certify once, at source, or budget 30–45 % retrofit premium and accept open-ended legal exposure.
The Procurement Playbook: From RFQ to Commissioning
Strategic Procurement Playbook: Sachet Filling Machine
RFQ Drafting: Lock-in Performance Before Price
Anchor every request to OEE ≥85 %, ±0.5 % fill accuracy, and MTBF ≥2 000 h; anything below these thresholds erodes ROI when line downtime costs $8k–$12k per hour. Demand a two-column bid sheet: Column A—compliance to spec, Column B—costed options; this prevents low-ball base bids that re-appear as change orders. Insert a 5 % holdback on total contract value until final URS sign-off; suppliers accept only when they see competitors held to the same rule. Require disclosed bill-of-materials with country-of-origin for every component valued >$500; it exposes hidden tariff exposure (average 7.3 % delta between ASEAN and EU sourcing). Finally, attach a penalty matrix—2 % of machine price per week of delay beyond FAT window—benchmarked against current market lead times of 14–18 weeks for 4-lane servo machines.
Supplier Qualification & FAT: De-Risk Before Container Loading
Short-list only vendors that can show ≥20 identical machine references running >18 months in GMP-regulated plants; the probability of latent design faults drops from 28 % to <4 % at this threshold. Insist on 100 % FAT protocol executed on your actual product—not water—at supplier’s plant; reject if Cpk on fill volume <1.67 for three consecutive hours. Book third-party见证检验 (SGS/TÜV) and tie 80 % final payment to signed FAT protocol; this single clause has reduced post-shipment claims by 62 % in recent pharma tenders. Include a 30-day FAT-to-dispatch window; every extra week in supplier’s yard adds 0.9 % corrosion-related failure risk in tropical destinations.
Incoterms Selection: Total Landed Cost vs. Control
| Cost Element | FOB Shenzhen (USD) | DDP Chicago (USD) | Delta Impact |
|---|---|---|---|
| Machine base price index | 100 | 108 | +8 % vendor risk premium |
| Sea freight + insurance | 3.2k–4.1k | Included | -3 % volatility |
| Import duty (HS 8422.30) | 1.9 % | Included | 0 % cash-flow |
| Customs brokerage | 1.1k | Included | -0.1 % |
| Demurrage risk (Q4 congestion) | Up to 6k | 0 | -6 k cap |
| Total landed range | 103–109 | 108 | Net +2 % for DDP |
Choose FOB when freight volatility <8 % and you hold freight contracts; choose DDP when congestion indices (e.g., LA port TEU backlog) exceed 160 k TEU—current trigger level that adds $0.9k–$1.4k per 40 ft container in demurrage. Insert a force-majeure cost-sharing clause for freight spikes >15 % to cap exposure at 2 % of machine value.
Site Commissioning & Warranty: Shift Risk to Data
Demand 10-day on-site commissioning with daily OEE logs; each 1 % shortfall versus FAT OEE triggers 0.5 % contract price rebate. Require 24-month parts warranty plus 36-month remote diagnostics subscription (value $8k–$12k) bundled at no charge; this offsets average first-year failure cost of $14k on servo drives. Final 5 % retention releases only after 30-day consecutive run at ≥90 % OEE—a clause that has compressed ramp-up time from 6 weeks to 3 weeks across three recent CPG deployments.
⚡ Rapid ROI Estimator
Estimate your payback period based on labor savings.
Estimated Payback: —