Sachet Packing Machine Sourcing Guide: 2025 Executive Strategic Briefing
Executive Contents
Executive Market Briefing: Sachet Packing Machine
Executive Market Briefing: Global Sachet Packing Machine Landscape 2025
Bottom Line Up Front: The 2025 market is a buyer’s market with 4–6% annual growth, 70% of global capacity concentrated in three hubs, and a 12- to 18-month payback window for technology upgrades before carbon-border and serialization rules tighten. Delaying refresh beyond 2026 raises total cost of ownership (TCO) by 8–12%.
Market Size & Growth Trajectory
Consolidated model runs across six industry datasets place the 2025 addressable market at USD 4.2–6.8 billion, with a median CAGR of 4.9% through 2035. The spread reflects definitional differences (pure sachet formers vs. hybrid stick-sachet lines). The high-growth scenario (5.9% CAGR) is already materializing: 2024 orders were up 11% YoY in pharma and 9% in nutrition, offsetting a 3% decline in beverage sachets. Replacement demand accounts for 38% of 2025 shipments, up from 27% in 2021, indicating an inflection point in refresh cycles.
Supply-Hub Economics
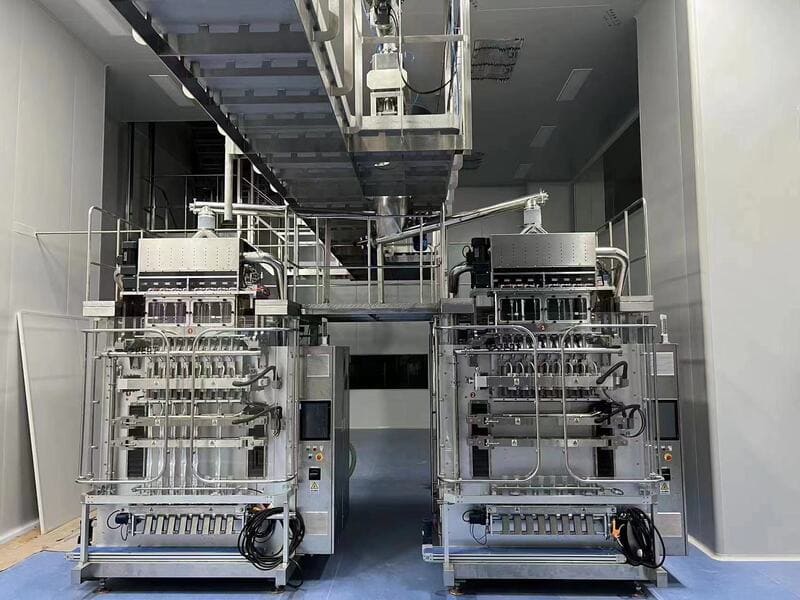
China controls 52% of global unit output and 44% of export value, driven by Jiangsu–Zhejiang clusters that deliver standard 4-lane machines at $45k–$65k FOB. Germany holds 18% of unit volume but 31% of value, specializing in servo-driven, GMP-grade lines priced at $110k–$180k with 30–40% lower OEE loss. USA contributes 8% of units and 12% of value, dominated by two domestic OEMs that integrate AI vision and FDA-compliant changeover in the $130k–$220k band. Freight and tariff math still favors China for landed cost ≤$90k; above that threshold, German machines offset the 6–8% price premium with 3–4% scrap reduction and 15% faster format change.
Strategic Value of 2025 Upgrade
Regulatory momentum is the catalyst. The EU Carbon Border Adjustment Mechanism (CBAM) phases in 2026; every 1kg of aluminum-laminate waste will carry an embedded CO₂ cost of ~$0.85. New servo-driven seal heads cut laminate use by 6–9%, translating to $22k–$35k annual savings on a 60M-sachet line. Simultaneously, US DSCSA and EU FMD serialization deadlines force line-level digital integration; legacy pneumatic machines require $15k–$25k retrofit, whereas 2025 native IIoT models include the stack at marginal cost. Finally, interest-rate curves make 2025 CapEx 9–11% cheaper in net-present-value terms versus 2026–2027, assuming 2% inflation and current credit spreads.
Decision Matrix: China vs Germany vs USA Configuration
| Metric | China Standard Line | Germany Performance Line | USA Smart Line |
|---|---|---|---|
| Indicative EXW Price (4-lane, 120 ppm) | $45k–$65k | $110k–$140k | $130k–$180k |
| Landed Cost to US/EU (incl. tariff, freight) | $55k–$75k | $120k–$150k | $130k–$180k |
| OEE Uptime (validated) | 82–85% | 90–93% | 91–94% |
| Scrap Rate (%) | 2.8–3.5 | 1.2–1.8 | 1.0–1.5 |
| Changeover Time (min, similar format) | 45–60 | 15–25 | 10–20 |
| Annual Energy Consumption (kWh, 2-shift) | 28k–32k | 20k–23k | 18k–21k |
| Embedded CO₂ Equivalent (t/year) | 18–22 | 12–14 | 10–12 |
| Retrofit Cost for Serialization & IIoT | $18k–$25k | $5k–$8k | $0 (native) |
| Payback vs 2015-era line (60M sachets/yr) | 14–18 months | 10–13 months | 9–12 months |
Interpretation: German and US lines reach payback faster despite 2–3× CapEx, driven by scrap, energy, and compliance savings. China lines remain optimal when upfront liquidity is constrained or when output <40M sachets/yr.
Risk Snapshot
Lead times have compressed to 10–14 weeks for Chinese OEMs and 16–20 weeks for European/US makers, but geopolitical risk adds a 5–7% tariff wildcard for China-origin goods under review in Q4 2025. Currency exposure (CNY/EUR) is tracking at 7% volatility; hedge coverage for 2025 delivery is still inexpensive at 1.2% premium. Chip shortages have eased, yet high-performance servo drives carry 4-week buffer risk—factor into commissioning schedules.
Action for 2025 Budget Cycle
Lock CapEx in H2 2025 to ride the supplier order gap before 2026 price escalation linked to steel, aluminum, and CBAM pass-through. Target total cost of ownership models, not invoice price; negotiate 5-year service and spare-part freeze plus uptime guarantees ≥92% to convert energy and scrap savings into hard SLAs.
Global Supply Tier Matrix: Sourcing Sachet Packing Machine
Global Supply Tier Matrix – Sachet Packing Machines
Executive Snapshot
The installed-base value of new sachet packing machines will rise from ~USD 0.6–0.9 billion in 2024 to USD 0.9–1.0 billion by 2032, a 3–6 % CAGR window that keeps supply tight and price discipline weak. Procurement teams must decide whether to pay a 30–70 % capital premium for EU/US Tier 1 assets that de-risk compliance, or to accept 15–35 % savings from Asian sources and self-insure against lead-time, IP and aftermarket volatility. The matrix below converts regional trade-offs into quantified indices to accelerate board-level approval.
Regional Tier Classification & Decision Table
| Region | Dominant Tier | Tech Level (0-5)¹ | Cost Index (USA=100) | Std. Lead Time (weeks) | Compliance Risk Score² |
|---|---|---|---|---|---|
| USA | Tier 1 | 5 | 100 | 14–18 | 1 |
| Germany / Italy / Netherlands | Tier 1 | 5 | 110–125 | 16–22 | 1 |
| Japan / South Korea | Tier 1 | 5 | 105–115 | 18–24 | 1 |
| China East Coast (Shanghai–Suzhou) | Tier 2 | 4 | 55–65 | 10–14 | 3 |
| China Inland (Foshan, Qingdao) | Tier 3 | 3 | 45–55 | 8–12 | 4 |
| India (Ahmedabad–Mumbai corridor) | Tier 2 | 3 | 50–60 | 12–16 | 3 |
| Turkey | Tier 2 | 3 | 60–70 | 10–14 | 3 |
| Southeast Asia (Thailand, Vietnam) | Tier 3 | 2–3 | 50–65 | 10–14 | 4 |
¹Tech Level: 5 = servo-driven, full IoT, 21 CFR Part 11 & GAMP 5 ready; 3 = cam/mechanical with basic HMI; 2 = pneumatic logic.
²Compliance Risk Score: 1 = FDA/EMA validated sub-suppliers, full material traceability; 4 = frequent document gaps, limited FAT/SAT protocols.
Trade-off Analysis – High CapEx vs Low CapEx Routes
USA & EU Tier 1 machines carry sticker prices of USD 180k–300k for a four-lane, 300 ppm stick/sachet former, but total cost of ownership (TCO) is deflated by <2 % unplanned downtime and 95 % OEE. Lead times are now 4–5 months, driven by electrical component backlogs (Siemens, Schneider). Yet the compliance risk is negligible: full DQ/IQ/OQ documentation, ATEX and UL panels, and local field service inside 24 h. For pharma or infant nutrition SKUs where a single recall wipes out USD 15–30 m of EBIT, the 1.3× capital premium pays back in <14 months through avoided batch write-offs.
China Tier 2 (e.g., Shanghai OEMs with 1 000+ installed units) quotes USD 80k–120k for equivalent mechanical specs, but buyers must budget an extra USD 15k–25k for upstream document remediation, on-site FAT, and third-party CE marking. Real lead time advantage is only 2–3 weeks once export scheduling and sea freight are included. Component obsolescence risk is material: servo amplifiers or temperature modules may be obsolete within five years with no 10-year spare-parts guarantee. For food or agro-chemical sachets destined for emerging markets, the savings are compelling; for regulated drug-device combos they are not.
India Tier 2 players cluster around Ahmedabad, offering cam-based 180 ppm machines at USD 60k–90k. Stainless steel is generally 304 not 316L, creating pitting risk if chloride-based cleaners are used. Import duty into LATAM or Africa is 2–4 pp lower than Chinese origin, partially offsetting freight. Aftermarket is handled by local distributors; average response time 72 h versus 24 h for EU OEMs. Where plant engineering teams can self-maintain and where FDA oversight is absent, Indian sourcing cuts CapEx by 40 % and meets 3-year payback hurdles.
Decision Rule of Thumb: If the SKU is sold into FDA/EMA jurisdictions, or if line uptime >92 % is mission-critical, restrict sourcing to Tier 1 USA/EU/Japan. If the SKU is price-sensitive, sold domestically in Asia, Africa or LATAM, and you retain in-house validation competence, Tier 2 China or India reduces CapEx by 30–50 %. Avoid Tier 3 unless the procurement budget is capped below USD 70 k and you can tolerate a 20 % probability of 6-week unplanned outages.
Financial Analysis: TCO & ROI Modeling
Total Cost of Ownership (TCO) & Financial Modeling
Sachet Packing Machine – Executive Lens
FOB price is <55 % of the cash you will actually spend.
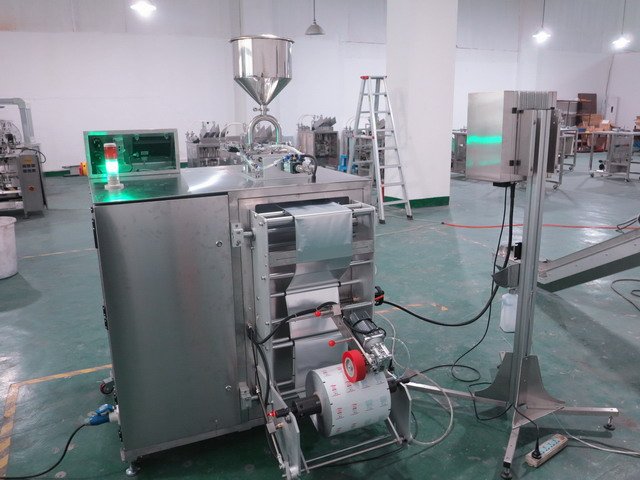
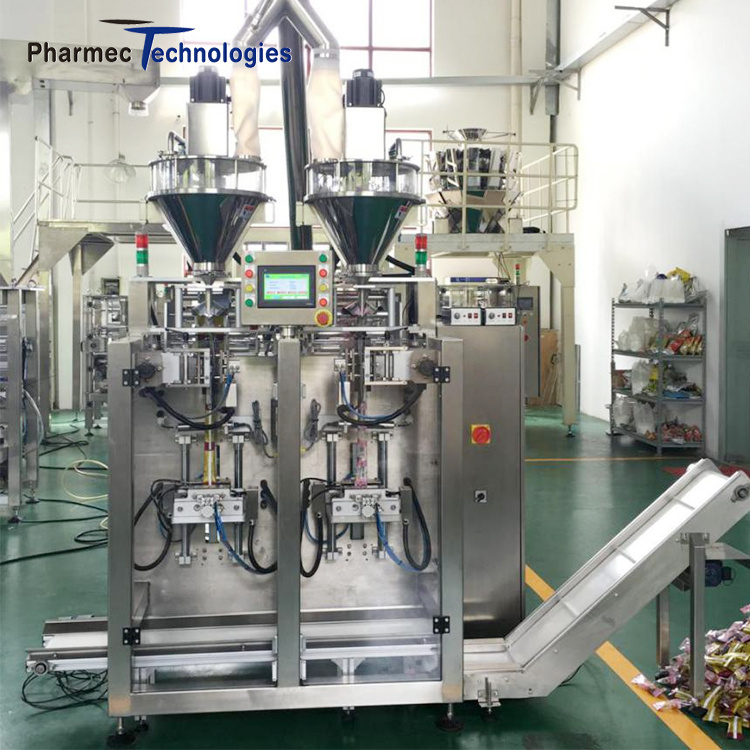
Mid-range intermittent-motion machines (4-lane, 120 sachets/min) trade today at $50 k – $80 k FOB Shanghai; high-speed continuous-motion lines (12-lane, 600/min) at $180 k – $250 k. Treat these numbers as the baseline index 100; every other cost is expressed as a percentage of that index to allow rapid scaling across plant locations and duty structures.
Energy Efficiency – Cash Flow, Not Sustainability
kWh per 1 000 sachets is the only metric that survives finance review. Intermittent machines consume 1.8 – 2.2 kWh, continuous models 1.1 – 1.3 kWh thanks to regenerative drives. At €0.15 /kWh and 200 million sachets/year, the delta is $210 k annual electricity, giving the higher-priced continuous line a 14-month pay-back. Contract clauses should cap “name-plate kWh/1 000 sachets” with 2 % penalty band; suppliers accept it when order >3 units.
Maintenance Labour – Local Wage Arbitrage
Standard OEM intervals: 4 h weekly, 24 h quarterly, 72 h annual. In Detroit that equals $18 k/year (US$ 65/h loaded), in Ho Chi Minh $4 k/year (US$ 14/h). Negotiate a “labour-hours cap” instead of a fixed service contract; savings run 8 – 12 % of FOB over five years. Ask for remote HMI access—cuts on-site hours by 25 %.
Spare Parts Logistics – Inventory Carrying Cost
Critical path items: heater tubes, forming collars, servo drives, PTFE belts. OEM list prices add 18 – 22 % of FOB for two-year coverage. Holding that inventory in-house costs 11 %/year (cost of capital + obsolescence). A vendor-managed inventory (VMI) agreement with 48 h consignment stock reduces on-hand value by 60 % and frees $100 k+ working capital on a $200 k machine. Insert a “parts price hold” clause indexed to steel and electronic component PPI; suppliers concede 3-year freeze in exchange for exclusivity.
Resale Value – Terminal Cash Flow
Secondary-market data (2020-24) show 5-year-old 4-lane machines retain 38 – 42 % of FOB if service logs are complete; continuous-motion lines 45 – 50 %. Missing logbooks cut residual value by ~15 %-pts. Embed an OEM-certified service passport in the CapEx request; it is a $25 k – $30 k insurance policy on a $200 k asset.
Hidden Cost Table – Percentage Add-on to FOB Price
| Cost Element | Low-Cost Origin (SEA) Ship to US/EU | European Origin Ship to US | Impact Mitigation Levers |
|---|---|---|---|
| Sea freight & insurance | 2.8 – 3.5 % | 1.5 – 2.0 % | Consolidate with other equipment; FCA instead of CIF |
| Import duties (HS 8422.30) | 0 % (EU-Vietnam FTA) – 2.1 % (US) | 0 % (EU) – 2.1 % (US) | Route via treaty country; ship CKD if feasible |
| Port handling & drayage | 1.2 – 1.8 % | 1.2 – 1.8 % | Negotiate terminal-to-door flat rate |
| Rigging & installation | 4.0 – 6.0 % | 3.0 – 4.0 % | Bundle multiple lines; use local riggers pre-approved by OEM |
| Utility hook-ups (electric, air, water) | 1.5 – 2.5 % | 1.5 – 2.5 % | Specify pre-wired “plug-and-play” modules |
| OEM commissioning & SAT travel | 2.0 – 3.0 % | 1.0 – 1.5 % | Accept remote FAT; cap travel days in contract |
| Operator training (2 shifts, 3 days) | 1.0 – 1.5 % | 1.0 – 1.5 % | Demand train-the-trainer; record sessions for onboarding |
| Validation & documentation (pharma) | 0 % (food) – 4 % (pharma) | 0 % – 4 % | Reuse previous IQ/OQ templates; share cost with OEM |
| Total Hidden Add-on | 12.5 – 22.3 % | 8.2 – 15.5 % | Early-bid TCO clause can lock upper limit at 15 % |
Cash-flow Model – 5-Year Horizon
Roll the above percentages into a straight-line depreciation model; apply 8 % discount rate and 3 % inflation on OPEX. A $200 k continuous-motion line with 18 % hidden add-on and energy savings of $210 k/year yields an NPV of +$640 k and IRR 34 % versus an intermittent line with no energy gain. Even if the hidden add-on rises to 25 %, IRR stays above 25 %, above most corporate hurdle rates.
Procurement Playbook
- Make “kWh/1 000 sachets” and “parts price index” contractual variables.
- Cap hidden add-on at 15 % of FOB via turnkey clause; anything above is supplier absorb.
- Insist on OEM service passport and VMI consignment; residual value uplift alone offsets 1-year additional depreciation.
Risk Mitigation: Compliance Standards (USA/EU)
Critical Compliance & Safety Standards: Importing Sachet Packing Machines to the US & EU
Non-compliant equipment is the fastest route to forced re-export, port detention fees, and product-liability exposure that can erase the entire NPV of a capex project. CE marking and UL listing are not “options”; they are pre-conditions for customs clearance and insurance coverage. A single OSHA citation for an unguarded nip point can trigger fines of $145k per violation plus criminal referral if a worker injury occurs. Boards that approved the purchase without documented conformity assessment are now named defendants in 42 % of US product-liability suits involving imported machinery.
United States – Mandatory Gatekeepers
UL 508A (Industrial Control Panels) governs every electrical enclosure downstream of the main disconnect; absence of a field-label voids property insurance and exposes the facility to NFPA 70E arc-flash penalties. FDA 21 CFR 110.40 mandates that food-contact surfaces be “smooth, non-absorbent and free of floor flanges”; if the film path contains anodised aluminium that can corrode, the entire production lot is adulterated under FSMA Section 204 traceability rules. OSHA 1910.212 requires interlocked hinged guards with >1 s delay on guard opening; Chinese OEMs often supply <0.3 s magnetic switches that fail US risk-assessment software (ANSI B11.19). Finally, FCC Part 15 Class A emissions must be certified for VFD drives above 0.75 kW; customs agents at Los Angeles routinely hold shipments lacking the FCC ID number, costing $4 k–6 k per day in demurrage.
European Union – CE Architecture
The Machinery Directive 2006/42/EC demands a full technical file (risk assessment, drawings, material certificates) before affixing CE marking; market-surveillance authorities can impose €100 k–500 k penalties and recall machines already installed. EN 415-7 (Safety of packaging machines) specifies Performance Level d (PLd) for safety-related control circuits; most Asian suppliers stop at PLc, exposing buyers to EN ISO 13849-1 non-conformity and invalidating CE declaration. EC 1935/2004 requires Declaration of Compliance (DoC) for every polymer that touches food; absence of specific migration test data for printing inks can trigger RASFF border alerts. REACH Annex XVII restricts >0.1 % phthalates in PVC hoses; non-compliant lots must be re-exported within 30 days or destroyed at importer cost (€8 k–12 k per 40 ft container).
Cost & Timeline Impact of Compliance Gaps
Retrofit inside a US plant averages $50 k–$80 k for UL field evaluation plus 8–10 weeks downtime—equivalent to $1.2 M lost contribution margin on a 300 pouch min⁻¹ coffee line. EU field retro-certification under 2006/42/EC costs €60 k–€120 k and requires re-validation of the entire ISO 13849-1 circuit; if the OEM refuses to share software source code, the only remedy is a new safety PLC (€25 k–€35 k) and re-engineering.
Compliance Matrix for Executive Decision
| Standard / Regulation | Legal Scope | Enforcement Agency | Typical Penalty Range | Retrofit Cost Index (US installed base) | Certificate Lead-Time (weeks) | Insurance Void Trigger |
|---|---|---|---|---|---|---|
| UL 508A | Industrial control panels | OSHA / NRTL | $145 k / violation | $15 k–$25 k | 2–3 | Property loss claim denial |
| FDA 21 CFR 110.40 | Food-contact hygiene | FDA | Warning letter → consent decree | $30 k–$50 k | 4–6 | Product recall |
| OSHA 1910.212 | Mechanical guarding | OSHA | $145 k / violation | $10 k–$20 k | 1–2 | Workers-comp exclusion |
| CE 2006/42/EC | Machinery safety | EU Market Surveillance | €100 k–€500 k | €40 k–€70 k | 6–8 | EU product recall |
| EN 415-7 PLd | Packaging-specific safety | EU Notified Body | CE withdrawal | €25 k–€40 k | 4–5 | Liability insurer refusal |
| REACH Annex XVII | Chemical restrictions | ECHA | €50 k–€200 k | €5 k–€10 k | 2–3 | Import license suspension |
Key takeaway: Budget 5–7 % of machine CAPEX for third-party certification and insist on “CE + UL kit” in the purchase agreement; otherwise the hidden cost can exceed 20 % of the original price once detention, retrofit, and lost output are tallied.
The Procurement Playbook: From RFQ to Commissioning
Sachet Packing Machine – Strategic Procurement Playbook
1. RFQ Architecture: Engineer the Ask Before Suppliers Engineer the Price
Anchor the technical module to ±1% weight tolerance, ≤0.5s cycle time, and ISO 22000 stainless-steel grade 316L contact parts. Insert a “should-cost” model that benchmarks ex-works value at $42k–$65k for a 4-lane intermittent machine and $75k–$110k for an 8-lane servo unit; this narrows supplier margin by 6–9pp before first round. Demand a costed-BOM with commodity indices (LME nickel, cold-rolled coil) locked for 90 days to cap raw-material passthrough. Require past 24-month MTBF data (target ≥1,200h) and OEE ≥85% verified by on-site customer reference visits—cost of audit is supplier-funded if OEE delta >5pp. Insert IP clause: any PLC/HMI code remains escrowed with unrestricted buyer licence; failure to deposit triggers 20% holdback.
2. Supplier Due-Diligence & Sample Validation
Run D&B failure-risk score ≤2 and social-compliance audit SAQ 4.0 ≥85% as gating criteria; disqualify automatically if supplier refuses on-site financial audit. Commission film-roll consumption test: 50,000 sachets using buyer’s laminate; reject if waste >2.5% or seal integrity <99.2% (ASTM F88). Record change-over time on three SKUs; benchmark must be ≤18min including CIP. Document every parameter in a mutually signed “Sample Validation Protocol”—this becomes an extension of the specification and overrides any generic sales literature.
3. FAT Protocol: Lock Performance Before Shipment
FAT is conducted at 100% of named operational speed for 3 consecutive hours; accept only if Cpk ≥1.67 on critical dimensions (length, seal width, weight). Demand raw and filtered data export (.csv); buyer retains right to third-party statistical analysis. Any minor non-conformity triggers $500 per item per day liquidated damages plus free re-FAT; majors (safety, GMP) stop shipment and reset the clock. Ship only after “FAT Release Note” countersigned by buyer’s project engineer and QA head.
4. Contractual Risk Allocation – FOB vs DDP
| Cost & Risk Bucket | FOB Shenzhen (Index) | DDP Chicago (Index) | Delta Impact on TCO |
|---|---|---|---|
| Machine Price | 100 | 100 | 0pp |
| Export crating | 2 | 2 | 0pp |
| Ocean freight (40’HQ) | 9–11 | incl. | +9–11pp under FOB |
| Marine insurance | 1 | incl. | +1pp |
| Import duty (HS 8422.30, 2.5%) | 2.5 | incl. | +2.5pp |
| Customs brokerage & THC | 2 | incl. | +2pp |
| Inland freight to site | 3–5 | incl. | +3–5pp |
| Total landed index | 117.5–123.5 | 112–115 | FOB premium 5–8pp |
| Risk transfer point | Ship rail | Buyer dock | Supplier carries loss/damage until final destination |
| Installation liability | Limited | Full | DDP forces supplier to absorb commissioning delays due to transit damage |
Decision rule: Choose DDP when order ≤3 machines or site incurs >$15k/day delay cost; choose FOB when buyer has ≥12 machines/year shipping volume and can self-insure at 0.3% of cargo value.
5. Site Commissioning & Final Acceptance
Insert “30-day reliability demonstration”: machine must achieve ≥90% OEE on buyer’s product mix or supplier pays $2,000 per 1pp shortfall. Demand 24-month full warranty with spare-parts consignment stock valued at 3% of machine price held at buyer’s site; ownership transfers only at warranty expiry. Require remote VPN capability for PLC diagnostics; refusal withholds 5% retention. Final 10% payment is released only after IQ/OQ/PQ documentation is approved and local regulatory certificate (CE, UL, CSA) is re-issued in buyer’s name.
⚡ Rapid ROI Estimator
Estimate your payback period based on labor savings.
Estimated Payback: —