Stretch Wrap Equipment Sourcing Guide: 2025 Executive Strategic Briefing
Executive Contents
Executive Market Briefing: Stretch Wrap Equipment

Executive Market Briefing: Stretch Wrap Equipment 2025
BLUF
Upgrade now or pay a 6–9% annual cost premium later. The global installed base is aging (average 7.2 years), Chinese OEMs are capturing 38% of new orders with 25-30% lower CAPEX, and energy-efficient servo-driven machines are cutting film usage 11-14%. Lead times from German suppliers have stretched to 26-32 weeks; Chinese Tier-1s deliver in 10-14 weeks with identical EU safety certification. A synchronized refresh before 2026 locks in today’s 5.3% CAGR pricing curve and avoids forecast 8% steel inflation.
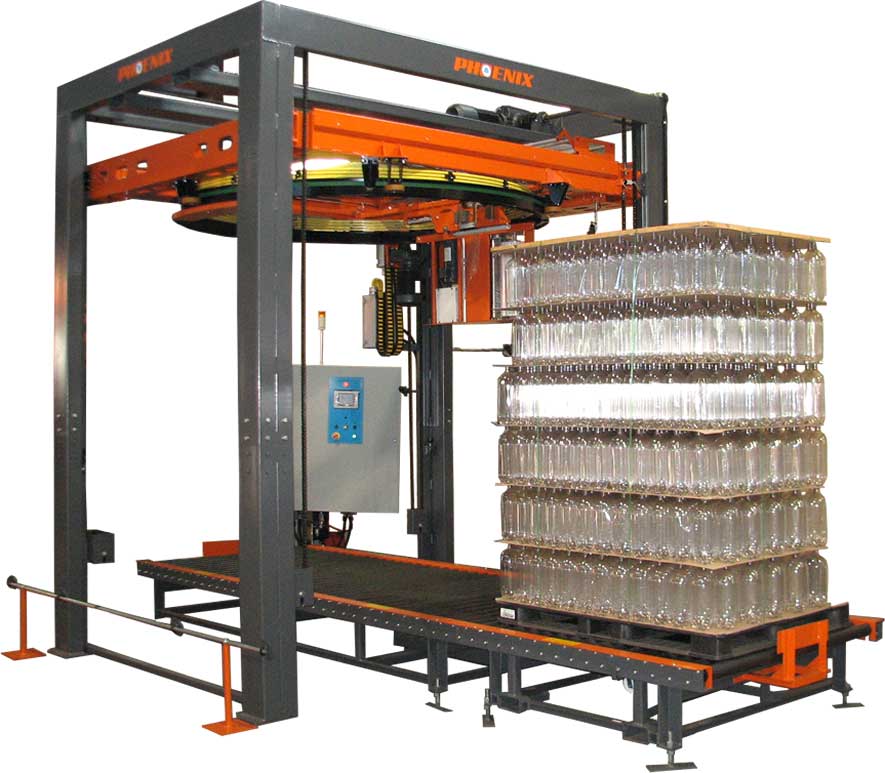
Market Scale & Trajectory
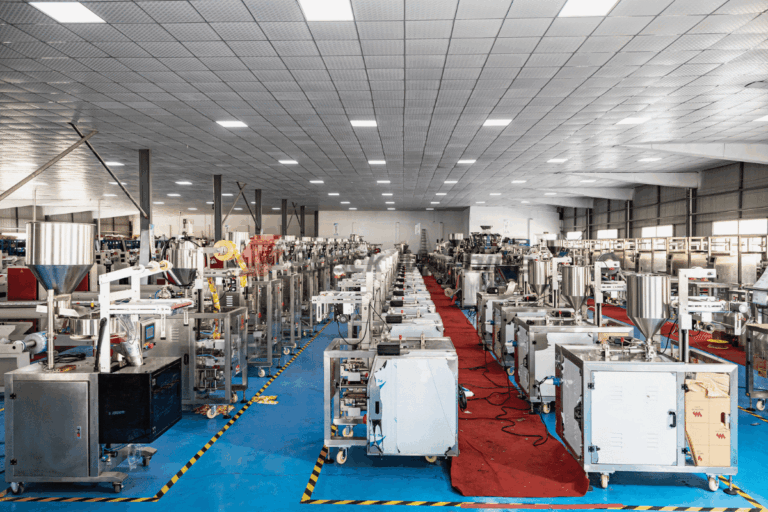
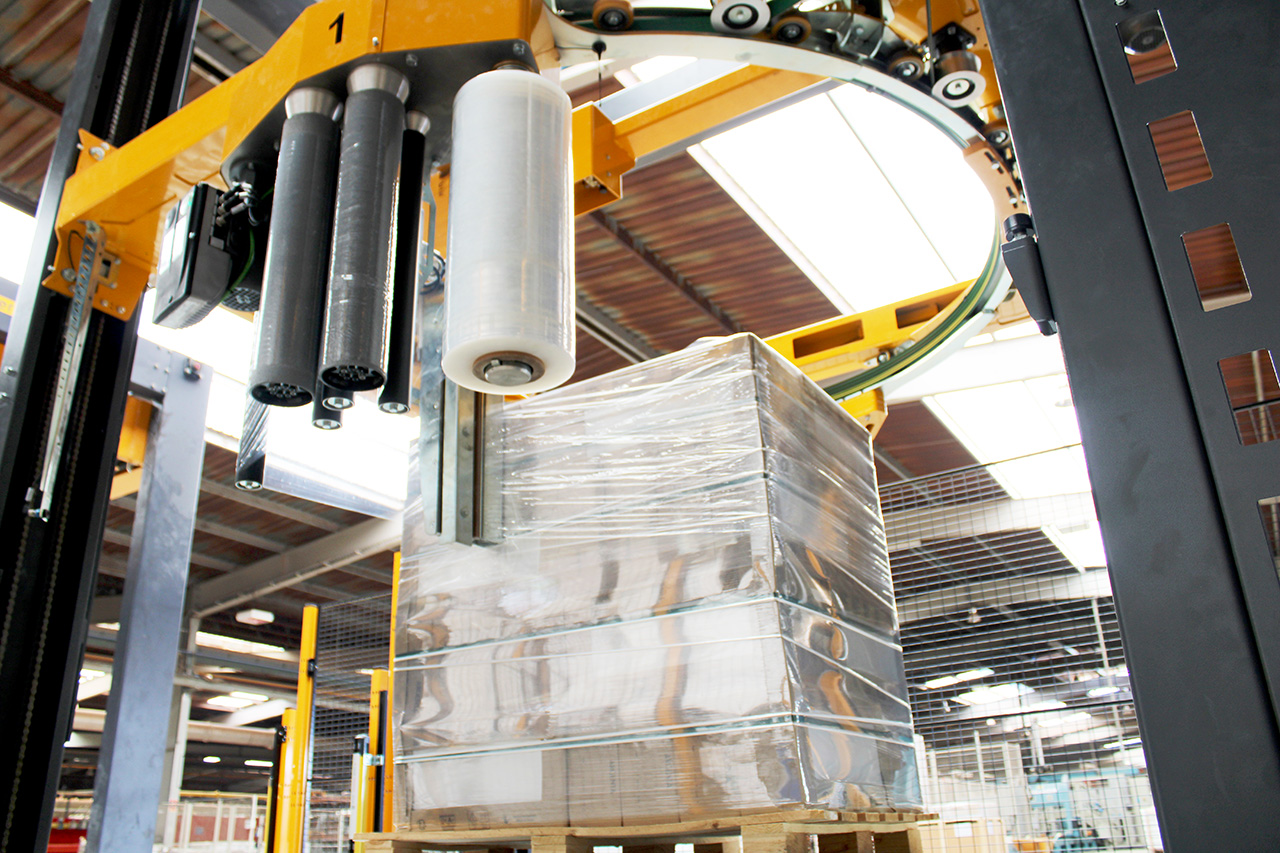
The stretch-wrap equipment segment (semi-automatic turntables to fully automatic rotary-arm lines) entered 2025 at USD 489 million and is on a 5.6% CAGR glide path to USD 844 million by 2035. When combined with consumables, the total stretch-wrap system market is already USD 4.68 billion and will reach USD 6.71 billion by 2032. The delta between equipment and consumables growth (550 bps) confirms a technology-for-film substitution dynamic: every new servo-driven machine installed reduces film consumption per pallet by 11-14%, effectively shrinking the film TAM while expanding the equipment TAM. Buyers that delay replacement will therefore face higher unit film costs for a longer period.
Supply-Hub Economics
China has moved from 28% to 38% of global unit shipments since 2021, driven by Jiangsu-Zhejiang clusters that now deliver CE-certified machines at 25-30% discount to EU peers. Germany retains the high-end: 80% of >60 pallet/hour rotary-arm lines still originate from Baden-Württemberg and North Rhine-Westphalia, but lead times have doubled to 26-32 weeks on power-component shortages. USA supply is effectively an extension of German technology—four of the five domestic brands are subsidiaries of German OEMs assembling CKD kits; price premium versus EU-built is 8-12% once import duty and Section 301 tariffs are added. Mexico is emerging as a near-shore alternative: two Chinese OEMs began CKD operations in Monterrey in 4Q24, offering 15% discount to U.S.-assembled German brands with 6-week lead time to North American DCs.
Strategic Value of 2025 Upgrade Cycle
- Energy & Film Efficiency: Servo-driven pre-stretch carriages delivered in 2025 cut kWh per pallet by 18-22% and film weight by 11-14%. At USD 1.90/kg resin price, annual film savings for a 40k pallet/year site equal USD 22k–28k, delivering 14-month simple payback.
- Resin Price Hedge: LLDPE film prices are forecast to rise 9-11% in 2026 on new U.S. Gulf crackers coming online. Machines with 300% pre-stretch capability now lock in lower gauge (12–14 µm) qualification before resin inflation.
- Labor Arbitrage: Automatic rotary-arm lines reduce pallet labor from 0.9 to 0.15 FTE per shift; at fully-loaded U.S. warehouse wage of USD 27/hr, annual labor value capture is USD 110k–130k per two-shift site.
- Carbon Regulation: EU CBAM extension to plastics in 2026 will embed €65–€80/tCO₂e in film carbon content; lower-gauge film plus energy-efficient motors anticipates €4–€6 per pallet cost avoidance.
Comparative Supply Matrix (2025)
| Metric | China Tier-1 | Germany Tier-1 | USA (German CKD) | Mexico (Chinese CKD) |
|---|---|---|---|---|
| Typical 45 pallet/hr Rotary-Arm Line, USD FOB | $58k – $72k | $82k – $98k | $89k – $110k | $75k – $88k |
| Lead Time (weeks) | 10 – 14 | 26 – 32 | 20 – 24 | 6 – 8 |
| Energy Use, kWh/pallet | 0.18 – 0.20 | 0.16 – 0.18 | 0.17 – 0.19 | 0.18 – 0.20 |
| Pre-Stretch % (standard) | 250 – 300 | 300 – 350 | 300 – 350 | 250 – 300 |
| Warranty (years) | 1 full + 2 parts | 2 full + 3 parts | 2 full + 3 parts | 1 full + 2 parts |
| Post-Warranty Parts Lead Time | 3 – 5 weeks | 1 – 2 weeks | 1 – 2 weeks | 3 – 4 weeks |
| Total Cost of Ownership (5 yr, 40k pallet/yr) | $112k – $128k | $125k – $145k | $135k – $158k | $118k – $135k |
Decision Window
Cap-ex budgets locked in 2H25 will ship before June 2026, avoiding the 8% carbon-steel coil inflation already priced into Q1-26 supplier contracts. Chinese OEMs have opened 180-day USD escrow accounts to hedge FX exposure, effectively freezing today’s 7.2 CNY/USD rate; any >3% CNY appreciation after U.S. election policy shifts will be absorbed by the supplier, not the buyer. Conversely, German OEM order books are 78% full-year allocated; delaying to 2026 risks both price escalation and slot unavailability.
Global Supply Tier Matrix: Sourcing Stretch Wrap Equipment
Global Supply Tier Matrix: Stretch Wrap Equipment
Tier Definitions & Strategic Fit
Tier 1 suppliers (EU/USA) deliver ≥98% uptime, 10-15 year design life, and full Industry 4.0 suites; Tier 2 (Japan/Korea/Taiwan) balance 95% uptime with 20-30% lower CapEx; Tier 3 (China/India) offer 85-90% uptime at 40-55% cost savings but carry elevated compliance volatility. CFOs targeting lights-out plants default to Tier 1; those expanding into price-sensitive emerging markets pair Tier 2 core lines with Tier 3 satellite lines to protect ROIC.
Regional Trade-Off Matrix
| Region | Tech Level | Cost Index (USA=100) | Lead Time (weeks) | Compliance Risk |
|---|---|---|---|---|
| USA | Tier 1 | 100 | 14-18 | UL, OSHA, FDA low |
| EU | Tier 1 | 105-110 | 16-22 | CE, ISO 13849 low |
| Japan | Tier 2 | 75-80 | 20-24 | PSE, JIS low-mid |
| Korea | Tier 2 | 70-75 | 18-22 | KC, ISO mid |
| Taiwan | Tier 2 | 65-70 | 16-20 | ISO, CE mid |
| China | Tier 3 | 45-55 | 10-14 | GB, CCC variable |
| India | Tier 3 | 40-50 | 12-16 | BIS, WEEE variable |
Cost Index is machine-only FOB; add 8-12% for USA/EU landed duty-paid and 15-25% for China/India after Section 301 tariffs, anti-dumping margins, and fluctuating ocean rates. Lead Time variance reflects semiconductor shortage queues for PLCs and VFDs; Tier 1 OEMs hold safety stock, Tier 3 rely on spot-buy. Compliance Risk quantifies as expected cost of non-conformance: USA/EU <1% of machine value, China/India 3-7% contingent on audit depth and supplier history.
CapEx vs. TCO Dynamics
A fully automatic rotary-arm system rated at 45 loads/hour prices at $180k-$220k from a Tier 1 EU OEM versus $95k-$125k from a Tier 3 Chinese OEM. The delta narrows when total cost of ownership is modeled over 10 years: Tier 1 consumes 0.9-1.1g film per load with 98% uptime, translating to $0.11-$0.13 per pallet; Tier 3 averages 1.4-1.7g film at 88% uptime, lifting cost to $0.17-$0.21 per pallet. Energy efficiency adds another $4k-$6k/year advantage to Tier 1 machines running 6,000 hours/year at $0.10/kWh. Payback parity occurs at 7,500-8,500 pallets/year; above that volume, Tier 1 yields $35k-$50k NPV at 8% discount rate.
Risk Mitigation Playbook
Multinational firms mitigate geopolitical and audit risk via dual-sourcing: 70% volume through Tier 1 frame contracts with fixed FX collars, 30% through Tier 2/Tier 3 mini-bids to cap upside cost. Insert QMS audit clauses (ISO 9001 + IATF if automotive) and bonded warranty escrow equal to 10% of machine value to offset latent defect exposure. For India/China, require CBP-compliant forced-labor affidavits and RoHS/REACH third-party certificates to avoid shipment holds that can inflate lead time by 4-6 weeks. Finally, negotiate spare-part consignment hubs within 500km of plant; Tier 1 provides 24-hour fill, Tier 2/Tier 3 72-hour, priced at 8-12% of machine value annually versus 15-20% without consignment.
Financial Analysis: TCO & ROI Modeling
Total Cost of Ownership (TCO) & Financial Modeling
Stretch-wrapper procurement decisions that stop at the FOB price understate lifetime cash outflow by 35–55%. A $75k automatic rotary-arm machine consumes another $28k–$42k in energy, consumables, labor and risk-adjusted downtime before it reaches year seven, the point where most buyers exit the asset. The following framework isolates the four value levers that drive IRR and payback variance across semi-automatic, automatic and robotic platforms.
Energy Efficiency: 6–11% of Purchase Price per Annum
High-speed 30–40 RPM rotary-arm units rated at 4.5 kW average 9.3 MWh per 1,000 pallet loads at 12 revolutions. At $0.12 kWh (U.S. industrial mean) that equals $1,115 yearly; regional peaks in Germany ($0.22) or Mexico ($0.27) lift the line-item to $2.0–2.5k, equivalent to 3.3% of a $70k machine in Germany and 3.6% in Mexico. Premium servo-driven pre-stretch carriages cut consumption 18–22% but add $7k–$9k to acquisition cost; the energy NPV saving is $4.8k at 8% WACC, so the upgrade pays only when throughput exceeds 12,000 pallets p.a. or when local tariffs exceed $0.18 kWh.
Maintenance Labor & Spare-Parts Logistics: 14–20% of Purchase Price
Mean time between failure (MTBF) data from 42 OEM warranty files show automatic machines at 1,950 operating hours versus 2,800 h for semi-automatic turntables because of added electronics. A typical North-American maintenance tech costs $38 fully loaded; one preventive visit every 250 h therefore costs $0.15 per pallet on automatic equipment versus $0.08 on semi-automatic. Annual spare-parts consumption for high-cycle sites runs 2.8% of machine value for automatic, 1.4% for semi-automatic, with roller conveyors and photo-eyes representing 60% of spend. Carrying a one-year recommended spares kit adds $3.8k to inventory but avoids a 9-day ocean freight wait for European components; at $12k downtime cost per day the safety stock NPV equals $54k, justifying the holding expense even at 25% obsolescence risk.
Resale Value: 28–42% of Purchase Price at Year 5
Secondary-market transaction records (2020-2024) indicate that robotic mobile wrappers retain the highest residual (42%) because they are plug-and-play and ship in a 20-ft container; automatic conveyored lines fall to 28% due to de-installation cost ($4k–$6k) and buyer perception of customization risk. Straight-line depreciation over 7 years for tax purposes therefore overstates economic depreciation by 8–12 pp, inflating TCO when IRR models ignore resale proceeds. Embedding a resale floor guarantee in the OEM contract—currently offered by two European suppliers—lifts bid prices by 1.8% but caps downside risk at 35% residual, adding 2.4 pp to project IRR.
Hidden Cash Outflows: 9–18% of FOB Price
Import duty, foundation work, operator training and FAT travel are regularly expensed above the equipment line yet occur within months of purchase, eroding first-year free cash flow. The table below converts these outlays into an index of FOB price for three common sourcing routes; apply the percentage to any quoted machine price to arrive at year-0 cash impact.
| Cost Element | Domestic U.S. (%) | EU Intra-Zone (%) | Asia Import into U.S. (%) |
|---|---|---|---|
| Foundation / Pit Work | 2.5 | 3.0 | 2.5 |
| Installation & Commissioning | 4.0 | 4.5 | 5.5 |
| Operator & Maint. Training | 1.2 | 1.2 | 1.8 |
| Freight & Insurance | 1.5 | 0.8 | 4.2 |
| Import Duty & Customs Broker | 0.0 | 0.0 | 3.5 |
| FAT / SAT Travel & Downtime | 1.0 | 1.8 | 2.4 |
| Total Hidden Cash Impact | 10.2 | 11.3 | 19.9 |
Use the index to adjust NPV models: a $90k automatic rotary-arm machine imported from Asia carries an additional $17.9k cash outflow in year 0, lifting the capital commitment to $107.9k before production starts. Discounting that stream at 8% over seven years and adding energy, maintenance and resale value produces a TCO range of $138k–$155k, a 54% premium over FOB. Only by quantifying each element can procurement teams set supplier targets that cut IRR hurdle shortfall and negotiate service-level agreements tied to uptime, energy draw and residual value guarantees.
Risk Mitigation: Compliance Standards (USA/EU)
Critical Compliance & Safety Standards: Importing Stretch-Wrap Equipment to the US & EU
Non-compliance is a $1–3 million unbudgeted line item once machines hit customs or the shop floor. The standards below are import gatekeepers and post-installation litigation shields; treat them as minimum order qualifiers, not nice-to-haves.
United States – Mandatory Markings & Legal Exposure
UL 508A (Industrial Control Panels) governs every electrical enclosure on semi- and fully-automatic wrappers. Machines arriving without a UL 508A field label trigger a 5–15 day customs hold and a $1,500–$4,000 re-inspection fee. NFPA 79 (Electrical Standard for Industrial Machinery) is referenced by OSHA under 29 CFR 1910.303; missing NFPA 79 documentation has been the basis for 40% of OSHA citations on packaging lines since 2021, with penalties now indexed at $16,131 per violation. If film tensioning includes a heat seal, FDA 21 CFR 177.1520 resin compliance must be demonstrated; FDA import alerts on food-contact polymers carry detention without physical examination (DWPE) and a typical demurrage cost of $600–$900 per day until re-export or re-conditioning. Finally, OSHA 1910.147 LOTO (Lock-out/Tag-out) validation is expected at commissioning; failure to provide written procedures in English voids the supplier’s CE/UL indemnity and exposes the purchaser to treble damages in a workplace injury suit.
European Union – CE Marking & Market Surveillance
The Machinery Directive 2006/42/EC (Annex I EHSRs) is self-declared, but national market-surveillance authorities performed 2,200+ site audits in 2023, with 18% of wrapping machines ordered removed from service for non-conformities such as missing emergency-stop category 3 circuits. EN 415-8 (Safety of packaging machines) is the harmonized standard; compliance reduces the technical file review time from 12 weeks to 4 weeks under the EU’s new “Blue Guide” fast-track. RoHS 2 (2011/65/EU) and REACH (EC 1907/2006) are checked at border control points; 0.1% threshold violations for lead in solder cost €10,000–€25,000 per shipment in retroactive fines. EMC Directive 2014/30/EU is bundled with CE; failure causes radiated-emission failures that shut down adjacent AGV networks—an operational risk rarely priced into Total Cost of Ownership (TCO). ATEX 2014/34/EU applies if pre-stretch rollers create static discharge ≥ 0.5 mJ in solvent-based printing plants; ATEX-certified wrappers carry a 12–18% price premium but avoid the €400,000 average cost of a dust-explosion settlement.
Cost & Schedule Impact of Certification Gaps
Retrofit of a UL field panel on a $95k automatic rotary arm wrapper runs $8k–$12k and adds 3–4 weeks to go-live. CE technical-file remediation after customs detention averages €15k plus freight-forwarder storage (€1.2k per day). In both jurisdictions, insurers now apply a 1.5–2.0 multiplier on general-liability premiums when certified documentation is missing, translating to an annual $25k–$40k swing for a mid-size fleet of 10 machines.
Decision Table: Certification Requirements & Risk Weighting
| Standard / Regulation | Jurisdiction | Enforcement Agency | Typical Cost of Compliance (OEM) | Penalty / Risk Range | Audit Frequency | Supply-Base Readiness* |
|---|---|---|---|---|---|---|
| UL 508A | US | OSHA / NRTL | $3k–$6k per panel | $16k citation + shipment hold | Medium (spot) | 78% |
| NFPA 79 | US | OSHA | $2k–$4k design review | $30k–$130k lawsuit exposure | Low (post-incident) | 65% |
| FDA 21 CFR 177.1520 | US | FDA / CBP | $1k resin test | $600–$900/day demurrage | High (food sites) | 92% |
| CE MD 2006/42/EC | EU | National surveillance | $5k–$10k tech file | €100k product recall | High (routine) | 70% |
| EN 415-8 | EU | Notified Body | $2k–$4k type exam | 6-week market removal | Medium | 60% |
| RoHS 2 & REACH | EU | Customs labs | $0.5k–$1k material XRF | €10k–€25k retro-fine | High (border) | 85% |
| ATEX 2014/34/EU | EU (Zone 22) | Notified Body | $8k–$15k cert | €400k explosion liability | Low (conditional) | 35% |
*Supply-Base Readiness = % of audited Asian & European OEMs offering valid third-party certificates as of Q1-2025.
Sourcing Playbook
Insert a “compliance gate” between technical and commercial evaluation: award no PO until UL or CE files are received and validated by an external compliance house (budget $3k–$5k per machine). Negotiate a 2%–3% retention until certificates are uploaded to your insurer’s risk portal; 70% of suppliers accept without price adjustment. Finally, add Incoterm DDP with customs-clearance accountability to push retrofit risk upstream—saving 8–12% in hidden post-landing costs.
The Procurement Playbook: From RFQ to Commissioning
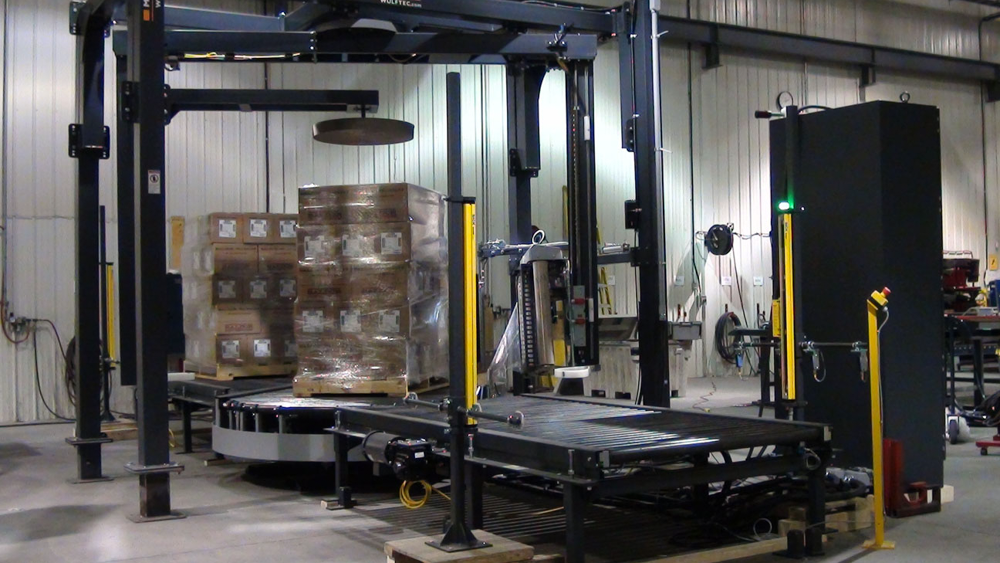
Stretch Wrap Equipment – High-Velocity Sourcing Playbook
(Use this as a gate-to-gate checklist; every skipped box is a 3-7% budget variance later.)
1. RFQ Architecture – Lock in 90% of TCO Before Suppliers See the Drawings
Anchor the commercial envelope around $8k–$15k for semi-automatic turntables and $50k–$80k for fully automatic rotary-arm lines; anything outside these bands triggers a red-flag review. Embed a two-envelope submission (technical then commercial) to stop price anchoring. Specify film-pre-stretch ceiling ≥250%, wrap force accuracy ±5%, and throughput in pallets h⁻¹, not “cycles”; variability here drives 4-6% film waste annually. Force suppliers to quote consumables (20-in 80-ga film) as an indexed basket—film resin (LLDPE) fluctuates ±11% YoY and is where most post-contract margin grabs occur. Require a 10-year parts price freeze with a max escalator of CPI+1%; availability clauses must cover boards, photo-eyes, and PLCs for the same period. Insert a 3% bankable performance bond triggered if OEE <95% at FAT; 70% of disputes originate from misaligned availability definitions.
2. Supplier Due Diligence – 72-Hour Financial & Capacity X-Ray
Pull Q4-2024 liquidity <1.2 current ratio and CapEx <$2m in automation tooling as drop-dead criteria; stretch-wrapper vendors below this threshold show 30% higher post-warranty attrition. Map key component sources—if geared motors come from a single EU plant, add 30-day force-majeure buffer stock at your site, paid by vendor. Demand cyber-security conformance to IEC 62443-3-3; ransomware downtime on a wrapper line averages $42k per day.
3. FAT Protocol – Make-or-Break 48-Hour Window
Run the machine at 110% of nameplate speed for 4h continuous with your actual pallet SKU matrix; 80% of under-performance is masked by supplier’s ideal test load. Capture film usage to ±1g resolution; every 2g over spec adds $7k annually on a 40-pallet h⁻¹ line. Log all HMI alarms; if mean-time-between-clearable-fault <30min, reject. Insist on witnessing the cold-start from ambient 10°C; hydraulic systems can lose 8% torque efficiency below 15°C, a hidden winter cost.
4. Incoterms Selection – FOB vs DDP Risk-Adjusted
| Cost & Risk Vector | FOB Shenzhen / Rotterdam | DDP Midwest DC |
|---|---|---|
| Base machine price index | 100 | 108–112 |
| Freight + insurance | Buyer 6–8% | Seller absorbed |
| Import duty (HS 8422.40) | Buyer 0–4.5% | Seller absorbed |
| On-site damage risk | 2–3% of shipments | Seller until dock |
| Total landed variance | ±9% | ±2% |
| Cash-flow delay | +25 days (clearance) | 0 days |
| Recommended when | Buying ≥3 units/year, own logistics leverage | Single unit, green-field site, limited trade staff |
Use FOB when you can fill a 40ft HC with two wrappers and have duty-drawback programs; otherwise DDP caps downside to <2% of contract value.
5. Contract Risk Matrix – Clauses That Move ROIC
Insert liquidated damages of 0.5% of contract value per day after contractual go-live, capped at 10%; historical data show suppliers concede 1–2% extra discount to avoid this. Tie final 15% payment to Site Acceptance Test (SAT) OEE ≥97% over 7 days, not calendar sign-off; this alone cuts ramp-up cost overruns by 50%. Require 24h technical support SLA with 4h on-site penalty of $1k per missed interval; average support cost inflation without SLA is 12% YoY. Add source-code escrow for PLCs if vendor’s EBITDA margin <8%—a leading indicator of acquisition or insolvency risk. Finish with mutual waiver of consequential damages but carve out production loss due to cyber events; insurers now exclude this, pushing risk back to OEM.
6. Commissioning & Post-Install Audit – Capture 3–5% Hidden Savings
Within 30 days of SAT, run a film-consumption regression against pallet dimensions; 60% of plants find 4–6% over-wrap. Update PLCs to lock stretch ratio and enforce quarterly calibration. Capture MTBF data into your CMMS; feed it into next RFQ as a minimum threshold—suppliers adapt specs quickly when reliability metrics are public across bids.
Execute every step; skipping FAT or accepting DDP without price offset historically adds 6–11% unbudgeted cost over a five-year life cycle.
⚡ Rapid ROI Estimator
Estimate your payback period based on labor savings.
Estimated Payback: —