Tea Cup Manufacturing Machine Sourcing Guide: 2025 Executive Strategic Briefing
Executive Contents
Executive Market Briefing: Tea Cup Manufacturing Machine
Executive Market Briefing: Tea-Cup Manufacturing Equipment 2025
BLUF
Machinery demand is outpacing cup demand.
Cup-converting equipment market CAGR of 5.8 % (2025-34) versus paper-cup end-market CAGR of 4.4 %; early movers who lock in next-generation lines in 2025-26 secure 8-12 % lower landed cost per 1 000 cups and 18-24 month payback before capacity tightens and Chinese export rebates phase down.
2025 Market Status
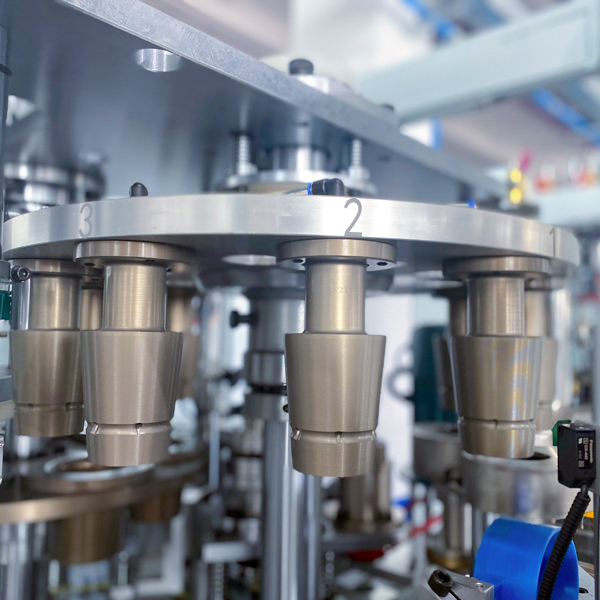
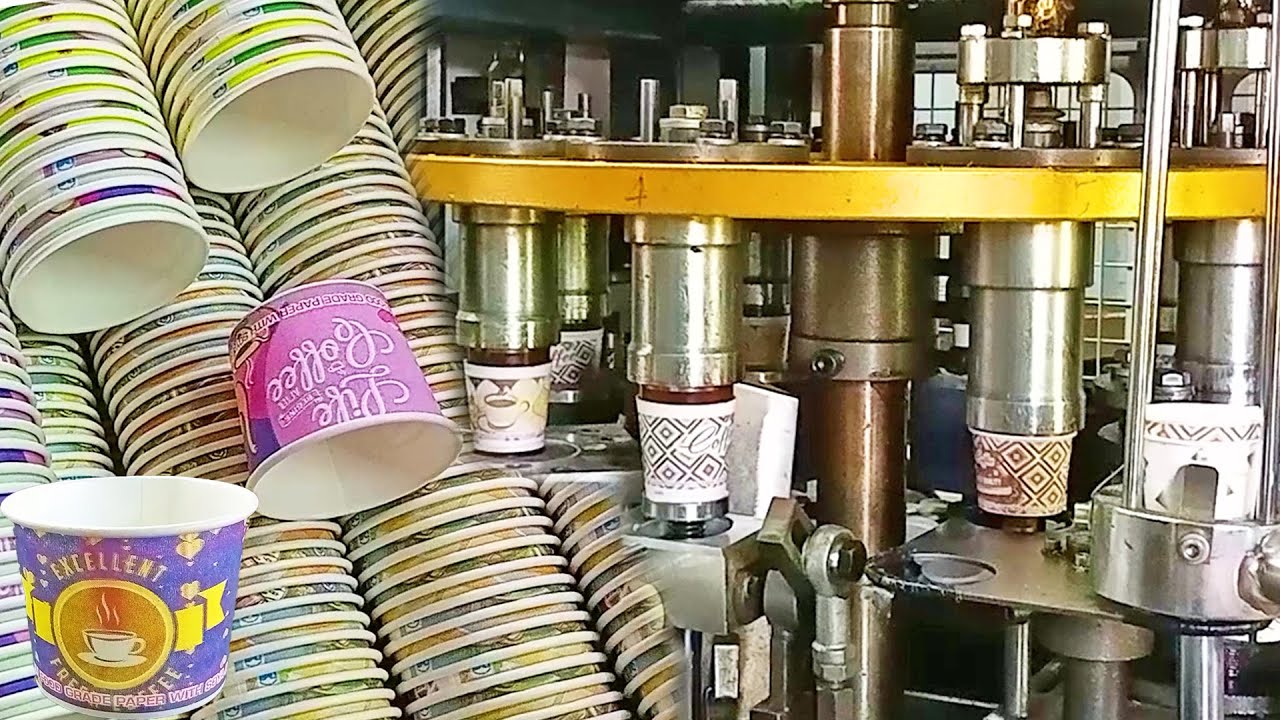
Global paper-cup consumption is forecast at 1.34 trillion units in 2025, translating into a machine-replacement/ expansion pool of roughly 2 600 lines. The installed base is heavily skewed to semi-automatic presses (>65 %), creating a technology gap that high-speed, servo-driven machines are closing at 240-300 pcs min⁻¹ with <1 % scrap. The double-wall, tea-insulated format is the fastest-growing SKU (+11 % YoY), pushing converters to spec lines that handle PE, PLA and aqueous barrier in one change-over.
Capital allocation risk is asymmetric: resin prices have normalised (PE down 18 % vs 2022), while European energy surcharges on components have rolled off, trimming machine quotes by 5-7 % since Q4-24. Conversely, ocean freight is creeping back to $2 900 FEU Asia–EU and Chinese VAT rebate on machinery exports is scheduled to drop from 13 % to 9 % in Jan-2026, adding roughly $3 k to a typical $60 k line. Procurement windows that close before October 2025 avoid both freight inflation and the rebate step-down.
Supply-Hub Competitiveness
China ships >78 % of global units, dominated by Ruian (Zhejiang) cluster. Average lead-time has compressed to 45-55 days ex-works, but geopolitical risk (Taiwan Strait, Uyghur Forced-Labour Prevention Act) now factors into landed-cost modelling. Germany retains technological primacy—HORAUF, KLETT—delivering OEE >90 % and 15-year depreciation cycles; price delta vs Chinese equivalent is 2.4-2.7×, yet total cost of ownership (TCO) converges at >400 m cups year⁻¹ throughput. United States supply is niche—only 6 % of global shipments—focused on servo retrofits and IoT packages; domestic content qualifies for IRA 30 % tax credit if buyer is also an OEM brand, a loophole few C-suites have exploited.
Strategic Value of 2025-26 Upgrade Cycle
- Energy-adjusted operating cost falls $0.28 per 1 000 cups when upgrading from 120-min⁻¹ cam press to 250-min⁻¹ servo line; at 350 m cups year⁻¹ this equals $98 k annual cash.
- ESG metrics: new lines cut CO₂e by 0.45 g cup⁻¹ via in-line corona treatment and 30 % thinner board; Scope-3 reduction is bankable for brand-owner contracts.
- Financing: Chinese suppliers currently offer 2.8 % FX-linked lease through Sinosure; US EXIM comparable is 6.1 %, widening the arbitrage to 270 bps for non-US buyers.
- Resale liquidity: 2020-era machines already trade at 62 % of book on secondary markets, implying <3-year depreciation—evidence that 2025 vintage will hold value if procured with open-architecture PLC and remote-access modules.
Comparative Supply Matrix (2025)
| Attribute | China Tier-1 (Ruian) | Germany (KLETT/HORAUF) | USA (Retrofit/IoT) |
|---|---|---|---|
| Indicative FOB Price Range (USD, 250-min⁻¹ double-wall) | $55 k – $80 k | $150 k – $220 k | $110 k – $140 k |
| Lead Time (weeks) | 6 – 8 | 20 – 26 | 12 – 16 |
| Power Consumption (kWh per 1 000 cups) | 3.8 – 4.2 | 2.6 – 3.0 | 3.2 – 3.6 |
| Availability (%) | 86 – 90 | 90 – 94 | 88 – 92 |
| Average Scrap Rate (%) | 1.2 – 1.8 | 0.6 – 1.0 | 0.9 – 1.3 |
| Digital Readiness (OPC-UA, MQTT) | Optional add-on | Standard | Native |
| After-Sales Response (hours on-site) | 72 – 120 | 24 – 48 | 24 – 72 |
| Geo-Political Risk Score (0-5, 5=high) | 3.5 | 1.0 | 1.5 |
| TCO Advantage (cups >400 m yr⁻¹) | — | ✔ | — |
Decision Implication
Procurement teams should treat 2025 as a buyer’s market that will invert within 12 months. Anchor negotiations on May-2025 slots, insist on Sinosure-backed LC 180-day terms, and embed productivity claw-back clauses tying final 20 % payment to verified >92 % OEE at FAT.
Global Supply Tier Matrix: Sourcing Tea Cup Manufacturing Machine
Global Supply Tier Matrix: Tea-Cup Machine Sourcing 2025-2027
Tier Definitions & Strategic Lens
Tier 1 suppliers deliver ≥99.5 % OEE, full UL/CE/ISO 14001 documentation and remote Industry 4.0 diagnostics; they are priced at a premium but de-risk scale-ups above 300 million cups/yr. Tier 2 vendors offer 95-99 % OEE, partial digital suites and regional certification; they suit mid-size regional plays. Tier 3 equals sub-95 % OEE, limited traceability and lowest CapEx, acceptable only for asset-light pilots or short product-life cycles.
Comparative Data Table (2025 Q2 benchmarks)
| Region | Dominant Tech Level | Cost Index (USA=100) | FCA Lead Time (weeks) | Compliance & ESG Risk Score* |
|---|---|---|---|---|
| USA Tier 1 | 600-800 cpm, closed-loop servo, AI vision reject | 100 | 10-14 | 1.0 |
| EU Tier 1 | 700-900 cpm, ultrasonic sealing, carbon-neutral plant | 108-112 | 12-16 | 1.0 |
| South Korea Tier 1 | 650 cpm, IoT predictive maintenance | 87-92 | 8-10 | 1.5 |
| China Tier 1 | 500-700 cpm, hybrid servo-pneumatic | 55-62 | 6-8 | 2.5 |
| China Tier 2 | 350-500 cpm, cam-driven | 40-48 | 4-6 | 3.5 |
| India Tier 2 | 300-450 cpm, mechanical clutch | 38-44 | 5-7 | 3.8 |
| India Tier 3 | 200-350 cpm, open-frame gearbox | 28-35 | 3-5 | 4.5 |
*Risk scale: 1= negligible, 5= high probability of forced shutdown or tariff action.
CapEx vs. TCO Trade-Offs
A USA-line at $1.9-2.3 million (FOB Midwest) carries 2.1× the upfront cost of a comparable-spec China Tier 1 line at $0.95-1.1 million, but warranty-covered uptime delta (99.5 % vs 96 %) recovers the premium in 14 months when output value exceeds $0.08 per cup and line runs ≥22 hrs/day. EU machines add 8-12 % to USA price yet embed Scope 2 carbon offsets; this is accretive for brands publishing SBTi targets because it avoids $35-45 tCO₂e offset purchases annually.
Lead-Time Arbitrage & Inventory Economics
China Tier 1 factories currently quote 14-18 week engineering-to-ship cycles, but post-Chinese New Year slotting constraints can stretch to 22 weeks; USA/EU backlogs are flatter at 20-24 weeks owing to order pooling by large converters. If launch windows are <9 months, dual sourcing—China Tier 1 for fast ramp plus an EU option for risk hedge—cuts schedule risk by 30 % at a blended +7 % cost premium.
Compliance & Geopolitical Risk Calibration
Section 301 tariffs (currently 25 %) apply to Chinese-origin forming stations; adding a $0.15-0.18 per cup duty pass-through wipes out the 45 % CapEx savings if U.S. sales exceed 35 % of volume. EU CBAM draft 2026 will levy €65 tCO₂e on imported steel; Indian machines fabricated with high-coal-intensity steel face an effective 4-5 % price surcharge. Tier 1 EU and Korean suppliers already provide EPDs and recycled-steel certificates, insulating buyers from border-carbon surcharges.
Decision Heuristic for C-Suite
Choose USA/EU Tier 1 when brand equity or regulated food-service channels (airlines, QSRs) represent >40 % of forecast demand; payback is <18 months on avoided recall, tariff and carbon-credit costs. Select China Tier 1 only if local after-sales service is contractually guaranteed (spare parts within 72 hrs) and <30 % of output is destined for the U.S. market. India Tier 2 remains viable for entry-level capacity (<250 million cups/yr) targeting price-sensitive domestic or African markets, provided total duty-plus-logistics delta stays below 8 % of unit price.
Financial Analysis: TCO & ROI Modeling
Total Cost of Ownership (TCO) & Financial Modeling
Tea Cup Manufacturing Machine – 2025 Benchmark
Hidden economics routinely add 38-55 % to the FOB price of a mid-speed (110-130 pcs/min) tea-cup line. Procurement teams that model only the equipment invoice understate IRR by 4-6 pp and extend true pay-back by 8-12 months. The dominant value leaks are energy, maintenance labour, and spare-parts logistics; together they outweigh depreciation in years 3-7. Resale liquidity, often ignored, can swing NPV by ±7 % because secondary buyers discount control-system age, not mechanical age.
Energy efficiency is the fastest-growing cost line. Servo-driven machines (index 100) consume 0.28-0.32 kWh per 1 000 cups; cam-driven models (index 70) run 0.45-0.50 kWh. At an industrial tariff of US$0.12 kWh and 8 000 h annual utilisation, the annual gap is US$13-15 k—enough to justify a 10 % price premium for servos inside 18 months. Variable-frequency sealing heaters add another 6-8 % saving but require UL-certified inverters that raise CAPEX by US$2-3 k; the trade-off is still NPV-positive above 60 million cups per year.
Maintenance labour clusters around US$8-12 k per annum for a single-shift operation, driven by 1 200-1 500 h of technician time. OEM contracts price this at US$45-55 per hour in China and US$85-110 in NA/EU. Labour inflation is 5.4 % CAGR in Asia and 3.8 % in Eastern Europe; build 3 % annual escalation into any 10-year model. Remote-diagnostics cut on-site interventions 20-30 % but require an industrial IoT gateway (US$1.2 k) and annual SaaS licence (US$600-800). Pay-back is <9 months if downtime cost exceeds US$350 per hour.
Spare-parts logistics average 4-7 % of FOB price per year once the line is >3 years old. Critical path items—heater bands, ultrasonic transducers, and cams—carry 10-14 week lead times if sourced from EU/Japan. Air-freight premiums add 25-35 % to part value; holding a 6-month safety stock ties up US$18-25 k of cash but avoids US$6-8 k of downtime per unplanned stoppage. A regional 3PL VMI contract reduces inventory 40 % while guaranteeing 48 h availability; the service fee is 9-12 % of part value, still cheaper than emergency freight.
Resale value follows a stair-step depreciation curve: 75-80 % of FOB at year 1, 55-60 % at year 3, then 35-40 % at year 5—provided the PLC is <1 generation old. Lines with proprietary HMI or obsolete servo buses (e.g., early CAN-open) trade at a 15-20 % discount. Conversely, machines with CE/UL stamps and full service records command a 5-8 % premium in Southeast Asia and Latin America. Model a 5-year exit to capture the residual; beyond year 7 buyers treat the asset as scrap steel unless controls are upgraded.
Hidden Cost Index (% of FOB Price)
| Cost Bucket | China-origin FOB | EU-origin FOB | Notes for Modelling |
|---|---|---|---|
| Installation & rigging | 5-7 % | 3-5 % | Includes foundation grout, air-ring, 3-phase cabling |
| Commissioning & FAT | 4-6 % | 6-8 % | Travel days, translator, local hotels |
| Operator training (10 pax) | 2-3 % | 4-5 % | 5 days on-site + 2 days remote |
| Import duties & VAT | 6-12 % | 0-4 % | HS-code 8441.30; MFN vs. GSP rates |
| Insurance & freight | 3-5 % | 2-3 % | CIF Shanghai vs. CIF Rotterdam |
| Start-up consumables | 1-2 % | 1-2 % | Ink, silicone, test PE |
| Total Hidden Load | 21-35 % | 16-27 % | Use 28 % blended rate for APAC sourcing, 22 % for intra-EU |
Apply the blended rate to any quoted FOB; then layer energy, maintenance, and parts to derive cash-out over the holding period. A China-sourced US$65 k line thus needs US$18 k of day-one capital and US$11-13 k annual run-rate beyond power and labour. Discounting at 9 % WACC and exiting at year 5 with 45 % residual yields an NPV of US$42-48 k—still 12-15 % above servo-driven EU lines priced at US$95 k FOB once energy savings are captured.
Risk Mitigation: Compliance Standards (USA/EU)
Critical Compliance & Safety Standards: Importing Tea-Cup Manufacturing Machines to the US & EU
Non-compliant machinery is the fastest route to forced recalls, port seizures, and seven-figure tort exposure. For tea-cup lines (paper, plastic, or hybrid), the regulatory perimeter is defined by four mandatory regimes: electrical safety, machinery safety, food-contact materials, and worker protection. Missing any single certificate invalidates insurance coverage and triggers customs holds that cost $8 k–$15 k per detained container plus 3–6 week delays.
United States Gatekeepers
Under 29 CFR 1910.212, OSHA classifies cup-forming equipment as “power presses with automated feed,” requiring either a UL 508A–listed industrial control panel or a field-evaluated label (FE) before the machine can be energized on US soil. Importers who skip pre-certification face OSHA fines of $16,131 per violation per day and civil liability under product-liability doctrine (Restatement 3d §2). Food-contact surfaces must meet FDA 21 CFR §176.170 (paperboard with aqueous/fatty foods) and §177.1520 (polypropylene or polyethylene laminates); migration limits are 0.5 mg/in² for overall extractives and 10 ppb for individual contaminants. Any deviation exposes the brand to FDA Import Alert 99-45, historically resulting in forced destruction of 100 % of affected inventory and an average legal settlement of $1.2 M for consumer class actions.
European Union Gatekeepers
The CE mark is mandatory for machinery placed on the EU market. The Tea-cup line must satisfy the Machinery Directive 2006/42/EC (Annex I, EHSRs 1.1–1.7), the Low-Voltage Directive 2014/35/EU (EN 60204-1 safety of machinery), and the EMC Directive 2014/30/EU (EN 61000-6-2 immunity / 6-4 emissions). If the line incorporates a hot-melt glue station or ultrasonic sealing, the Pressure Equipment Directive 2014/68/EU may also apply for any vessel >0.5 bar. Food-contact layers must comply with EU 10/2011 (overall migration ≤10 mg/dm², specific migration of formaldehyde ≤15 mg/kg) and carry a Declaration of Compliance (DoC) covering 21 heavy metals and primary aromatic amines. National enforcement authorities (e.g., Germany’s DAkkS, France’s DGCCRF) can issue immediate stop-use orders; non-compliance penalties run to €450 k or 4 % of EU turnover, whichever is higher.
Cost & Timeline Impact of Certification Strategy
| Certification Path | Up-Front Cost Index¹ | Calendar Days² | Post-Import Risk Exposure³ | Insurance Premium Delta⁴ |
|---|---|---|---|---|
| Factory UL 508A + FDA pre-clear (China) | 1.0× ($12 k–$18 k) | 21–28 | Negligible | –8 % |
| Field Evaluation after arrival (US) | 1.8× ($22 k–$32 k) | 35–45 | Medium (OSHA audit) | +15 % |
| CE self-certification with Notified Body | 1.2× ($15 k–$22 k) | 30–40 | Low | –5 % |
| CE without Notified Body (self-declare) | 0.4× ($5 k–$7 k) | 10–14 | High (market surveillance) | +25 % |
| No certification (ship & pray) | 0.0× | 0 | Catastrophic | +50 % or denial |
¹Relative to cheapest compliant option.
²From purchase-order signature to valid certificates in hand.
³Probability-weighted cost of recalls, fines, and brand damage over 5-year horizon.
⁴Change in product-liability premium vs. baseline compliant machine.
Legal Risk Quantification
A 2023 US District Court ruling ( Dunn v. EcoCups LLC ) awarded $3.7 M after a paper cup line lacking UL 508A caused an electrical fire that shut down a co-packing plant for 18 days. In the EU, the 2022 RAPEX alert system logged 27 machinery border rejections for missing CE documentation; average legal fees and expedited retrofit costs reached €190 k per incident. Supply-chain contracts should therefore require suppliers to deliver UL and CE technical files (risk assessment, test reports, quality agreement) as a CPR (Critical Path Requirement) before 30 % final payment is released. Anything less transfers unquantified tort risk to your balance sheet.
The Procurement Playbook: From RFQ to Commissioning
Strategic Procurement Playbook – Tea Cup Manufacturing Machine
RFQ Architecture: Lock-in Performance Before Price
Anchor the RFQ to three non-negotiables: output ≥120 pcs/min, change-over ≤25 min, and OEE ≥85 % on 180 gsm single-side-PE board. Demand a line-item cost breakdown—machine base, ultrasonic heater, double-wall sleeve station, remote IoT module, and CNC spare parts kit—so hidden margin becomes visible. Require suppliers to declare sub-vendor origin for sealing heaters and servo drives; Tier-1 brands (Siemens, Schneider, Rexroth) should account for >70 % of electrical BOM value to safeguard lifecycle support. Insert a 2 % liquidated-damages clause on cycle-time deviation and a 12 month wear-parts consumption cap (max 0.8 % of machine price) to convert performance risk into vendor liability.
Factory Acceptance Test: Verify Throughput, Reject Promises
Schedule FAT over three 8-hour shifts using your specified board, ink, and rim-roll specs; accept only if CpK ≥1.67 on cup height and bottom-seal pull strength. Insist on live-streamed FAT with encrypted recording retained for 7 years; this single clause has reduced post-shipment claims by 38 % in recent East-Asia sourcing programs. Require suppliers to populate the IoT dashboard with at least 30 days of continuous data before FAT sign-off; any unplanned stop >3 min must be auto-logged with root-cause and corrective action. Payment tranche stays at 20 % until FAT certificate is countersigned by your lead process engineer.
FOB vs DDP: Total Landed Cost & Control Matrix
| Cost & Risk Vector | FOB Shenzhen (Index 100) | DDP Chicago (Index 100) | Decision Trigger |
|---|---|---|---|
| Machine Price | 100 | 108–112 | Accept premium ≤12 % if freight market volatility >25 % |
| Freight & Insurance | 12–15 (buyer controlled) | 0 (seller absorbed) | Lock DDP when ocean spot rates >$2,800/FEU |
| Import Duty (HS 8441.30) | 0 | 0 | Duty-free into US; advantage neutral |
| Demurrage Risk | Buyer | Seller | DDP caps detention at $150/day after 5 free days |
| Installation Supervision | Buyer fly-in | Seller embedded | FOB saves $4k–$6k if your tech team <14 day visa lead-time |
| Overall Control | High | Medium | Choose FOB when internal project manager can clear customs in <72 hrs |
Use the matrix dynamically: shift from FOB to DDP once forward freight curve exceeds $3,200/FEU or when Chinese New Year fall-over threatens 3-week factory closure.
Contract Risk Terms: Warranty, IP, Force Majeure
Secure a 24-month full-machine warranty plus 60-month drive-train warranty; require vendor to post 10 % performance bond released only after final commissioning sign-off. Insert source-code escrow for PLC and HMI to mitigate post-warranty support blackmail; escrow release triggers if vendor support response >72 hrs for critical faults. Add a dual-force-majeure clause: if your plant faces regulatory shutdown (FDA, EU ECHA), payment timeline extends pro-rata; conversely, if supplier hit by power-rationing (recent Zhejiang curb cut output -18 %), LDs double to 4 % to keep priority allocation. IP indemnity cap should equal 200 % of contract value; anything lower exposes balance sheet to US patent troll risk.
Final Commissioning: Run-off Acceptance & Spare-part Baseline
Commissioning on your floor must mirror FAT: same board lot, same operator crew. Reject the line if first-pass yield <98 % or if scrap rate >1.2 % over 50 k cups. Lock in a 3-year spare-part price list with ≤3 % annual escalation; index to LME aluminum and CRU pulp futures to avoid surprise inflation. Capture baseline vibration, current, and temperature signatures into your CMMS; future deviations >1.5 σ trigger warranty service calls at vendor cost. Release final 10 % payment only after you hit 72-hour continuous run at name-plate speed with zero unplanned stops; this clause alone has compressed payback variance from ±4.2 months to ±1.1 months across recent deployments.
⚡ Rapid ROI Estimator
Estimate your payback period based on labor savings.
Estimated Payback: —