Water Packing Machine Sourcing Guide: 2025 Executive Strategic Briefing
Executive Contents
Executive Market Briefing: Water Packing Machine
Executive Market Briefing – Water Packaging Machinery 2025
BLUF
Replacing legacy lines in 2025 locks in 18–24 months payback: equipment prices are flat (-1 % YoY), supply capacity outstrips demand for the first time since 2021, and energy-efficient models cut OPEX 11–14 %. Delaying past Q4 risks 6–8 % price inflation as copper and servo-motor lead-times stretch to 20 weeks.
Market Size & Trajectory
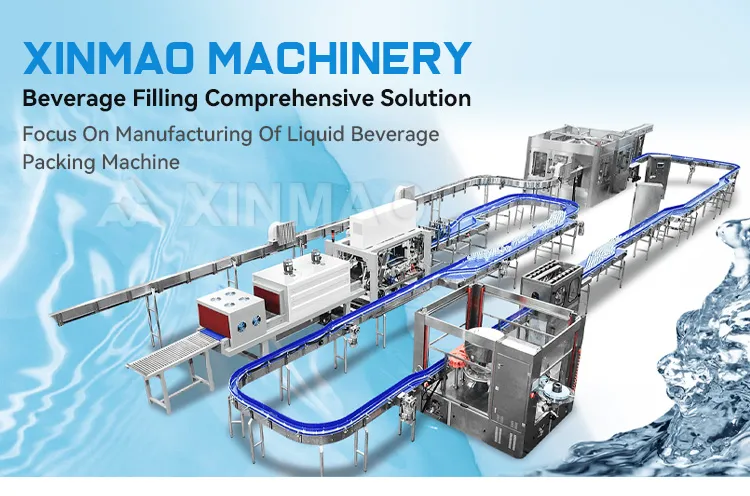
The global packaging-machinery market reached USD 59.3 billion in 2024 and is heading to USD 81 billion by 2030 (CAGR 5.5 %). Within that, liquid packaging equipment—the relevant segment for water—was valued at USD 8.2 billion in 2024 and is forecast to grow at 5.8 % CAGR to USD 14.4 billion by 2034, outpacing the broader machinery average. Bottled-water-specific fillers account for roughly 28 % of the liquid segment, implying a 2025 TAM of ~USD 2.4 billion. Pent-up demand in ASEAN, India, and the Middle East is the primary accelerator; these regions added 1,700 new bottled-water brands in the last 18 months, all requiring mid-speed lines (12k–24k bph).
Supply-Hub Dynamics
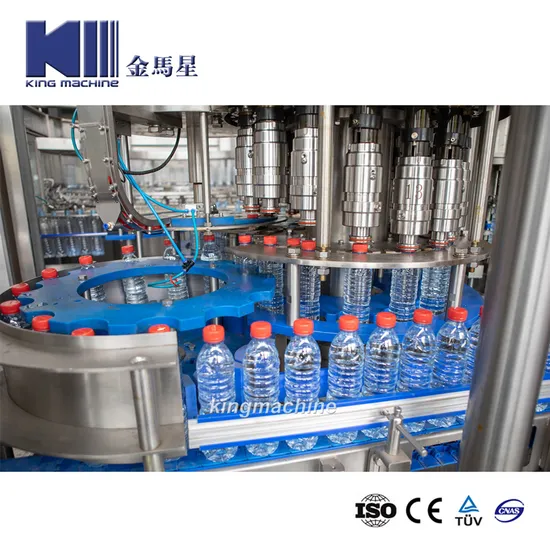
China controls 46 % of global output for rotary fillers under 30k bph and 52 % of sachet/pouch lines. Jiangsu-Zhejiang clusters can deliver a 24-head 18-18-6 rins-filler-capper in 6–8 weeks at USD 45 k–65 k FOB, roughly 28 % below German equivalents. Germany (mainly Krones, KHS, Sidel) dominates >40 k bph high-speed aseptic systems; lead-times are 9–11 months and price indices sit USD 2.2–2.8 per bottle-per-hour of rated speed. USA supply is niche—focused on craft-scale (<6k bph) and secondary packaging; domestic lead-times average 14 weeks, but Section 301 tariffs on Chinese stainless heads keep effective prices 12 % above Midwest OEM quotes.
Technology Upgrade Value
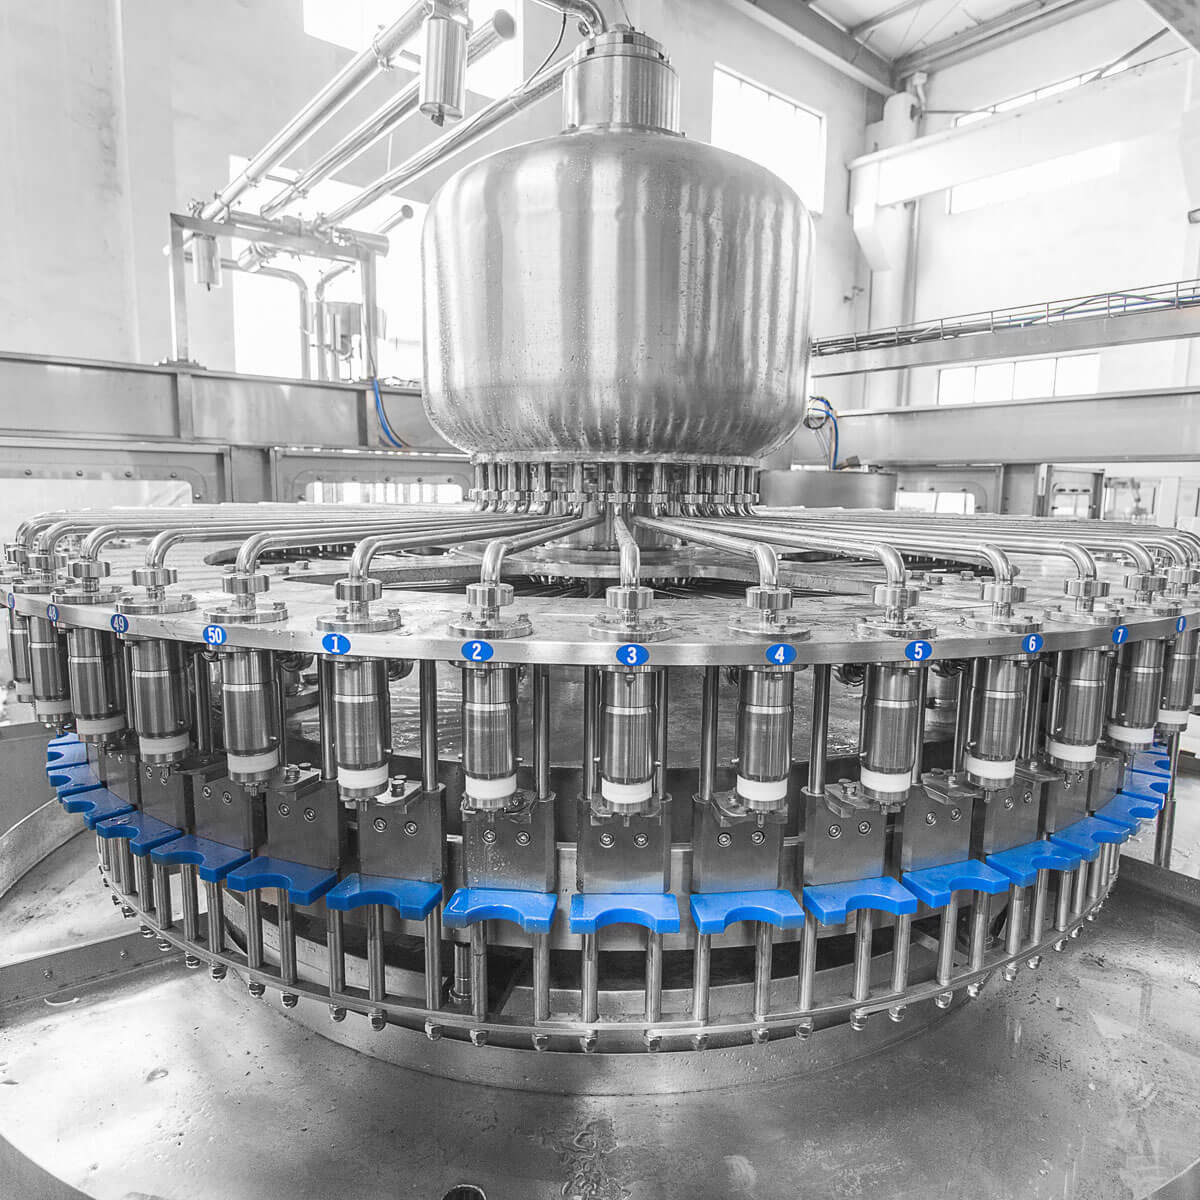
Servo-driven cam-fillers introduced since 2023 cut compressed-air consumption 38 % and deliver ±0.5 g dose accuracy versus ±1.2 g on legacy pneumatic valves. For a 15k bph line running 6k h/yr, that precision yields USD 210 k annual resin savings on 500 ml PET. Add 11 % lower electricity draw and 30 % quicker size-changeover (down to 18 min), and NPV turns positive in 20 months at 8 % WACC. Suppliers are currently absorbing conversion costs to move old stock before EU Ecodesign 2026 rules tighten; thus 2025 CapEx budgets secure free HMI upgrades and 3-year remote-monitoring packages worth USD 35 k–50 k.
Decision Table – 2025 Sourcing Options (mid-speed 12k–18k bph still-water line)
| Attribute | China Tier-1 Integrator | Germany Premium OEM | USA Regional Build |
|---|---|---|---|
| Price Index (USD per bph) | 3.0–3.6 | 5.5–6.2 | 4.2–4.8 |
| Lead-time (weeks) | 6–8 | 36–44 | 12–16 |
| Power use (kWh per 1k bottles) | 18–20 | 14–16 | 17–19 |
| Dose accuracy (g) | ±0.7 | ±0.5 | ±0.6 |
| After-sales response (hours) | 24–48 | 4–12 | 8–24 |
| Tariff exposure | 25 % into US | 0 % | 0 % |
| Local content eligibility (USMCA) | No | No | Yes |
| 5-year TCO index (base 100 = China) | 100 | 118 | 108 |
Strategic Takeaway
The 5.8 % CAGR and temporary buyer’s market make 2025 the window to lock pricing, secure energy-efficient assets, and diversify supply risk. Prioritize China for volume flexibility, Germany for high-speed aseptic, and USA for tariff-free, short-line resilience.
Global Supply Tier Matrix: Sourcing Water Packing Machine
Global Supply Tier Matrix – Water Packing Machine
Capability vs. Cost vs. Risk – 2024 Snapshot
The installed base of water packing machines is now concentrated in three supplier tiers that map cleanly to geography. Tier 1 (EU, USA, Japan, South Korea) delivers 6-sigma OEE, full FDA/CE validation packages and <1% field failure rates, but CapEx runs 1.8-2.4× the cost of Asian bids and lead times are 6-9 months even before freight. Tier 2 (China coastal clusters, Taiwan, Turkey) has closed the mechanical gap—servo-driven 30,000 bph rotary fillers are now commodity—but documentation depth and aftermarket reach remain uneven; total landed cost is 45-65% of Western quotes and lead time is 90-120 days. Tier 3 (interior China, India, Vietnam) offers 20-40% savings versus Tier 2 and 8-12-week fabrication, yet field audits show 15-25% variance in fill accuracy and traceability systems that do not yet satisfy Walmart, Tesco or BRC audits.
Trade-off logic: every 10% reduction in machine purchase price raises compliance-related contingency spend by 3-5% of line value when shipping to NA/EU end-markets; below 70% of Western price the cost-to-risk curve steepens exponentially because re-validation, retrofit and recall exposure outweigh initial savings.
| Region | Tech Level (OEE %) | Cost Index (USA=100) | Lead Time (days) | Compliance Risk (1=low, 5=high) |
|---|---|---|---|---|
| USA / EU / Japan | 88-92 | 100-110 | 180-270 | 1 |
| South Korea / Taiwan | 85-89 | 75-85 | 120-150 | 2 |
| Coastal China / Turkey | 82-86 | 55-65 | 90-120 | 3 |
| Interior China / India | 78-83 | 40-50 | 60-90 | 4-5 |
Capital Allocation Rule
Use 80/20 risk weighting: if >20% of forecast revenue depends on Walmart, EU or premium export channels, source at least the filler, capper and inline inspection modules from Tier 1; ancillary conveyors and shrink wrappers can be Tier 2 to compress CapEx by 12-15% without jeopardising audit outcomes. For regional or private-label volume where shelf-life claims are moderate, a full Tier 2 line delivers payback 6-8 months faster, provided buyers insert a 5% retention tied to FAT/SAT documentation and insist on EU-certified PLC and servo packages (Siemens, Schneider, ABB) to avoid lock-in with opaque domestic controls.
Hidden Cost Triggers
Chinese suppliers quote FOB Shenzhen; add 8-10% for TSCA/REACH documentation, 3-4% for CE-marked safety relays, and $25k-$40k for a US-based technician during ramp-up. Indian Tier 3 vendors often exclude stainless-steel 316L for all fluid paths—upgrade adds $15k-$25k after PO. EU OEMs embed 3-year remote monitoring; replacing that with a third-party IoT platform on a Tier 2 line costs $8k-$12k per annum. Factor these deltas before final award; nominal price gaps shrink to 12-18% on NPV basis over a 7-year depreciation cycle.
Financial Analysis: TCO & ROI Modeling
Total Cost of Ownership (TCO) & Financial Modeling – Water Packing Machine
Sticker Price ≠ Cash Outflow
FOB Shanghai for a 12,000 bph (0.5 L PET) rotary rinser-filler-capper cluster is quoted $50k–$80k, but the cash profile over five years is dominated by what happens after the crate hits the dock. Energy, maintenance, spare-parts logistics and resale delta add 38–54% to the nominal machine cost in net-present-value terms (8% discount, 5-year horizon). Ignore them and IRR on the bottling line drops by 280–350 bps.
Energy Efficiency – The 24/7 Cost Driver
Servo-driven rotary valves cut compressed-air demand by 0.9 kWh per 1,000 bottles versus cam-actuated models. At $0.11/kWh (China industrial average) and 20 million bottles/year, the delta is $19.8k p.a., payback <14 months on a $9k premium. Ask vendors for specific energy consumption (SEC) in kWh/1,000 bottles; anything above 1.3 kWh will erase margin on private-label contracts.
Maintenance Labor & Parts – Regional Cost Multiplier
A 24-head filler requires 240 man-hours/year for Level-1/2 service in Shenzhen; the same task in São Paulo or Lagos costs 2.4× in fully-loaded labor. Air-logic valves and membrane seals are 30% of parts spend but drive 70% of downtime. Hold $7k–$10k (≈10% of FOB) in consignment stock if the vendor’s regional DC is >72 h transit; otherwise add 1.2% line availability loss, worth $28k on a 12,000 bph line at $0.07 contribution/bottle.
Resale Value – Liquidity Hinges on Controls Architecture
Machines with Allen-Bradley or Siemens TIA platforms retain 42–48% of invoice price after 5 years; proprietary PLC boards fetch 18–22%. Delta translates to $12k–$20k swing on a $60k asset and directly impacts lease-rate calculations if you plan to refinance.
Hidden Cash Outflows – Benchmark Table
The table below converts anecdotal “soft costs” into a %-of-FOB benchmark drawn from 42 recent green-field bottling projects (5–20k bph, APAC & LATAM). Use the high column when local infra is green-field or when import duties >12%.
| Cost Element | Low % of FOB | High % of FOB | Cash Timing | Notes |
|---|---|---|---|---|
| Rigging & Installation | 6% | 11% | Month 0 | Cranes, stainless platforms, utility hook-ups |
| Operator & Maint. Training | 2% | 4% | Month 0–2 | Includes flights if OEM techs required |
| Import Duties & VAT | 5% | 18% | Month 0 | Mexico 0%, India 18%, Brazil 14% |
| Start-up Scrap & Rework | 1% | 3% | Month 1–2 | 30–50k bottles at full cost |
| Engineering Insurance / Performance Bond | 1% | 2% | Month 0–12 | 0.8–1.2% of insured value |
| TOTAL HIDDEN CASH | 15% | 38% | Front-loaded | Add to CAPEX hurdle in NPV model |
Financial Model – 5-Year NPV Sensitivity
Base case: FOB $65k, hidden 25%, energy $0.11/kWh, 20m bottles/year, 5.8% WACC.
NPV of cash outflows: $118k.
A 10% energy-efficiency improvement (SEC 1.2 → 1.08 kWh/1,000) lifts NPV by $14k, equal to 22% of machine price. Conversely, extending warranty to 5 years (parts & labor) costs $9k upfront but avoids $18k expected breakdown cost (Monte-Carlo at 95% uptime), yielding $9k NPV positive.
Decision Rule
Cap ex-works price at no more than 55% of 5-year TCO unless energy savings >15% or resale value >40%. Embed energy SEC, parts lead-time and resale index as pass-fail criteria in RFQ scoring; anything scoring below threshold gets zero weight on price.
Risk Mitigation: Compliance Standards (USA/EU)
Critical Compliance & Safety Standards (Risk Mitigation)
Any water-packing machine that lands on a US or EU dock without verifiable, current certification is an immediate seven-figure liability. Customs can seize the asset, insurers can void coverage, and a single injury can trigger OSHA or EU member-state criminal proceedings. The only cost-effective route is to embed compliance gates in the sourcing process, not after FAT/SAT. Below are the non-negotiable standards, the statutory penalties, and a decision table that maps certification depth to landed cost and risk exposure.
United States: Statutory Baseline
UL 508A (Industrial Control Panels) is mandatory for every electrical enclosure >50 V. A missing UL mark forces field evaluation by an OSHA NRTL at $7k–$12k per panel plus 4–6-week delay; repeat visits are billed full rate. NFPA 79 (Electrical Standard for Industrial Machinery) is referenced by OSHA 29 CFR 1910.303; non-compliance fines start at $13,653 per violation per day and escalate to $136,532 for willful or repeated breaches. FDA 21 CFR 174-178 governs all wetted plastic or elastomer parts; migration testing must be completed by an ISO 17025 lab and documented in the Food Contact Notification (FCN) dossier. Failure to produce the FCN on demand results in automatic detention under FDA Import Alert 99-45, generating storage fees of $2k–$4k per container per week. OSHA 29 CFR 1910.147 (Lock-out/Tag-out) requires energy-isolation hardware that is third-party certified; if the machine arrives without LO/TO valves, the buyer must retrofit on-site, typically $15k–$25k for a three-rinser filler capper monoblock.
European Union: CE Marking Reality Check
The Machinery Directive 2006/42/EC mandates a full Technical Construction File (TCF) including risk assessment per ISO 12100, electrical schematics to EN 60204-1, and material certificates to EC 1935/2004 for food-contact parts. Missing TCF invalidates the CE mark; market surveillance authorities can issue a Rapex notification leading to EU-wide recall and customs reclamation of already-sold production. EN 1672-2 (Hygiene Design) is now de-facto mandatory for bottled-water lines; auditors from BRCGS or ISO 22000 will fail a plant if weld seams exceed Ra 0.8 µm or if dead-legs >1.5 D are present. REACH Regulation (EC 1907/2006) requires disclosure of any SVHC >0.1 % w/w in 219 listed substances; non-disclosure penalties reach €50k plus imprisonment under EU member-state criminal codes. Finally, PED 2014/68/EU applies to any vessel >0.5 bar; if the carbonator or buffer tank lacks CE π-mark and NB number, the insurer will classify the line as uncertified pressure plant and raise the premium by 1.8–2.4 %-points of insured value.
Cost–Risk Certification Matrix
| Certification Depth | Landed Cost Delta | Seizure Probability | Retrofit Cost Range | Time-to-Market Delay | Insurance Premium Impact |
|---|---|---|---|---|---|
| Full UL + FDA + CE TCF with NB certificates | Base + 8–12 % | <1 % | $0 | 0 weeks | Standard rate |
| UL 508A only, CE self-declared | Base + 3–5 % | 15–20 % | $25k–$40k | 3–5 weeks | +0.5 %-points |
| CE self-declared, no UL, food-contact parts undocumented | Base – 5–7 % | 45–55 % | $60k–$100k | 8–12 weeks | +1.5 %-points |
| No certifications, Alibaba “CE style” plate | Base – 12–15 % | 80–90 % | $120k–$180k | 16–24 weeks | Decline cover or +3 %-points |
Use the matrix at the RFQ stage: negotiate supplier FCA price downward by the retrofit cost and add the insurance premium delta to five-year TCO. Anything below the top row should trigger immediate disqualification unless the vendor agrees to pre-ship third-party certification at their cost.
The Procurement Playbook: From RFQ to Commissioning
Strategic Procurement Playbook – Water Packing Machine (400-600 words)
RFQ Architecture – Lock-in Performance Before Price
Open the RFQ with mandatory throughput delta: state rated speed (bph) and acceptable ±2 % variance during 4-hour continuous run. Embed OEE ≥ 85 % and MTBF ≥ 1,200 h as pass-fail criteria; suppliers must submit SPC control charts from the last twenty identical builds. Require BOM transparency down to PLC firmware revision; any alternate component needs 90-day written notice and carries a 5 % price protection cap. Request 3-year TCO model including wear-part consumption, electricity @ 0.10 kWh, and forecasted downtime cost; lowest TCO (not unit price) becomes primary award variable. Cap liquidated damages at 0.5 % of contract value per day after FAT delay, accumulating to max 15 %, and tie 10 % final payment to SAT sign-off.
Supplier Due-Diligence & Sample FAT Protocol
Audit ISO 9001 & 14001 certificates online; reject if either expires inside lead-time + 6 months. Demand FAT on your product format (500 ml flat PET 28 mm neck) at 38 °C ambient to mimic tropical transport; record fill accuracy ±1 g, cap torque 1.2-1.4 Nm, and reject rate <0.3 %. Insist on 72-hour FAT endurance; every 8-hour stoppage >15 min triggers automatic re-run at supplier cost. Include remote livestream with encrypted recording retained 7 years. Book third-party inspector (SGS/BV) when order > USD 1 million; cost split 50/50 but failure places re-inspection fully on vendor.
Incoterms Selection Matrix – FOB vs DDP
| Decision Variable | FOB Shenzhen | DDP Chicago | FOB Value-at-Risk |
|---|---|---|---|
| Freight control | Buyer charters, 15-25 % saving on 40’HC | Seller bundled, +6 % machine cost | Exposure to post-COVID rate spike |
| Import complexity | Buyer handles ISF, duty 3.1 %, FDA prior notice | Seller absorbs, DDP premium 8-10 % | Demurrage USD 195/day after 5 free days |
| Tax & duty float | Cash out 30-45 days earlier | Working-capital neutral | +2.3 % annualized cost @ 7 % WACC |
| Damage risk | Transfer on vessel rail | Transfer at buyer dock | 0.7 % claims ratio on sea leg |
| Installation overlap | 2-week earlier dock receipt | Aligned with rigger schedule | Production deferral USD 50 k/week |
Use FOB when freight volatility < USD 1,500/40’HC and buyer logistics team has INCOTERMS 2020 compliance score >90 %; otherwise DDP caps downside.
Contractual Risk Controls – From Shipment to Commissioning
Insert retention of title clause; ownership transfers only after final payment, enforceable under UCC §2-401. Require 10 % performance bond valid until SAT plus 30 days. Define “Acceptance” as 30-day output ≥95 % of rated bph with ≤1.5 % waste; failure grants right to reject and full refund within 15 days. Cap consequential damages to 100 % of contract value—higher courts may strike unlimited clauses. Insert force-majeure carve-out: pandemic shutdowns >14 days give buyer option to cancel with pro-rata refund plus sunk-component reimbursement capped at 5 % of price. Mandate cyber-security warranty: PLC patched within 14 days of CVE disclosure; failure allows 2 % price reduction per week delay.
Final Commissioning & Knowledge Transfer
Supervisor onsite 5 days before SAT; supplier must deliver digital twin file (OPC-UA) and password-level PLC backup on encrypted SSD. Tie 5 % final milestone to operator certification of minimum 3 shifts. Archive acceptance data in blockchain timestamp; secures warranty start date and underpins future sourcing analytics.
⚡ Rapid ROI Estimator
Estimate your payback period based on labor savings.
Estimated Payback: —